AUDUSD LONGAUDUSD-Daily chart price reversed from a daily support zone
and it's showing Divergence on the MACD Which indicates that the down move might be over
price has the potential to move towards the descending trend line and even higher if it broke it,
we will be waiting for a 1hour bullish opportunity.
Good luck!
Forex-analysis
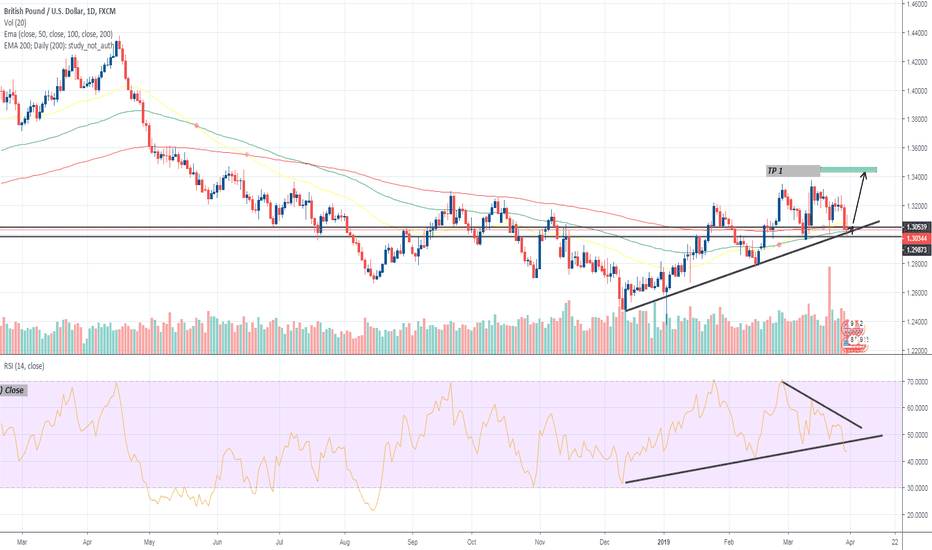
GBP/USD RATE DAILY CHARTThe broader outlook for GBP/USD is no longer bullish as both price and the Relative Strength Index (RSI) threaten the upwards trends from late last year, and the advance from the 2019-low (1.2373) may continue to unravel following the string of failed attempts to close above the Fibonacci overlap around 1.3310 (100% expansion) to 1.3370 (78.6% expansion).
Recent series of lower highs & lows raises the risk for a further depreciation in GBP/USD, but need a break/close below the 1.2950 (23.6% retracement) to 1.3000 (61.8% retracement) area to open up the next downside hurdle around 1.2880 (50% retracement) to 1.2890 (23.6% expansion).
The 1.2760 (38.2% retracement) to 1.2800 (50% expansion) zone comes up next followed by the overlap around 1.2610 (23.6% retracement) to 1.2640 (38.2% expansion).
USDJPY FREE PIP GIVEAWAY?I see a monthly falling wedge pattern, and a nice single candlestick reversal formation at a key monthly supply zone signaling a possible reversal. Taking out my fibs from low to high I get some confluence at the monthly 110 zone most likely a 61.8 retrace and shoot up giving us about 600-1000 pips.
AUDCHF short on the hourly rejection candleI actually published a trade idea on this pair before, but off of the weekly time frame where the trade held resisted over on the weekly time time frame. However, I did want to scale into this trade as I was not able to catch this trade right at the weekly resistance. Seeing this hourly time frame, we can observe a rejection bar that signals this pair will most likely swing low once again.
EUR/USD - Bullish view!it touched the bottom of trend line, and a key support & resistance area. First target is a little below the second support & resistance area. If you want, you can let the trade run to the trend line above. But make sure that your stoploss is at breakeven and it is showing that it wants to go to the upside.
Happy trading!
DXY/USDOLAR BEARISH HEAD AND SHOULDER DXY/USDOLLAR breakout of head and shoulder (H/S) pattern where price has broken and retested broken neckline to continue bearish with stoploss at 94.86, takeprofit1- 93.39, 93.13, 92.21 and a 1/2.7 R:R RATIO (190pips) price also moving in bearish channel where further breakout of channel confirms bearish H/S scenario. GOOD LUCK
NZD/CAD TO FALL IN THE COMING WEEKS
In its last Interest rate statement, the Reserve Bank of New Zealand, stated that it expects to keep interest rates at a record low for another two years as the outlook for economic growth weakens. According to a
Bloomberg Report, the Central has said that the chances for a rate cut has
increased.
This has caused the New Zealand dollar to become a less favorable currency for investors to invest in hence the recent drop of the currency against major currencies. On the other hand, today Canadian CPI beat expectations
which has increased the likelihood of the Bank of Canada to increase interest rates. Now comparing the two, we have a clear distinction between these two currencies.
The 1 Hour time frame for the NZD/CAD pair has it rising towards the 0.8680s which will probably serve as the point for reversal to target 0.85700 region.


