AUDJPYAUDJPY had reached out target at the 80.8 level of support. It has since broken under and is not going back to retest the level. We will wait to see if it respects the level as resistance or breaks above.
Forex-analysis


DXY - BullishHere we have the DXY on the weekly, what we are looking for is a drive lower to push out the now 'Net Longs' and to put them offgurad and to attract short sellers into this market.
Next we next to see a higher low somewhere in the regions of the highlighted area, in order to look for SHORT opportunities in the likes of:
EURUSD
AUDUSD
GBPUSD
NZDUSD
OR by going long on the FXCM USDollar index.
This of course may not happen however this is something we are keeping a very watchful eye on for the next couple of months.

XAUUSD (Gold) Will price respect this level ??XAUUSD - here is my analysis on GOLD I am WATCHING the the 1240 price region which i have marked with a yellow support zone it
would be interesting to see what happens around this zone in the next couple of weeks.
i am looking to see if price can respect this zone and make its way back up - heres what else we would need to see in order for
that to happen check updates in comments section !

XAUUSD potential bullish movement over coming weeks Gold could very well continue to respect this long term uptrend with price likely to reach this region over the next week. Be patient and look for a strong reversal signal before entry.


TARGETS ACHIEVED!WELL, WELL, WELL!
OUR TARGETS WERE ACHIEVED.
Truth be told guys, I actually got out of this trade a lot earlier than I should have.
Our zones of 82.000/81.000 were shot through!
If you were successful in trading this pair, message me and let me know what you were thinking!
Remember guys, keep pushing and keep striving!
Thanks for watching!
A long position on this pair is possible, however we'll see!
STAY TUNED!

NZD/CAD GREAT TRADE ! BIG SHORT FOR THE PATIENT ONES!Good Evening Everyone,
Where the market is currently at is still a terrific entry point for a long term trade (5 - 7 Days).
Terrific Risk/Reward.

NZD/USD Long OpportunityI never traded NZD pairs because i never made profits from them but this setup here is looking lovelyyyy...
Buy Stop - 0.69500
Stop Loss - 0.68800
Take Profit - 0.73300

EURJPY LONG TERM DOWNSIDE?EURJPY SELL LIMIT @ 131.300 (Entry Updated)
SL @ 132.200
TP @ 125.900
TRADE SAFELY!

pound yen analysis at the moment we are getting close to an important trendline ie purple line, these are the reactions I could see happening off this line
Happy trading Kris

GBPUSD H1 ShortIf you want more informations about this trade, feel free to joins us in our free facebook group: Groupe de World Forex Solution. Most of us speak french, but english people are accepted too!

GBPJPY MORE DOWNSIDE AFTER CPI?sell limit @ 152.850
SL @ 153.450
Target @ 150.500
Use good risk management

EURCAD BULLISH REVERSAL?Buy limit @ 1.55330
SL @ 1.54650
TP @ 1.57600
Use good Risk management, current counter trend trade.

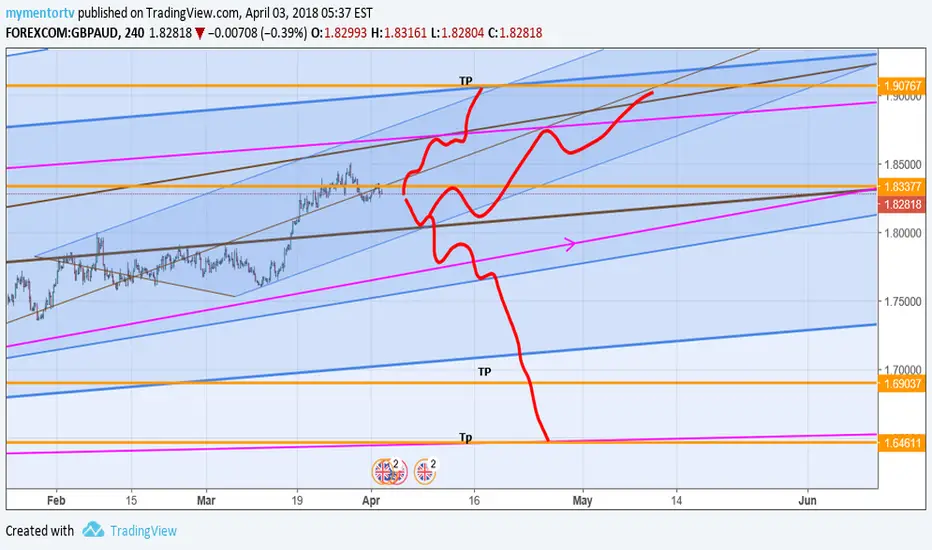
pound aud anaylsis of what to expect here is my analysis of the three predictions I see this playing out we will see how we go , any questions let me know
Kris
happy trading
usd yen analysis this is what I see with this market so far
I have included a description of my ideas any questions please ask and I'm happy to help

pou nd yen long this is what I see happening with the pound yen , I see the market hitting tp1 : However if this changes I will need to revaluate my analysis

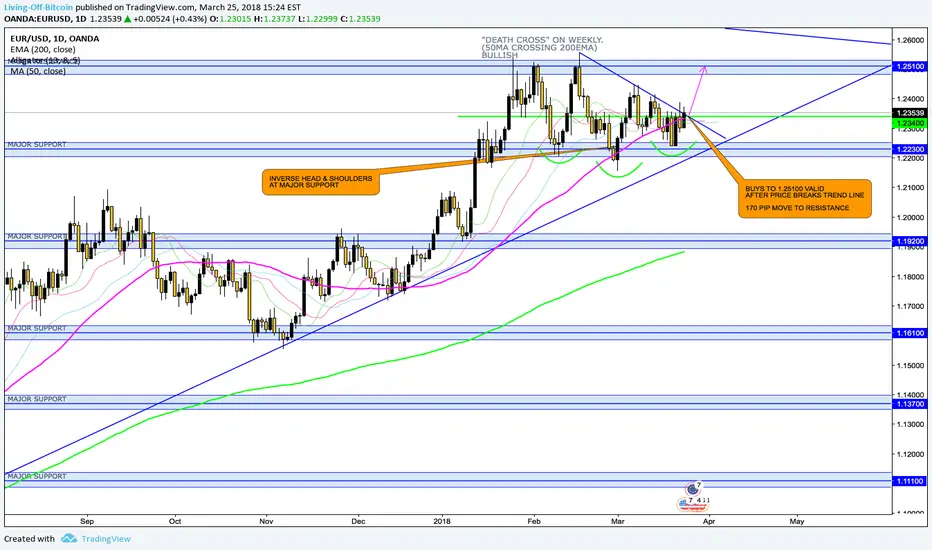
EUR/USD ANALYSISMAJOR INVERSE HEAD AND SHOULDERS ON SUPPORT
BUYS TO 1.25100 VALID
AFTER PRICE BREAKS TREND LINE
170 PIP MOVE TO RESISTANCE
pound aud long till the 50 area hi everyone
this trade will be tp at the 50 area then we will see a correction afterwards
happy trading Kris

USDJPY 1HUDJPY is playing out as planned. The expected pullback has/is occurring at the 106.4 area and now we just wait for the correction to complete.

AUDJPY 4H UpdateAs you can see we have broken the descending trend line and are currently bullish. A few possible scenarios can play out. Either the pair will retest previous support which coincides with the 70.7 fin retracement or continue its rally to the next zone.

eur yen short Hi everyone
Here is my analysis on Euro Yen
I see this market going short , choppy all the way down to my orange tps with an end goal at the bottom which I have shown u .
happy trading
KRIS

NZDUSD UpdateAs you can see the NZDUSD pair on the 1hr chart is approaching the trend-line set my the previous descending highs. We will see how this plays out. The market makes the same setups every time. Wait for a break to the upside or a bounce back hopefully to the next daily support.
