Looking to Long AUDUSD - Fibonacci Retracement 61.8 Due to uncertainty in US tax reform, USD pared gains and based on the chart, market is in range now. However overall, it is still uptrend based on D1. Possible reversal if did not break below Fibo R 61.8
Reward to risk for this analysis is 10: 1
Forex-analysis

Looking to short NZDJPY on ABCD patternNew Zealand new Prime Minister Labour Party Ardern is implementing new policies such as reducing immigrants can affect the economic growth. Also lack of details in RBNZ cause uncertainty about future monetary policy outlook. So I am bearish on NZD
From the chart, market is actually moving side way (200ema is flat). However, since the election, NZD has dropped significantly and price is below 200ema. There is a downward bounce (ABCD) formation. I am looking for pullback and short at previous low.
Reward to risk for this analysis is 5 : 1

USDCAD Testing D1 200emaOil price continues to rise as US inventories data fell and OPEC remain firmed to cut oil supply. Oil price is correlated to CAD movement so my sentiment is there could be a sign of reversal if market cannot break above 200ema on D1.
Looking to short if H4 retest at 200ema or form a LH and LL to short. FTP to at Fibo R 50.0%
If price break above 200ema this analysis will be invalid.
The reward to risk for this analysis is 5: 1

Just a simple trade idea of a head and shoulder formationThe head and shoulders pattern that could possibly form from just a technical standpoint. I am by no means an expert on trading, I am still learning. I'm just practicing ideas and documenting them to further my understanding on chart analysis and techniques in the forex market. My goal is to find patterns to train my mind and my eyes in what to look for technically. my drawing skills are shocking too, so just a heads up.

Looking to Short GBPUSD on Bear Bat PatternIf tomorrow BoE rate decision see a rate hike, it will push gbpusd up to 1.5000. However, my sentiment is that it will not be a long-term bull as Brexit talks is still a concern that that affect UK economy adversely. I looking to short on Bat formation at Fibo R 76.8
Reward to Risk is 10: 1
If price closed above 1.3655, this analysis will be invalid

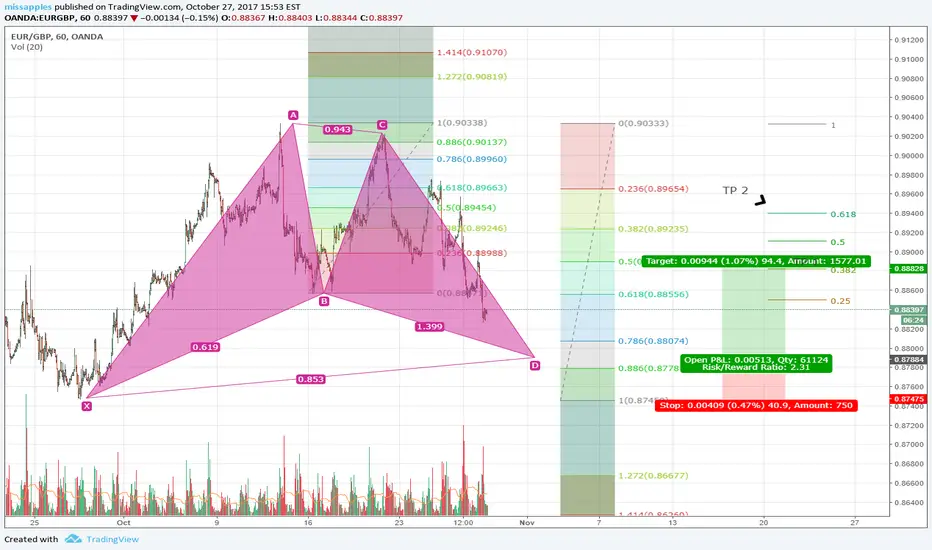
EUR GBP bullish gartly patternA nice gartly pattern is forming. wait for the .786 or the .886 retracement on point D before placing longs. SL below X. TP on the .382 and the .618
USD/JPY Trend- MAJOR FUNDAMENTALS WEEK Last week USD/JPY was moving up in a nice bullish market structure on its way to the major daily level around 114.500. It was making a series of HH and HL throughout the week before hitting the major resistance on a news release last Friday. After the major resistance we saw a nice rejection and bearish close near a support zone. Should be interesting to see how/where price opens in accordance to the support area.
This week we could see some continued bearish price action to the major 113.250 area or a push up for liquidity back to the major supply zone from last week. I believe at some point we could strike 113.250 this week but with all the high impact fundamental events on the calendar this week it's hard to determine exactly when/how these moves will play out so its best to just follow price action as it develops. It's also a possibility that with the increased volatility that could take place this week if we are able to break one of these major zones clearly (Resistance @114.500, Support @113.250). This would open the door for further directional price action.
The major high impact events on the calendar this week include NFP Nov.3, interest rate decisions for USD (Nov.1) and JPY (Oct.31) and other events for USD, CAD and GBP.

USD/JPY On the MoveLast week we saw it was very bullish for UJ. The first week in about a month where we saw good trending price action. Previous weeks were filled with a lot of consolidation and ranging price action. On Friday price broke a major level around 113.500 and the last time we saw price rise above these levels was in July.
This week we could see a continuation of this uptrend after some consolidation or a slight pullback as we have already had a lot of consolidation over the past month now is the time where a trend can continue. The most logical upside target would be about 100 standard pips away at 114.500. What will happen at this level is uncertain whether we keep going up or make what would look to be a triple top at this level. However if we do continue up 115 would be next.
Fundamentals/News this week looks light, some high impact news but nothing out of the ordinary for USD. More importantly the focus would be on the geopolitical issues (Trump & NK could change the outlook for USD/GOLD fast.) and also Trump's new tax reform plan and the replacement for Fed Chair Janet Yellen.

EUR Pound short and the reason why Good evening everyone
SO currently I am in this trade shorting the reasons why are the following:
If you look at the weekly and daily sellers where my stop is sellers are showing their strength in pushing this market down
engulfing candle followed by a daily confirmation of breaking down towards lower lows
Conclusion: My target is either tps at the same time we will need to watch how this market reacts to the tp :
Either the Euro shoots through the tps and goes down further or we go back up after hitting the tps
Any feedback I am all ears and looking forward to any questions you may have
Kris
www.mymentortv.com
Facebook: mymentortv
Instagram: mymentortv

USDJPY Oct. 9- Oct. 13Last week analysis called for a week of consolidation after a strong trending market. We had a lot of consolidation staying within the 112.25-113.25 range. NFP results were positive for USD and caused price to break this resistance but then quickly rejected the next zone and returned to our range.
For this week price is still in an uptrend but has lost some momentum due to the accumulation of orders for the past week. So far it looks as if price should go to retest the major support after rejection on Friday. This is a zone I would watch closely as if we reject this support again I think we can bring momentum back to the uptrend to the target of 114ish area. (Daily Supply Zone) But if we break the support zone we could have a potential trend change.
Fundamentals are light this week.. mid week Fed meeting minutes will be of the most impact as fed members have been increasingly hawkish moving the chance of another rate hike this year to 77% from 70%. (credit to investing.com for those numbers).
Lastly.. previous week longer term analysis still stands and is valid.


Sterling : Life beyond the shackles Last year in June, United Kingdom's majority chose to leave the European Union. This year on March 29th Prime Minister Theresa May invoked Article 50 of the Lisbon Treaty, officially stamping the process to sever ties with the bloc.This brings to end a 44-year-old relationship that always had National political parties at odds, will the UK be better off without the Union or with.Most economists hold a negative view of the Brexit.They warned the public that a Leave win could have acute but serious consequences for UK economy, an immediate increase in unemployment, inflation etc. Their predictions were wide off the mark.Although inflation increased unemployment is at a record low since 1975.This is a good indication that separation from EU would be good for the UK economy in the long run.The UK once fully segregated from the Union and the regulatory burdens of trade policy could benefit immensely by adopting their own free trade policy with major world markets.
There are more than 2 million EU nationals working in the UK, a divorce would give British government control back over who it allows to live and work, hence more work opportunities for Britons.After Germany, Britain is the second biggest contributor to the EU budget, leaving EU would mean all that money would be used for the national budget.But what the UK actually stands to gain will depend on the terms of negotiating with EU.It might be possible that EU could force UK to keep contributing to EU budget if they want access to EU Single Market.There have been hints that Britain will have to pay a hefty exit fee to EU that could run into tens of billion Pounds.Whether Brexit will bring about economic gain or loss for the UK can only be speculated as of now.I am not an economist but an investor and a trader, from my standpoint the worst for GBP is over.
Pound in the midst of US Civil War in 1864 reached a value of $10. After the high of $10, its value started to drop and continued the downward slope for over a century against USD. A drop that started in 1864 halted in 1985, which almost brought it down to parity with the USD at 1.0438.I believe that the low of 1985 will remain to be a historical one as I do not see that low being taken out for decades.An unprecedented event like Brexit threw Sterling in a tizzy, it dropped over 1800 pips against the USD in one day after a Leave win was confirmed. And over the next few months, it kept trading lower and stabilized after hitting a low of 1.1980 in October 2016.Now it has started to get back up and is gearing to move upwards from here.The low of October 2016 will remain a very strong support for a long time to come.
Coming to the analysis I'm expecting GBPUSD to make a short-term high in last week of October or first week of November. Then a low in last week of November to the first week of December. high in the first week of January and a major low around the first week of February. Then major high around last week of February or first week of March. Highs should be higher highs unless a low is broken, and lows to be higher lows as well.
As always, will update as and when changing dynamics necessitates so.


USD/JPY OCT NFP WEEK Last week USD/JPY continued its uptrend with some strong momentum. Price has made its way all the way up to major resistance zones. After some slight rejections we could see a retest and then some consolidation between a support zone. It doesn't seem likely for a breakout just yet as we have been trending strongly and need some time for accumulation of orders before further price movements. We could see a directional breakout due to the many fundamental events on the calendar for this week including NFP Friday Oct 6. Regardless of these fundamental events our zones are plotted and most importantly we have a plan.

USD/JPY- Post FOMCUSD/JPY has been on a strong rally since breaking a major support a few weeks ago. Since then price has had a lot of bullish momentum helped by hawkish FOMC statements from the Fed and has risen quickly to a major daily resistance zone. Seeing how price reacted to this zone at the end of the week shown some rejection and a break in the minor support and TL. We then moved to a major support zone and started some consolidation.
This week I would look for a retest of the new resistance and TL this could be a possible sell setup if we don't move past that zone. We have a lot of fresh zones created from the move up so these will fill up in time and we can use these for downtrend targets. Some consolidation is also a possibility due to the quick rise in prices over a short period of time. We can use the correlations with gold to get the best timing possible to get on a move which ever way it goes.
Longer term fundamentally we could see a softer dollar due to rising geopolitical issues but the good news is that the Fed sounded fairly hawkish in its plans to continue to raise rates and balance fiscal policy.

$EURUSD Analysis
We can see that the pitchfork points us down. The top and bottom trend lines form a slight downward channel. If this continues, we will see it come to a triangle. However, when the pair retest the broken trendline as shown in the graph (sorry for my messy work), the downward trend will be confirmed if the support turns into a resistance. If else, it will continue to move between the channel forming a wedge.

USD/JPY- Out of the SlumpThe past few weeks have seen very little bullish price action on USDJPY and at the end of last week we set a new low for 2017. This new low has been a good buying opportunity for dollar bulls as price action was very bullish this week breaking resistance zone after zone.
This week we could see a continued push up for USD as the momentum and the bounce off major support could indicate this. The overall target could run to around 112. We have major fundamentals with FOMC mid week Wednesday so this could dictate further price action direction. A retest of the trendline or 14/50 EMA on 4hr chart could be a good buying opportunity to take price higher.

XAU/USD (GOLD) - Trend Analysis Gold has been very bullish over the past few weeks making new highs in 2017, however this past week we have seen some (not all) of this bullish momentum slow down as we bounced off a major resistance past 1350 late last week. Since this happened, this weeks price action has actually been bearish and right now we can see that we are in a descending channel approaching a support that was tapped last week. With sufficient bearish momentum we should break this level around 1315 and head back to 1300. The other possibility is the 1315 level holds and we move out of the channel and maybe make a series of higher highs and higher lows, restarting the uptrend to new highs. A catalyst for one of these moves could be the FOMC meeting this Wednesday.

USD/JPY Melted Last week USD/JPY finally broke past its major support around 108 level to drop to fresh lows for 2017. There is no support in sight expect a late year Trump rally in November 2016. Maybe we will start to trend lower for some coming months late in the year like last year after consolidation for most of 2017.
This week though we should still see some continued move down. Possible retracement after such a large drop is possible as well which could provide as new selling opportunities as this old support will now act as a major resistance level. This breakout looked imminent over the last couple weeks price action.

Short CHFJPY/AnalysisCHFJPY daily H&S setup is making very choppy moves around the key level at 115.00. Our bias is still bearish and we are planning to sell this pair to take advantage of this setup once more.
Español: Este par muestra un posible patrón de hombro cabeza hombro. Ha rechazado el nivel 115.000. Pensamos que seguirá siendo bajista. Venderemos para conseguir beneficios en este par una vez más.

Short AUDNZD/Analysis We are preparing for AUDNZD shorts. All we have to see is a clear break of this ascening trendline. A clear break on hourly or H4 timeframe will open much space to the bottom. We are patiently waiting and only rely on technical facts. If there's no break we simply won't enter. A breakout to the top could signal a buy.
Español: Nos preparamos para Cortos en AUDNZD. Necesitamos ver una ruptura clara en la línea de tendencia. Si ocurre la ruptura, buscaríamos alguna confirmación para nuestra entrada enmarcos de una o 4 horas. Nos mantenemos esperando tranquilamente unos guiamos por hechos técnicos solamente. Si no hay ruptura, no entrarémos. Una ruptura en el tope podría indicar compra
