GOLD BROKE 1300 ELECTION WICK FILLLast week gold had a nice market structure and followed analysis very well as I was anticipating a breakout past 1300 after previous weeks consolidation underneath this major zone. Since there was some geopolitical issues between the USD and NK gold had an extra shot of strength in its bullish trend. After this major push price needed to retrace as profit taking was going on. Price returned for the first time back to the FTR zone at 1300 (major zone) this was a good buy opportunity as price rejected 1300 to keep prices above it. After returning to the previous high price was in consolidation after NFP produced some whipsaws that are dangerous for retail traders (traps). Price still has bullish momentum based on the EMA cross and spread. Also USD has a down bias and although USD/JPY inversely correlated pair has been moving up as well over the short term we could see a small retracement or accumulation before continuation. Ultimately the massive liquidity wick created back last November on US elections day could be filled as we move towards 1330-1335 area.
Forex-analysis

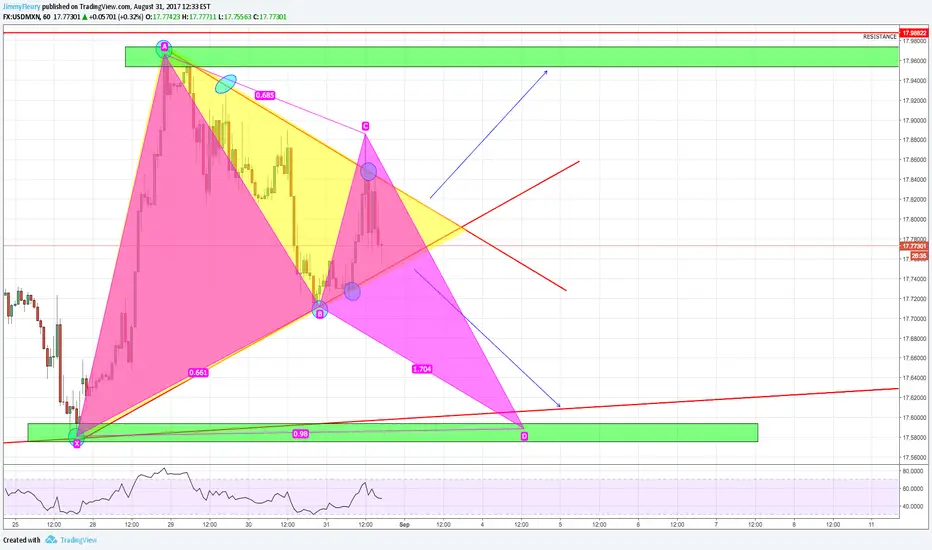
usdmxn neutralpossible harmonic patern but always wait the breakout of this yellow triangle!
usdmxn good pips after the bo !


Short on GBPJPYPrice recently has respected a key daily resistance level and has given me reason to entry.

#USDCAD D1 #LONG #BUYRisk Disclaimer: This post is not a trade signal.
Trading Forex is highly speculative and carries a high level of risk. It is possible to lose all your capital. These products may not be suitable for everyone and you should ensure that you understand the risks involved. Seek independent advice if necessary.

USD/JPY- Start of Bullish Market Structure. Based on this UJ 4hr chart we can see a few things that are showing some signs of a trend change. We had a double bottom pattern form in a major daily support zone with the 2nd leg shooting off after a positive NFP release. Also a 3rd touch on a ascending trendline can be observed on the daily chart. Another thing to note is the EMA starting to slow down and move sideways after a long momentum filled push down. We saw price break above the 14ema and find resistance at the 50 ema now if prices are to move up we should use the 14EMA as a new support zone. I have indicated the target zones/areas for a potential upswing.

EURGBP Near Term Move - 9 August 2017EURGBP made a recent high of 0.9087 on 8 August 2017 after coming out from a recent low of 0.8742 on 14 July 2017. A technical formation known as shooting star was formed on 8 Aug 2017 and the question is whether investors should initiate a bearish move on this cross. Based on our forecast and the directional bias up to this point, it would appear that there is an immediate bearish bias on this cross and if such bearish momentum continues, we could potentially see this cross retrace to 0.8955 level as our first target and if this level is broken, 0.8915 as our second target. On the other hand, the overall trend on this cross remains an uptrend. Investors who believe that this uptrend continues and see potential price target at 0.9180 at the first level and 0.9300 at the second level.
DISCLAIMER
Our research materials are provided for information purposes only. They should not be used or considered as an offer to sell or a solicitation of an offer to buy any securities. The research materials are prepared for general circulation and general information only. They do not take into account the specific investment objectives, investment knowledge and experience and financial situation of any recipient. Investors seeking to buy or sell any securities discussed or recommended in our research materials, should seek independent financial advice relating thereto and make his/her own appraisal of the tax or other financial merits of the investment.
Any opinions expressed are subject to change without prior notice. Our research materials are based on information from various sources believed to be reliable. Although all reasonable care has been taken to ensure that such information is not misleading, we make no guarantee, representation or warranty, expressed or implied as to its accuracy, adequacy or completeness. We do not accept any liability whatsoever for any direct, indirect or incidental, special or consequential loss of any kind arising out of the use or reliance on the information in our research materials.

EURAUD SETUP THAT MAY INTEREST YOU.This is a simple setup that may interest you. Check it out. Find a suitable entry. Manage your risk well. Have patience. And wait for the results on the other side of the trend. Peace.


Nvdia Both Sides PlayI am expecting a both sides playout on this pair looks good it has more chances of drop than going up let us see what happens.

GBP/JPY Analyst long chartAfter breaking the level of 144.281 will try to drop to the level of 142.372, and after touching the daily trend line will rebound significantly towards the level of 147.674

(EURGBP) Weekly Chart AnalysisEURGBP price broke the resistace level of 0.88600 last week but by the end of the week price pulled back down and the candle closed below the resistance level.By doing that price formed a shooting star candle which is a really powerful reversal candle.
In this week we might see another retest of that resistance level.
If price manages to bounce back from that resistance level again then a possible target would be the price zone between 0.84000-0.83000.


GBP/USD - SHORT TERM - M30 - BUY ALERTIf breaks entry level before stop loss then that means is activate so i will go for it... Good luck... Based on my EYES Indicator...

GBPAUDI think price has reached a critical trendline thats been well respected and also it is on a support and resistanse zone, lastly price is also on the 68% retracement, im expecting a fall!

EURCADI think price is at a critical support and reisstance zone so im expecting price to bump up to the 38% retracement.

CADCHF - Nice Bullish Bat SetupGreat buy oppertunity. Wait for your stochastic before you consider buying this trade setup. Best option is to place a buy stop. Ill update this chart more for you guys. Lets see what happens.
Please always use risk management. It helps. :)


CADJPY trendline rejection 4h-1D chart rejecting a trendline.
Potential short trade when bearish candles occur.

