ADA/USDT : Get Ready for another Bullrun (READ THE CAPTION)By analyzing the #Cardano chart on the 3-day timeframe, we can see that the price is currently trading around $0.59. After sweeping the liquidity below $0.51, our bullish outlook for the next upward wave has strengthened significantly.
I'm now expecting a strong move from ADA, with short-term targets at $0.61 and $0.76, and longer-term targets at $0.93, $1.05, and $1.33!
Please support me with your likes and comments to motivate me to share more analysis with you and share your opinion about the possible trend of this chart with me !
Best Regards , Arman Shaban
Forex-gold

GOLD - Price can grow to resistance line of wedge patternHi guys, this is my overview for XAUUSD, feel free to check it and write your feedback in comments👊
Some time ago price bounced from $3390 level and declined, but soon turned back and even entered to resistance area.
After this, the price dropped from this area and then started to grow inside the wedge, where it at once made an impulse up.
Price reached $3390 level one more time and broke it, after which it continued to grow to the resistance line of the wedge.
When it reached this line, price turned around and in a short time declined below $3390 level, breaking and then made a retest.
Later, Gold broke $3300 level and fell to the support line of the wedge, after which it rose to the resistance area.
Now I expect that Gold can make a correction to almost support line and then bounce up to $3320 resistance line of the wedge.
If this post is useful to you, you can support me with like/boost and advice in comments❤️
Disclaimer: As part of ThinkMarkets’ Influencer Program, I am sponsored to share and publish their charts in my analysis.

SMC Trading Basics. Change of Character - CHoCH (GOLD FOREX)
In the today's post, we will discuss one of the most crucial concepts in SMC - Change of Character.
Change of Character relates to market trend analysis.
In order to understand its meaning properly, first, we will discuss how Smart Money traders execute trend analysis.
🔘Smart Money Traders apply price action for the identification of the direction of the market.
They believe that the trend is bullish ,
if the price forms at least 2 bullish impulse with 2 consequent higher highs and a higher low between them.
The market trend is considered to be bearish ,
if the market forms at least 2 bearish impulses with 2 consequent lower lows and a lower high between them.
Here is how the trend analysis looks in practice.
One perceives the price action as the set of impulse and retracement legs.
According to the rules described above, USDCAD is trading in a bullish trend because the pair set 2 higher lows and 2 higher highs.
🔘Of course, trends do not last forever.
A skill of the identification of the market reversal is a key to substantial profits in trading.
Change of Character will help you quite accurately identify a bullish and bearish trend violation.
📉In a bearish trend, the main focus is the level of the last lower high.
While the market is trading below or on that, the trend remains bearish .
However, its bullish violation is a very important bullish signal,
it is called a Change of Character, and it signifies a confirmed violation of a bearish trend.
In a bearish trend, CHoCH is a very powerful bullish pattern.
Take a look, how accurate CHoCH indicated the trend reversal on Gold.
After a massive selloff, a bullish breakout of the level of the last lower high confirmed the initiation of a strong bullish wave.
📈In a bullish trend, the main point of interest is the level of the last higher low. While the price is trading above that or on that, the trend remains bullish.
A bearish violation of the last higher low level signifies the violation of a current bullish trend. It is called a Change of Character, and it is a very accurate bearish pattern.
Take a look at the example on Dollar Index below.
In a bullish trend, bearish violation of the last higher low level
quite accurately predicted a coming bearish reversal.
Change of Character is one of the simplest , yet accurate SMC patterns that you should know.
First, learn to properly execute the price action analysis and identify HH, HL, LL, LH and then CHoCH will be your main tool for the identification of the trend reversal.
❤️Please, support my work with like, thank you!❤️
I am part of Trade Nation's Influencer program and receive a monthly fee for using their TradingView charts in my analysis.

XAUUSD Daily Update: Gold Enters "Strong Bearish MomentumXAUUSD Daily Update: Gold Enters "Strong Bearish Momentum" – Where Are the Opportunities?
Hello TradingView Community!
Hot news from the Gold (XAUUSD) market today! We've just closely analyzed the Daily Chart and spotted a crucial signal: Gold's downward momentum is extremely strong and clear! This indicates that the short-term trend may have shifted, or selling pressure is currently overwhelming other supporting factors.
🌍 Current Macroeconomic Context (A Multi-faceted View):
Previously, we discussed how a weaker USD might support Gold. Indeed, concerns about the Fed's independence (due to rumors of Powell's replacement) and expectations of Fed rate cuts have pushed the USD lower, typically a positive for Gold.
However, the market isn't driven by just one factor. The sustained ceasefire between Israel and Iran is reducing Gold's safe-haven demand. It appears that, at present, factors like decreased safe-haven demand and potentially strong technical breakdowns are prevailing, creating significant selling pressure on the daily timeframe. We also need to emphasize that the market remains very cautious about confirming a bottom for Gold, and we are still awaiting crucial US economic data (especially PCE on Friday) and FOMC speeches.
➡️ In summary: While a weaker USD theoretically supports Gold, the price action on the daily chart clearly shows bears are dominating. We must respect this signal and adjust our strategy accordingly.
📊 XAUUSD Technical Analysis (Focus on Daily Chart - Strong Bearish Momentum!):
Based on the strong bearish signal from the Daily timeframe and key price levels from the chart (image_e9d325.png):
Primary Trend on Daily: Clearly strong bearish momentum. Large, consecutive bearish candles breaking previous support zones indicate overwhelming selling pressure.
Resistance Zones (Potential SELL Opportunities - where price might retrace before falling further):
3313.737 - 3315: This is the nearest and most important resistance area. If the price retraces here, it could present an opportunity to sell.
3321.466 - 3330.483: A stronger resistance zone, if price retraces deeper.
3341.947: Extremely strong resistance, unlikely to be reached in this context unless there's a major trend-reversing news event.
Support Zones (BUY Opportunities - extremely cautious, only for Scalp or clear reversal signals):
3294.414: Immediate support, but could be easily broken if bearish momentum persists.
3276.122: The next support area if the price continues to fall.
3264.400: This is a very strong support and a potential downside target if bearish momentum holds. Consider BUYs here only if price hits this level and shows clear reversal patterns on smaller timeframes.
🎯 Updated XAUUSD Trading Plan (Prioritizing SELLs):
Given the strong bearish momentum on the Daily chart, we will prioritize active SELL entries and approach BUY scalps with extreme caution, only at very strong support levels or with clear reversal confirmations.
1. ACTIVE SELL TRADES (Priority):
SELL ZONE 1 (Selling at near resistance):
Entry: 3313 - 3315 (If price retraces to this area and shows bearish rejection candle patterns on H1/H4)
SL: 3320 (Just above the nearest resistance)
TP: 3310 - 3305 - 3300 - 3295 - 3290 - 3280 - 3276.122 (Next target according to the chart) - 3264.400 (Final target if strong bearish momentum continues)
SELL ZONE 2 (Selling at stronger resistance - if deeper retracement):
Entry: 3331 - 3333 (If price retraces deeper and shows reversal signals)
SL: 3337
TP: 3326 - 3320 - 3316 - 3310 - 3305 - 3300 - 3294.414
2. CAUTIOUS BUY TRADES (Only for Scalp/Clear Reversal Signals):
BUY ZONE (BUY SCALP AT STRONG SUPPORT):
Entry: 3266 - 3264 (Only buy if price hits this zone and shows clear reversal signals on M15/M30, such as reversal candle patterns, RSI divergence, etc.)
SL: 3260 (Very tight, acknowledging higher risk)
TP: 3270 - 3276.122 - 3280 - 3284 - 3290 (Aim for short TPs, no expectation of prolonged uptrend in strong bearish conditions)
INTERMEDIATE BUY SCALP:
Entry: 3284 - 3282 (If price has broken down through here and retraces, wait for confirmation)
SL: 3278
TP: 3288 - 3292 - 3296 - 3300 (Short-term targets only)
⚠️ Crucial Factors to Monitor Closely Today:
Price Action at Resistance/Support Levels: How price reacts at these key marks will dictate the next move.
US Macro Data (especially PCE on Friday): Any surprising news can rapidly reverse the current trend.
FOMC Speeches: Can induce significant volatility in USD and Gold.
Geopolitical Situation: Although currently optimistic, any unexpected developments could reignite safe-haven demand.

HelenP. I Gold may continue to decline to support levelHi folks today I'm prepared for you Gold analytics. After dropping from the support zone, the price of Gold found temporary support near the trend line and started to rise again. The upward movement was sharp and even created a gap while breaking through the previous support level, which then acted as resistance. For some time, the price hovered around this resistance area but failed to gain enough strength to break higher. Eventually, Gold pulled back to the trend line and began consolidating within a triangle pattern. Inside this structure, it managed to break above the resistance zone again, but this breakout turned out to be false. The price quickly reversed and dropped, breaking through the resistance level and exiting the triangle to the downside. This breakdown also shows that the bullish momentum has weakened significantly. Now, Gold is trading near the trend line again, showing hesitation and a lack of strong bullish continuation. Given this technical behavior, I expect a small rise toward the trend line, followed by a continued drop toward the support level at 3320. That’s the area I’m watching as my current goal. If you like my analytics you may support me with your like/comment ❤️
Disclaimer: As part of ThinkMarkets’ Influencer Program, I am sponsored to share and publish their charts in my analysis.

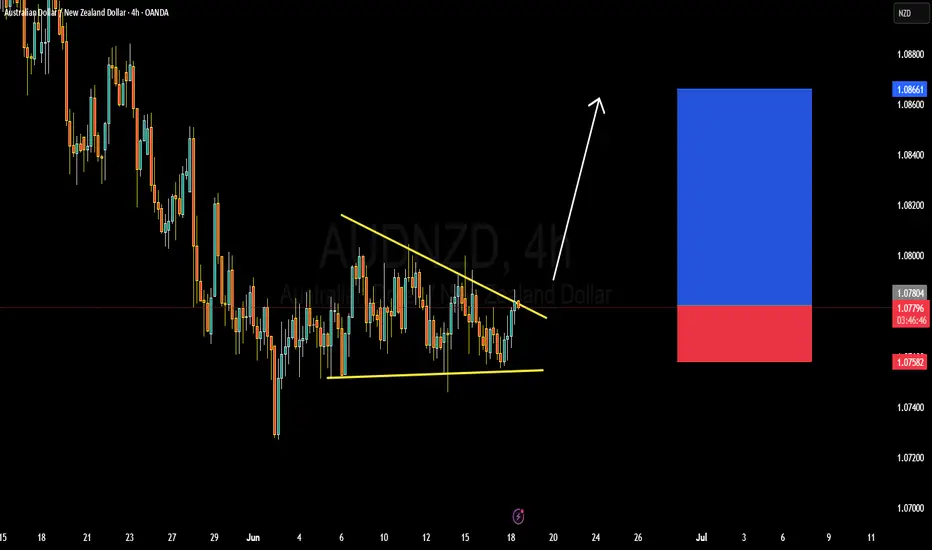
AUDNZD BULISH OR BEARISH DETAILED ANALYSISAUDNZD is currently trading around 1.078 and is on the verge of a classic falling wedge breakout, which is a bullish reversal pattern typically seen after a downtrend. Price action has been compressing within this wedge formation, suggesting an imminent breakout as market pressure builds. A decisive close above the descending trendline would be a powerful signal of bullish continuation, with a near-term upside target of 1.086. The structure has held multiple rejections at both resistance and support, highlighting strong accumulation behavior from institutional participants.
Fundamentally, the Australian dollar is gaining relative strength due to the Reserve Bank of Australia maintaining a hawkish tone, supported by persistent inflation and labor market resilience. In contrast, the Reserve Bank of New Zealand recently surprised the market by signaling a potential end to its hiking cycle, citing slower growth and inflation moderation. This divergence in monetary policy outlook is creating favorable conditions for AUDNZD bulls, particularly as global risk appetite improves and commodity-linked currencies gain traction.
Technically, this 4-hour chart pattern aligns perfectly with recent AUD strength across the board, particularly in pairs like AUDUSD and AUDJPY which have broken key resistance levels. The tight consolidation near the wedge’s upper boundary, coupled with bullish candlestick formations, suggests buyers are stepping in ahead of the breakout. With a clean invalidation below 1.075, the risk-reward ratio here is compelling, especially for momentum traders looking to catch an impulsive leg higher toward 1.086 and beyond.
This setup is high-conviction. AUDNZD is poised for a breakout that aligns with both technical and macro fundamentals. As a professional trader, I’m tracking this setup closely, and any confirmation candle above the trendline will trigger my entry. I expect bullish continuation in line with AUD’s broader strength and NZD’s underperformance.
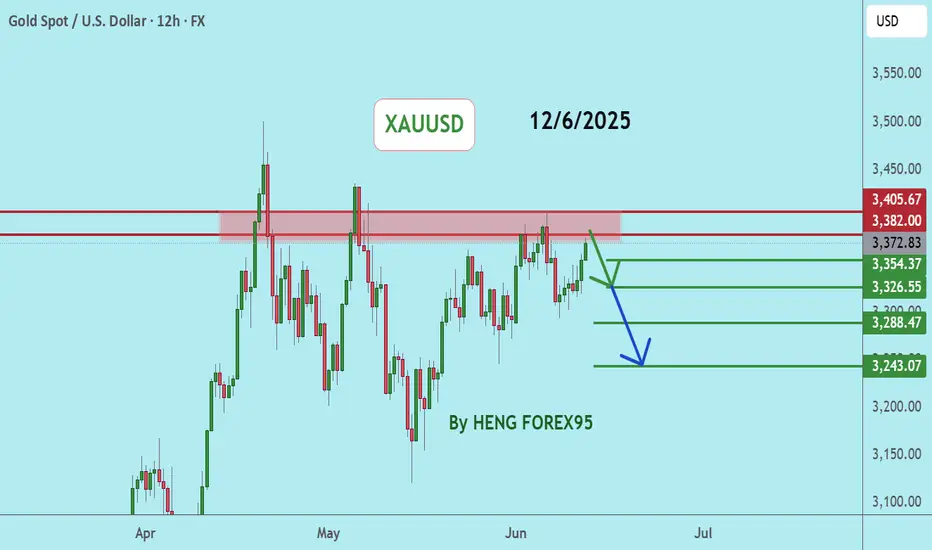
XAUUSD, GoldGold is in a correction phase. If the price cannot break through the $3429 level, it is expected that the price will drop. Consider selling in the red zone.
🔥Trading futures, forex, CFDs and stocks carries a risk of loss.
Please consider carefully whether such trading is suitable for you.
>>GooD Luck 😊
❤️ Like and subscribe to never miss a new idea!
GOLD - Price can exit from triangle and continue to fall nextHi guys, this is my overview for GOLD, feel free to check it and write your feedback in comments👊
Some days ago price traded inside a triangle, where it made a strong upward impulse from support line to resistance line.
Price broke $3185 and $3345 levels, after which it started to decline from resistance line, making gaps.
In a short time, Gold broke $3345 level again and fell to support line triangle, after which it exited from this pattern.
Next, price started to trade inside another triangle, which it broke the $3345 level two times and then dropped to the support area.
Later, Gold turned around and, in a short time, rose to the resistance area, but recently made a correction.
In my mind, Gold can exit from this triangle pattern and then continue to fall to $3220
If this post is useful to you, you can support me with like/boost and advice in comments❤️
Disclaimer: As part of ThinkMarkets’ Influencer Program, I am sponsored to share and publish their charts in my analysis.

Gold Future Move Prediction By Mythic TraderGold Future Move Prediction By Mythic Trader. Gold will 100% touch 3396 by today or by tomorrow. I will let you know the Upcoming Exact targets of it if it bReaks by TP.
This is very exclusise knowledge which no one knows about. Everyone is stucked in 1:2, 1:3,1:5,etc.
No one know or have the Guts to hold or Predict the 1:20,1:30 Trades....

BTC 1:10 RR Trade Hits the Target Perfectly.BTC 1:10 RR Trade Hits the Target Perfectly. Yesterday, I had provided this trade at the entry point and after few Hours it reached its Target. Follow me for more Upcoming analysis and Trades.

MarketBreakdown | GOLD, USDCAD, GBPNZD, GBPJPY
Here are the updates & outlook for multiple instruments in my watch list.
1️⃣ #GOLD #XAUUSD 4H time frame 🥇
I see some clear signs of bullish accumulation on intraday time frames.
The price formed an ascending triangle pattern.
Its neckline represents a significant resistance.
Its violation and a 4H candle close above will provide
a strong bullish confirmation signal.
A growth to higher structures will be expected then.
2️⃣ #USDCAD daily time frame 🇺🇸🇨🇦
Do not forget that today is the official banking holiday in Canada.
For that reason, CAD pairs might be slow.
USDCAD is currently consolidating within a narrow range on a daily.
I believe that for now, a consolidation is likely to continue.
3️⃣ #GBPNZD daily time frame 🇬🇧🇳🇿
The price successfully violated a falling trend line - a
strong vertical resistance last week.
We see a strong bullish reaction to that after its retest.
I believe that the pair will continue growing, it will likely
test a current high first and violate that, setting a new one then.
4️⃣ #GBPJPY daily time frame 🇬🇧🇯🇵
The pair is trading in a strong bullish trend on a daily.
The price is texting a significant support cluster at the moment,
probabilities will be high that a growth will resume from that.
Do you agree with my market breakdown?
❤️Please, support my work with like, thank you!❤️
I am part of Trade Nation's Influencer program and receive a monthly fee for using their TradingView charts in my analysis.

HelenP. I Gold can break resistance level and continue move upHi folks today I'm prepared for you Gold analytics. At the moment, price is forming a tightening triangle structure, and the market appears to be respecting both the horizontal support levels and the rising trend line that frames the lower boundary of this pattern. After bouncing strongly from the support zone around 2970 - 2940 points, the price rebounded right off the trend line, confirming it once again as a key structural level. Recently, XAU approached the resistance zone between 3205 and 3230, which has acted as a cap for the price several times before. But this time, the move into resistance comes from a place of strength. Momentum is building steadily after each pullback, and buyers have consistently stepped in near the ascending support. Given the context sustained higher lows, compression within a triangle, and a base forming just under resistance, there’s a strong chance the price could push through the 3205 level on a renewed attempt. A clean breakout above this resistance, followed by a retest, would offer strong confirmation that bulls are ready to extend the move. That’s why I’ve set my current goal at 3320 points, which almost aligns with the upper range of the triangle projection. If you like my analytics you may support me with your like/comment ❤️
Disclaimer: As part of ThinkMarkets’ Influencer Program, I am sponsored to share and publish their charts in my analysis.

XAUUAD UPDATE 15-5-2025This chart is a technical analysis of CFDs on Gold (US$/OZ) with a 1-hour timeframe. Here's a breakdown of the key elements:
Chart Patterns:
1. Falling Wedge Pattern:
A clear falling wedge is outlined with blue trendlines converging downward, typically a bullish reversal pattern.
The price has tested the lower boundary multiple times, suggesting a strong support zone.
2. Projected Breakout:
An upward arrow indicates a possible breakout from the wedge.
The breakout zone appears to aim for the 3,473.994 level, marked with a red line.
A potential rally target is highlighted in a yellow zone, between approximately 3,400 and 3,500.
3. Support & Resistance:
Support: Around 3,122.690 (green line at the bottom).
Resistance: Approximately 3,261.270, with further resistance near 3,473.994.
4. Volume:
There’s steady volume activity, which could indicate accumulation before a breakout.
5. Fib Level:
A Fibonacci retracement level around 0.793, often used to confirm reversal zones.
6. US Economic Events:
Two U.S. flag icons suggest important economic data releases, which might trigger volatility and influence the breakout.
Conclusion:
This chart suggests a bullish outlook for gold, expecting a breakout from the falling wedge and targeting the 3,400–3,500 zone. However, the movement could be influenced by upcoming economic data, so it’s essential to watch for confirmation before acting.
Would you like an interpretation in a different format (e.g., simplified summary or trading plan)?

USD/JPY : More Bullish Move Ahead ? (READ THE CAPTION)By analyzing the USD/JPY chart on the daily timeframe, we can see that the price moved exactly as expected — first correcting down to the 142.5 area, and then rallying strongly to hit the 146.2 target. Currently, this pair is trading around 145.2, and if the price can hold above 145, we can still expect further upside movement on USDJPY. The next potential targets are 148.7 and 150 respectively. This analysis will be updated. The total return of this analysis so far has been over 720 pips!
Please support me with your likes and comments to motivate me to share more analysis with you and share your opinion about the possible trend of this chart with me !
Best Regards , Arman Shaban

HelenP. I Gold can decline to trend line and then start to growHi folks today I'm prepared for you Gold analytics. If we look at the chart, we can see how the price after several failed attempts holds in a support zone. The structure of this correction has formed beneath the previously broken trend line, and the price is now approaching it from above. What’s important is that buyers previously stepped in around this level, forming a bounce that allowed the market to reach toward the resistance zone near 3350. This area still remains unbroken, making it a magnet for future bullish targets. Currently, price action shows signs of local weakness, but the broader context favors a potential rebound. The confluence between the horizontal support zone and the descending trend line adds extra technical weight to this level. If price can stabilize here, I expect a retest of 3205, and a potential breakout above it could open the way toward my goal at 3260. This scenario assumes continued respect of the trend line as dynamic support. A clean bounce from it would signal renewed bullish interest, especially if backed by momentum on lower timeframes. If you like my analytics you may support me with your like/comment ❤️

GOLD - Price can break support level and continue to declineHi guys, this is my overview for XAUUSD, feel free to check it and write your feedback in comments👊
Recently price entered to triangle, where it at once bounced from support line, which coincided with support level.
Price rose to resistance line, breaking $3400 level, but soon turned around and dropped below, breaking this level again.
Next, Gold made a gap and continued to fall in a triangle, and later it reached $3215 level, after which bounced up.
Then price exited from triangle, rose to $3400 level and made fake breakout, after which started to decline in falling channel.
In channel, price fell to $3215 level, where at the moment continued to trades close and trying to break this level.
I think Gold can break this level and continue to fall in a falling channel to $3140
If this post is useful to you, you can support me with like/boost and advice in comments❤️

GOLD: Long Trade with Entry/SL/TP
GOLD
- Classic bullish formation
- Our team expects growth
SUGGESTED TRADE:
Swing Trade
Buy GOLD
Entry Level - 3338.10
Sl - 3330.1
Tp - 3353.0
Our Risk - 1%
Start protection of your profits from lower levels
Disclosure: I am part of Trade Nation's Influencer program and receive a monthly fee for using their TradingView charts in my analysis.
❤️ Please, support our work with like & comment! ❤️

GOLD OUTLOOK: US–UK Trade Deal in Focus as Tariff Tensions Ease GOLD OUTLOOK: US–UK Trade Deal in Focus as Tariff Tensions Ease — Is War Risk Losing Grip?
The spotlight has shifted.
As geopolitical tensions between India and Pakistan continue to simmer, gold has surprisingly failed to respond with the expected safe-haven spike. Instead, the market’s attention has turned sharply toward global trade negotiations — particularly the latest developments between the United States and the United Kingdom.
🌐 Global Trade Truce: Why It Matters
Recent headlines confirm the UK is one of the first nations to sign a new trade and tariff agreement with the US — easing pressure from global tariff wars and restoring market confidence.
➡️ Result?
The US Dollar (DXY) has staged a meaningful recovery, limiting gold’s upside and reducing short-term bullish sentiment.
While the war narrative is still present, it's the economic diplomacy that’s dominating headlines and price action this week.
📉 Market Reaction: Mixed Signals & Wild Volatility
Recent gold movements have been erratic — sweeping liquidity zones of nearly $100 per ounce in single sessions. This type of behavior reflects deep uncertainty and makes short-term directional trading highly risky.
For now, the priority should be on key H2–H4 zones, with reduced exposure to scalp trades until structure stabilizes.
🔍 Key Levels to Watch (H4 Anchored)
🔻 SELL SCALP
Entry: 3,364 – 3,366
SL: 3,370
TPs: 3,360 → 3,356 → 3,352 → 3,348 → 3,344 → 3,340 → 3,330
🔻 SELL ZONE (Breakout Rejection Area)
Entry: 3,380 – 3,382
SL: 3,386
TPs: 3,376 → 3,372 → 3,368 → 3,364 → 3,360 → 3,350
🟢 BUY ZONE (Mid-Term Support)
Entry: 3,322 – 3,320
SL: 3,316
TPs: 3,326 → 3,330 → 3,334 → 3,340
📌 Strategy Notes:
The European session open has triggered bearish candles — be cautious on BUY setups during London hours.
If you’re holding long positions from earlier this week, consider scaling out around the 3,355 zone.
Keep an eye on upcoming comments from Donald Trump, especially around the new trade framework. These could trigger short-term volatility spikes or broader trend shifts.
🧠 Final Thoughts:
Gold is no longer driven solely by geopolitical unrest — macro narratives are back in control.
With tariff tensions easing and stronger-than-expected USD recovery, traders need to remain flexible, disciplined, and reactive — not predictive.
✅ Focus on clear levels.
✅ Trade with confirmation.
✅ Avoid emotional scalps during uncertainty.
📣 Follow this page for real-time zone updates and structured market reads. Let’s finish this week strong.

BTC - Golden Pocket & Strong FVG Resistance for a Short SetupThe current 15-minute chart of BTCUSDT reveals a textbook bearish setup forming as price retraces into a well-defined supply zone. This analysis focuses on structural breakdowns, liquidity engineering, and key Fibonacci confluences that may lead to a short-term reversal within intraday price action.
Overview of Market Structure:
BTCUSDT has been in a clear intraday downtrend with consistent lower highs and lower lows being formed. The recent price action reflects a temporary consolidation phase following the creation of a new swing low. This minor pullback appears to be corrective in nature, moving upward toward a previously established zone of inefficiency.
At the center of this setup is a well-marked bearish fair value gap (FVG), highlighted with a blue shaded rectangle, where institutional selling is expected to have previously occurred. This FVG formed after a strong displacement candle, suggesting unmitigated sell-side imbalance left in the market.
Retracement Zone and Fibonacci Confluence:
As price retraces upward, it enters the equilibrium region of the recent bearish impulse, with notable confluences around the 0.618 and 0.65 Fibonacci retracement levels. These retracement levels are critical markers where smart money algorithms often execute continuation plays during trending phases.
Both the 0.618 and 0.65 levels fall within the center of the FVG zone, further strengthening the case for this being a valid supply area. These levels are plotted with horizontal lines on the chart and serve as ideal zones to monitor for signs of rejection or bearish order flow resumption.
The 0.786 retracement, marked just above the upper boundary of the FVG, acts as a final extremity level. This level often coincides with liquidity pools where stop hunts are engineered before the actual move begins. Its proximity to a recent swing high makes it an area of interest for potential liquidity grabs prior to a deeper move down.
Projected Price Path and Liquidity Targets:
The projected blue path illustrates an expected liquidity sweep into the FVG zone, followed by a sharp rejection. This aligns with the idea of engineered liquidity collection before continuation in the original trend direction. The move anticipates price reaching back into the area of prior support, targeting unmitigated demand near recent lows.
Of particular interest is the area around the 0.28 Fibonacci extension level, which acts as a probable magnet for price in the event of a successful rejection. The chart structure suggests that once the short-term retracement completes, there is room for a new impulse leg lower.
Internal Structure Observation:
The current lower timeframe structure shows rising momentum toward the FVG. However, this upward push lacks aggressive bullish volume and appears corrective rather than impulsive. This suggests that buyers are likely exhausting themselves as price nears the supply zone.
Additionally, the structure within this move is developing lower-timeframe liquidity pools (equal highs and tight consolidation), which could act as inducement for a sweep before the potential reversal occurs.
Conclusion:
This chart offers a well-structured short setup based on supply zone rejection, Fibonacci confluence, and a bearish market structure. The fair value gap zone between the 0.618 and 0.65 retracement levels is key, and price action within this area will be crucial in determining the next directional leg. If bearish confirmation such as an engulfing pattern or break of market structure occurs within or after tapping this zone, it would validate the bearish outlook for a short-term continuation to the downside.
This setup is ideal for intraday traders focused on precision-based entries rooted in institutional order flow principles.

Dollar Doomsayers Are Dead Wrong: Why USD Will Crush It in 2025.Road To a Million fam! It’s your boy, back from the wilderness after a hiatus that felt longer than a bear market in a crypto crash. I’m pumped to be here, ready to drop some truth bombs, dissect the markets, and—most importantly—help us all make some serious bank. Buckle up, because there’s a ton to unpack, and we’re diving headfirst into the biggest elephant in the room: the U.S. dollar (USD). Spoiler alert: it’s not dead, it’s not even close to dead, and anyone saying otherwise is probably shorting it while crying into their latte. Let’s get into it!
The Dollar Drama: What’s the Deal?
If you’ve been anywhere near a financial newsfeed in 2025, you’ve heard the doomsday choir singing, “The dollar is done! Kaput! Finito!” The Dollar Index (DXY) is down 8% this year, and the Twitter (sorry, X) finance bros are out here proclaiming the end of the greenback’s reign as the world’s reserve currency. They’re screaming about de-dollarization, BRICS taking over, and gold mooning like it’s 1971. Meanwhile, I’m over here sipping my coffee, looking at the charts, and laughing. Why? Because the dollar’s obituary is the most exaggerated piece of fan fiction since Twilight.
Let’s cut through the noise and get to the meat. The USD has taken a beating, sure, but an 8% drop in a year doesn’t mean it’s packing its bags and moving to the Bahamas. The dollar is still the king of global trade, the backbone of international commerce, and the currency you need if you’re, say, India buying oil from Saudi Arabia. No one’s trading rupees for barrels, folks. They’re selling rupees, buying dollars, and getting that black gold. That’s the reality, and it’s not changing anytime soon.
So, why the panic? Why is everyone acting like the dollar’s about to be replaced by Dogecoin or a shiny new BRICS coin? Let’s break it down, roast the naysayers, and then talk about how we’re gonna make money off this drama. Because, let’s be real, that’s why you’re here.
Why the Dollar’s Down (But Not Out)
First, let’s address why the DXY is down 8% in 2025. The Dollar Index, for those new to the game, measures the USD against a basket of major currencies—56% euros, plus some GBP, JPY, CHF, CAD, AUD, and a sprinkle of others. It’s like a currency Thunderdome: one dollar enters, a bunch of others try to take it down. When the DXY drops, it means the USD is weakening relative to these currencies. But why?
Interest Rate Shenanigans: Central banks are the puppet masters of forex markets, and their interest rate moves are like plot twists in a soap opera. The U.S. Federal Reserve cut rates by 25 basis points to 4.25–4.5% on December 18, 2024, signaling a slightly dovish stance. Meanwhile, the Eurozone slashed its rate to 2.25% on April 17, 2025. That’s a 2% differential in favor of the U.S., which is huge in forex land. But the market’s been spooked by the Fed’s cut, thinking it’s the start of a softening cycle, while other central banks (like the ECB) are also cutting, creating a weird global rate limbo.
Inflation Tug-of-War: Inflation in the U.S. is at 2.4%, while the Eurozone’s at 2.2%. That means U.S. investors are getting a real return of about 2% (4.25% interest minus 2.4% inflation), while Eurozone investors are basically breaking even (2.25% minus 2.2% inflation). Money flows where it’s treated best, and right now, the U.S. is the VIP lounge. But short-term traders are freaking out over inflation fears and potential rate cuts, which has pressured the USD.
Trump’s Tariff Tantrums: Oh, Donald. The man’s back in the White House, tweeting (X-ing?) up a storm about “Making America Great Again” with tariffs left, right, and center. His trade war threats—10–20% tariffs on imports, 60% on Chinese goods—have markets jittery. A stronger dollar could make U.S. exports pricier, so some traders are betting on a weaker USD to balance things out. Spoiler: I think they’re wrong, and I’ll explain why later.
De-Dollarization Hype: The BRICS bloc (Brazil, Russia, India, China, South Africa, and friends) has been pushing for a non-USD trade system, with talks of a new currency or gold-backed system. This has fueled the “dollar is doomed” narrative. But let’s be real: a BRICS coin? Good luck getting China and India to agree on anything, let alone a unified currency. And gold? It’s ripping higher (more on that later), but it’s not replacing the USD for global trade anytime soon.
So, yeah, the dollar’s been punched in the face a few times this year. But it’s like Rocky Balboa—it’s taken worse beatings and still comes out swinging. The question is: Is this the end of the dollar’s dominance, or is it just warming up for a comeback? Let’s look at the big picture.
The Dollar Ain’t Going Anywhere (Here’s Why)
Listen up, because this is where I get on my soapbox and preach. The dollar is not dead. It’s not even on life support. If anything, it’s doing push-ups in the gym, getting ready to flex on the haters. Here’s why I’m so bullish on the USD, and why you should be too.
1. The Reserve Currency Superpower
The USD is the world’s reserve currency, and that’s not just a fancy title—it’s a superpower. Over 88% of global transactions (SWIFT data, 2024) are settled in USD. When Russia wants to sell gas to China, they often price it in dollars. When Brazil buys soybeans from Argentina, guess what? Dollars. Even countries with beef against the U.S. (looking at you, Iran) hold USD reserves because it’s the only currency universally accepted for trade.
Why does this matter? Because every country needs USD to play in the global sandbox. India’s not paying Canada for oil in rupees. They’re converting to USD or dipping into their dollar reserves. This creates constant demand for the greenback, and that demand isn’t vanishing overnight. Could it fade in a decade? Maybe. But in 2025? No chance.
And let’s talk alternatives. Bitcoin? Ha! It’s a speculative asset, not a stable currency for trade. Gold? It’s mooning (up 25% in 2025, per Bloomberg), but you’re not paying for a tanker of crude with gold bars. A BRICS currency? Good luck getting 10+ countries with conflicting agendas to agree on a logo, let alone a monetary policy. The USD’s reserve status is a fortress, and it’s not crumbling anytime soon.
2. Interest Rate Domination
Let’s talk money—specifically, where it flows. The U.S. has a Fed funds rate of 4.25–4.5%, while the Eurozone’s at 2.25%. That’s a 2% gap, which is like the Grand Canyon in forex terms. If you’re an investor, where are you parking your cash? In the U.S., where you’re earning a 2% real return (4.25% minus 2.4% inflation), or in the Eurozone, where you’re getting a big fat zero (2.25% minus 2.2% inflation)?
This is why the Eurozone’s in trouble. The ECB’s stuck in a trap—low rates to prop up struggling economies like Spain and Italy, but that makes the euro less attractive. Meanwhile, the U.S. is the cool kid at the party, attracting capital like moths to a flame. And don’t forget: the Eurozone’s a mess of 20 countries with one monetary policy but wildly different fiscal policies. Spain’s productivity isn’t Germany’s, no matter what the ECB pretends. The euro’s gonna weaken against the USD, mark my words.
3. Trump’s Dollar Rocket Fuel
Love him or hate him, Trump’s policies are about to light a fire under the USD. His “America First” agenda includes bringing manufacturing back to the U.S., which means building factories from scratch. Those factories need raw materials—steel, copper, you name it. And guess what currency they’ll use to buy that stuff? Ding, ding, ding—USD!
Plus, Trump’s tariffs (10–20% on imports, 60% on China, per Reuters) will reduce U.S. imports, meaning fewer dollars flowing out of the country. But foreign countries still need USD to repay their dollar-denominated debts (global USD debt is $13 trillion, per the BIS). Less USD supply, same demand? That’s a recipe for a stronger dollar. Trump’s shaking markets like a toddler with a snow globe, but in this case, it’s bullish for the USD.
4. Contrarian Goldmine
Here’s a little trading wisdom: when everyone’s screaming the same thing, they’re usually wrong. Right now, 99% of the finance world (or at least the loud ones on X) is saying the dollar’s toast. That kind of extreme sentiment is a red flag. Markets love to screw over the crowd, and when everyone’s shorting the USD, it means the bottom is either in or damn close.
I’m calling it: the DXY’s either bottomed already or will soon, probably around 97. When sentiment’s this bearish, it’s like the market’s handing you a gift-wrapped opportunity. And I’m not about to let it pass.
The Charts Don’t Lie: DXY Technical Breakdown
Alright, enough macro talk—let’s get to the fun stuff: charts. I’ve been staring at these squiggly lines for 20+ years, and they’re telling me the USD’s about to go on a tear. Let’s break it down, from the big picture to the nitty-gritty.
Long-Term View: The 20-Year Monthly Chart
Zoom out, fam. When in doubt, zoom out. I’m looking at the DXY on a monthly chart, going back to 2005. Each candle is one month, and the trend is crystal clear: up. The DXY’s been cruising in an ascending channel for two decades, like a train chugging along at 200 miles an hour. Sure, it’s hit some bumps—2008, 2011, 2020—but the direction’s undeniable.
Right now, the DXY’s sitting around 100, down from its 2024 highs. But it’s still within that bullish channel. I’m drawing trendlines here: a lower trendline connecting the lows (around 97–98) and an upper trendline around 120–125. The price is hugging the lower end, which screams “buying opportunity” to me.
My big-picture call? The DXY’s heading to 115–117 by late 2026 or early 2027, maybe even sooner (Jan 2026, anyone?). Why? Because a 20-year trend doesn’t reverse overnight. The dollar’s not dying—it’s just taking a breather before the next leg up. If you disagree, hit the comments. Let’s duke it out.
Short-Term View: The 4-Hour Chart
Now, let’s zoom in to the 4-hour chart for the past couple of months. The short-term trend’s been down, no question—DXY’s been sliding like a kid on a waterslide. But here’s where it gets juicy: I’m seeing a textbook inverse head-and-shoulders pattern. For the newbies, that’s a bullish reversal pattern, and it’s already played out like a charm.
Pattern Breakdown: The left shoulder formed in early April, the head hit a low around April 10, and the right shoulder wrapped up by April 21. The neckline (resistance) was around 99.8–100, and guess what? The DXY broke it like a champ.
Trendline Break: On top of that, the DXY smashed through a short-term downtrend line, confirming the bullish vibes.
RSI Divergence: Check the Relative Strength Index (RSI). From April 10 to April 21, the price made lower lows, but the RSI was making higher lows. That’s a classic bullish divergence, screaming, “The momentum’s shifting!” We jumped in when the trendline broke, and boom—profits are rolling in.
Price Targets and Trading Plan
Here’s the game plan, fam. The DXY’s already broken the neckline, so we’re in. Now, we’re watching these levels:
Immediate Target: 100.28
The DXY needs to close above 100.28 by the weekend (May 2–3, 2025). If it does, it’s go time. I’m telling you, go all in (responsibly, of course). This level’s key because it’s a minor resistance from prior price action. A close above it confirms the breakout.
Next Target: 103–103.5
This is the big one. The 103 zone is a major inflection point—tons of price action and clutter from earlier this year. If the DXY breaks 100.28, it’s got a clear path to 103. Expect some resistance around 100.27 (a support-turned-resistance level), but once it clears that, it’s smooth sailing to 103.
Probability: I’m giving this an 80% chance of heading higher, 20% chance of a pullback. Those are odds I’ll take any day.
Long-Term Goal: If the DXY follows its 20-year channel, we’re looking at 115–117 by 2026–2027. That’s not a pipe dream—that’s history repeating itself.
Trading Tip: We’re already positioned from the trendline break. If 100.28 breaks, scale up. If it pulls back to 97 (the lower trendline), that’s a dream buy zone. But don’t get caught in the daily noise—Trump’s tweets, CPI reports, whatever. Focus on the big picture.
Gold, Tariffs, and Trump: The Side Characters
I know you’re itching to talk gold, tariffs, and Trump’s wild ride. I’m saving the deep dive for another post (stay tuned!), but here’s the quick and dirty.
Gold: Gold’s up 25% in 2025 (Bloomberg), and everyone’s like, “See? Dollar’s dead!” Nah, fam. Gold’s ripping because of tariff fears, geopolitical chaos, and central banks hoarding it like Smaug. It’s not a dollar killer—it’s just doing its own thing. We’ll break it down soon.
Tariffs: Trump’s tariff plans (10–20% on imports, 60% on China) are shaking markets. They’ll make imports pricier, reduce USD outflows, and boost domestic demand for dollars. Bullish for USD, bearish for emerging markets. More on this later.
Trump: The man’s a market wrecking ball. He’s out here calling for lower rates one day, tariffs the next, and probably tweeting about aliens by Friday. But his manufacturing push and tariff policies are USD rocket fuel. Ignore the noise—focus on the policy.
Why You Should Care (And How to Profit)
Look, I get it. You’re not here for a PhD in economics—you’re here to make money. So, why should you care about the USD? Because it’s the backbone of the forex market, and where the DXY goes, opportunities follow. A stronger dollar means:
Forex Trades: Go long USD/EUR, USD/JPY, or even USD/CAD. The euro’s toast with that 2.25% rate, and the yen’s stuck in Japan’s low-rate purgatory (0.25%, per BOJ).
Stock Market Impact: A stronger USD could pressure U.S. multinationals (exports get pricier) but boost domestic firms. Think Walmart, not Apple.
Commodities: Oil and metals (priced in USD) could dip as the dollar rises. Short crude if you’re feeling spicy.
Emerging Markets: Countries with USD debt (like Turkey or Argentina) are gonna feel the heat. Avoid their currencies like the plague.
Here’s how we’re playing it at Edge-Forex:
Long DXY: We’re in at the trendline break, scaling up if 100.28 breaks. Target 103, then 115 long-term.
Risk Management: Keep stops tight below 99.5 (short-term) or 97 (long-term). Don’t bet the farm—markets love surprises.
Stay Nimble: Watch for Fed signals, ECB moves, or Trump’s next X rant. We’ll adjust as needed.
The Big Picture: Don’t Get Lost in the Noise
I know it’s tempting to get sucked into the daily drama—Trump’s latest outburst, a hot CPI print, or some X influencer shilling a “dollar crash” thesis. But trading’s about cutting through the noise. Zoom out. Look at the 20-year DXY chart. Look at the interest rate gap. Look at the USD’s reserve status. The dollar’s not going anywhere, and it’s about to remind everyone why it’s the boss.
My advice? Get out of the short-term clutter. Stop refreshing X every five minutes. Focus on the trends that matter: central bank rates, capital flows, and technical setups. The DXY’s setting up for a monster move, and we’re gonna ride it like surfers on a tsunami.
Wrapping It Up: Let’s Make Some Freaking Money
Alright, Edge-Forex fam, that’s the deal. The dollar’s not dead—it’s just been napping, and it’s about to wake up with a vengeance. The DXY’s forming a bottom, the charts are screaming “buy,” and the macro setup (rates, Trump, reserve status) is a bullish trifecta. We’re already positioned, and if 100.28 breaks, we’re going big.
I’m back, baby, and I’m here to drop regular updates, roast the haters, and help us all stack some serious profits. Got questions? Drop ‘em in the comments. Disagree with my DXY call? Bring it on—let’s debate. Just don’t be that guy shorting the dollar while the rest of us are cashing checks.
Stay tuned for the next post (gold’s getting its moment soon), and let’s make some freaking money together. Out!

HelenP. I Gold can correct to trend line and continue to growHi folks today I'm prepared for you Gold analytics. After the recent drop and partial gap-fill, the price seems to be forming a solid foundation for a potential continuation to the upside. The price previously rebounded from the lower levels near 2955 and established a strong bullish trend, respecting the ascending trend line multiple times. Each touch acted as a signal for buyers to step in, pushing the price toward higher zones. Eventually, the market broke through a major resistance area, which has now turned into a support zone between 3265 and 3295 points. This area is also reinforced by the trend line, which has been tested again recently. Importantly, the price left a gap during the impulsive move up, and after the correction, the gap was filled, and buyers immediately reacted. Now, Gold is trading slightly above the support zone, showing a clear bounce from both the trend line and horizontal structure. This confluence increases the probability of further bullish momentum. Given the price behavior, market structure, and technical context, I expect that XAUUSD will continue rising toward the 3425 points, that’s why it is my current goal. If you like my analytics you may support me with your like/comment ❤️

HelenP. I Gold will continue to decline, breaking support levelHi folks today I'm prepared for you Gold analytics. After an extended bullish phase that pushed the price higher within an upward channel, the market has started to show signs of weakness. Initially, gold moved steadily from the lower support zone, climbing through the channel and forming higher highs. Each pullback was supported by the rising trend line, reinforcing the bullish sentiment throughout the move. However, after reaching the peak near 3570, the price sharply reversed, breaking the trend line and shifting the overall structure. Sellers took control, leading to a breakdown below the channel, and now the price is consolidating near the 3260 - 3285 support zone. Recently, Gold tested the trend line from below but failed to reclaim it, which signals strong resistance overhead. Currently, gold is trading around 3319, just above the lower boundary of the broken channel and inside the support zone. I expect a small upward correction, breaking the trend line, and then followed by a continuation of the downward movement. So that's why I set goal is 3200 points. If you like my analytics you may support me with your like/comment ❤️

HelenP. I Gold may continue fall to support zoneHi folks today I'm prepared for you Gold analytics. After a strong bullish impulse, the price of Gold reached a local peak and started to reverse. Before that, the uptrend was developing within a clearly defined ascending channel, where the trend line acted as dynamic support multiple times. Each time the price touched this line, it rebounded and continued climbing higher. However, the most recent upward movement ended with a sharp pullback, which marked the beginning of a potential correction. At the moment, the price is trading below the recent high and has already started forming a corrective downward move. XAUUSD is now heading toward the important support zone between 3190 and 3160 points. This area is not only a key horizontal level but also intersects with the trend line, making it a strong confluence zone that may act as a magnet for the price during this phase. I expect that the Gold will make a minor upward move before continuing to decline, targeting the support zone at 3190 points, which is my current goal. Given the recent price rejection from the resistance and the bearish momentum building, a move toward 3190 looks like the most probable path. If you like my analytics you may support me with your like/comment ❤️
