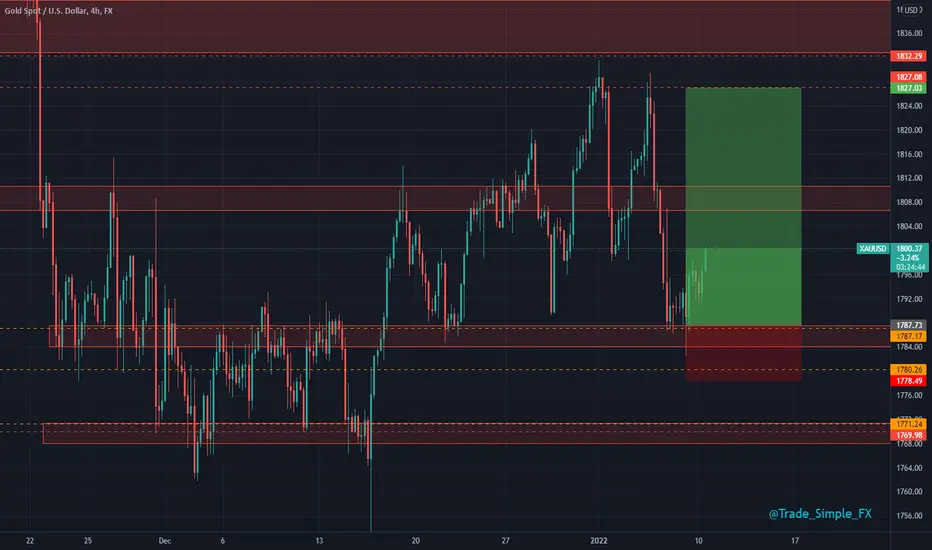
XAUUSD intra-day setupGold is moving to the liquidity areas that were set last week Friday. A possible buy opportunity is the books as we see how price action acts in that area during the London and New York session.
Forex-gold

Do you know where the money sits?All too often new retail traders are suckered into brokers with large sign up bonuses. These are often referred to as "B" book brokers whereby 9 times out of 10 your money never even hits the real market. They know 90% of people lose 90% of their accounts in 90 days. It doesn't stop there, you either have an influencer who doesn't even trade a live account, giving you analysis - or you are educated on some system or strategy that revolves around retail mentality.
Understanding money-flow can put you on the front foot.
So first of all; Buy and sell side liquidity are areas of price in which buy stops and or sell stops are mostly residing. If you can understand the higher time frame perspectives and see where the "money" is.
This can also be knows as Supply & Demand levels. (visual below)
Back in January 2021; I was showing why these liquidity levels where likely to be used for the re-accumulation phase.
This was highlighting the bias to collect liquidity and move on up to unchartered territory. With a little knowledge of the bias (using Elliott Wave) you could see it was likely accumulation and it's targets up into new levels price had not been before.
You had a pullback level into the "auction" area - thus to pick up it's last round of liquidity before the explosive move up. This was the level in February 2021.
And what does it do?
Combining the two, would give a bias, a pullback level. That plus the extension levels would give a clear target for a move up. This can be seen here on the left for the 3 weekly in Elliott terms and the first distribution (Wyckoff schematic) but over simplified, this is where the money is sat (orders above) and stops below. This giving a pullback target.
As you can see it only followed the money flow;
Once you get a handle on the money levels - you can start to build a plan around it. Price will seek the liquidity in order to either reverse or continue in within it's expansion move.
Step forward into the 4 of the weekly Elliott wave count, which would equate to a type of re-accumulation on the larger scale.
In August we saw the move up and it's pullback into the smaller liquidity level.
This is here -
So as you can see, it's only following money flow.
This follows a very simple pattern which consists of 3 phases;
1) Contraction
2) Expansion
3) Profit taking.
If you see price as reversing at the buy or sell side of liquidity, then you trade the developed price action, if you see price continue to move through the buy or sell side liquidity, then you stick to the order flow of price and trade the buy or sell side that it is, towards the next price objectives.
So at this point here; we had tagged a Fibonacci extension level. We have orders and stops above, we move up again to make a slightly newer high - in essence trapping traders into the wrong side of the trade.
Once you see both sides of liquidity - the next challenge is to simply develop a bias. For me EW is useful, not to trade every swing, but to know where on the roadmap we are. You can then define more objective price targets for pullbacks, entries or exits.
I hope you can start to see how this fits together?
In September I posted this move from the accumulation as to how we could see the liquidity levels above, add the extensions and you now know where we where heading. Using the EW logic as well - it painted the Elliott Weekly 5 (as in the August image) which had liquidity levels in neon lights.
From there liquidity wanted to gather and drop. Whilst influencers where calling for $100k, 135, 275, 300k. ZERO logic supporting their arguments. So what did we do?
So we go seeking liquidity and then the drop.
Now you can use this information for the next move - we know we where going from Distribution (weekly 5 EW) down to a new accumulation. Clearly the larger institutional players where selling into the retail who assumed it was going to moon. (wholesale selling at a premium to retail) keep this in mind.
Once you got your bias and you know where the money sits, it's pretty obvious to trade these moves up and down.
So from here you can look for the contraction levels, this will give a good feel for where the money sits.
You have a bias. And now you have the logic for the next moves.
Here's a question for you....
Enjoy the rest of the weekend!
=======================================================================
Here's the largest educational post you will find on @TradingView in a single post (click on image)
-----------------------------------------------------------------------------------------------------
Disclaimer
This idea does not constitute as financial advice. It is for educational purposes only, our principle trader has over 20 years’ experience in stocks, ETF’s, and Forex. Hence each trade setup might have different hold times, entry or exit conditions, and will vary from the post/idea shared here. You can use the information from this post to make your own trading plan for the instrument discussed. Trading carries a risk; a high percentage of retail traders lose money. Please keep this in mind when entering any trade. Stay safe.

TS ❕ GBPUSD: down moveThe sale is also expected in terms of the Pound. Most likely, the price will soon reach the support line of the downtrend channel.
SELL scenario: The current accumulation is well suited for a short with a target near the support line.
-----------------------------------------------------------------------------
Remember, there is no place for luck in trading - only strategy!
Thanks for the likes and comments.

Updated perspective for Mar 3, 2022The chart is now set up for a possible bottom (I emphasize the word "possible").
The Factor Daily Trend Model turned Neutral on Mar 1 and will turn UP with a wide-bodied advancing candlestick that closes above 46,000.
While it is not the most ideal chart construction, I can argue that a decisive close above 46,000 will completed a double bottom pattern, turning the Factor Daily Chart Model into an UP status.

A Quick Vision On #BTCThere are 3 scenarios we’d have here about the #BTC 1H chart that I clearly marked on the table for you, this is not an actual signal or something, so don't take any positions on it, and as you remember I guess we talked about #USDT.D’s chart that how bullish that symbol is, so take double “found management” at this point and stay safe!

Here are Two Possibilities That can happenThere are two scenarios about USDT.D that you can clearly see on the chart over here, and it’s reacting point to point perfectly, we must have a couple of green candles on the charts of the crypto market I guess, and looking for a better opportunity to get into a perfect position on the top ranks of the market.
As always stay safe and manage whatever you have to manage because whatever can happen on a chart, will happen!

DOA trading Strategy - XAUUSD#XAUUSD - Catching that Gold retracement, Red DOA sniper and DOA meter are holding strong. We should see a nice sell off until 1880 area

EUR/JPY LONG OPPORTUNITYEURO strength hopefully this week let’s goooo
Watch out for the fundamentals

GBP/AUD LONG OPPORTUNITY Going long on this one for the week. I’m very quiet I don’t say much yes I know. This is like a free trial that you get from me. Loooool

XAUUSD 15M - Levels - End of week!Quick end of week update from us with what to look for in the remainder of the session.
We didn't complete the move down into support however, we've got that resistance level market where the price is holding for now. So we would expect this to range a bit now maybe into market close unless there's a late move to close this above the 1900 level on the weekly chart. For now we're not entering any long trades until next week where we would want to see these lower support regions targeted.
We'll be back on Sunday with the KOG report. Wishing all our followers and members a great weekend.
As always, trade safe.
KOG

GoldViewFX - 1H CHART UPDATEHey All,
We had a buy TP at the top and then price rejected leaving 1884 open, as a TARGET. Our signal gave us an early safe exit before 1884 due to the BENCHMARK identified yesterday (see related post below on how to use this). We were expecting drop and now its playing out perfectly.
Having an open Target on the top gives us the confidence to remain buying dips.
We will now wait to see if price finds support here at 1854 for a push up or at 1838 before a push up.
Will keep you all updated.
Please don't forget to hit like, comment and follow.
GoldViewFX
XAUUSD TOP AUTHOR

EUR/USD SHORT OPPORTUNITYLooking for shorts from 1.15000 down to 1.12000 say less see more. More content dropping from this week onwards. More of my analysis is published privately... just know ... have a great week!

Gold sell idea for next weekBasic structure analysis here on gold with the trendline strategy on H4.
Price is seen to be in some overrall downtrend here with the uptrend trendline getting broken and pushing through the trendline
For next week, I want to see price comeback to retest the trendline, show reversal signs and drop for a 1:13+ risk:reward.

money going back from crypto to usd before some liquidifications and margin calls some usd money will be required so usd index should high,
plus the tax increasing , lets see soon .. cya

Nice 1:9 Risk:Reward Buy on Gold!Looking to get in on counter trend buys, entries @ 38.2 fib + 1hr previous low. 1st tp at $1824 giving a 1:4RR, 2nd tp @ the weekly high

XAUUSD 15MIn 15 minutes, one of these two direction can be checked. We have to wait for the reaction of the dollar index to the resistance area. If it returns, gold will probably be bullish.

XAUUSD 1H - LevelsQuick update for the end of day. We managed to hold support below at the levels we suggested that gave trades an opportunity to go long into the 1814 level as the first target. Well done to those who followed.
Now we want to see where we close today. We have a potential level above around 1818-19 where if the price pushed upto in the late session could be an opportunity to short back down into the 1810 and below that 1806 price regions.
We're not going to risk anymore trades today as its the end of the day and we prefer to start fresh in the morning. This is only for reference so please use the levels on the charts.
As always, trade safe.
KOG

TRADING PSYCHOLOGY | Common Traps You Must Know 🧠💭💫
Hey traders,
Trading psychology plays a very important role in a learning curve of a trader. In this post, we will discuss common biases and traps that every struggling trader is occasionally facing.
⚓️Anchoring Bias
People rely too much on a reference point from the past when making a decision for the future - they are "anchored" to the past.
Imagine you spotted a great trading opportunity & made a nice profit. Encountering a similar setup in the future you trade it again. It turns out that you lose.
Next time - same thing. The setup that initially brought you nice cash refuses to work.
Even though the probabilities indicate that the identified pattern produces negative long-term returns, you keep taking that because you are "anchored" to the initial winner.
🙅♂️Loss Aversion
This is when people go to great lengths to avoid losses because the pain of loss is twice as the pleasure received from a win.
You see a great trading setup. You are 100% sure that it will play out. You open a trade and guess what? The market goes in the opposite direction. You can't believe that you are wrong. Instead, you decide to hold your position just a bit more adjusting your stop loss. And again, the market refuses to go in the direction that you projected. It is a vicious cycle that most of the time leads to substantial losses.
✅Confirmation Bias
The confirmation trap is when traders seek out the information that validates their opinions and ignores any theory that invalidates them.
You spotted a great long opportunity on GBPUSD. Checking the ideas of other traders on TradingView you consider only the ones that confirm your predictions completely ignoring the opposite ones.
👑Superiority Trap
Many traders have lost large sums of money in the past simply because they have fallen prey to the mentality of overconfidence.
Imagine that you caught a winning streak. You feel like the king of the world. You spend less and less time and reflection on each consequent trading decision that you make, you lose your focus. At some moment the reality kicks in and your gains evaporate.
🐮Herding
As a trader, you should execute your own analysis & avoid the temptation to blindly follow the majority.
Analyzing a EURUSD chart you make a conclusion that the market is bearish. However, then you see that 90% of the traders are very bullish on TradingView.
Instead of following your own analysis, you decide to join the herd.
These biases are common and most of the time we fall prey to them unconsciously.
The more you self-reflect, the more you analyze your thoughts and actions, it would be easier for you to avoid them.
Have your ever fallen prey to these traps?
❤️Please, support this idea with like and comment!❤️

Gold H4 - Long SetupGOLD H4
Gold bounced from this 1785 support region we have in sight, initially saw a nice trade from 1800 up towards 1827, but failed to break this 1827 resistance price, monthly key level and previous high was enough to see resist price.
1800 is now acting as support (current price), we also have somewhat s/r from the previous area of demand and support (to the left). Lets see what happens from here and whether we can break this 1800 mark.
XAU/USD ShortGold short, structure has shifted bearish. Structural resistance zone aroun 1800. Risk entry.

XAUUSD 4HrGold , XAU/USD , I hope everyone out there had a good 'New Year's Bash'. Well now let's get back to work. As shared in my previous chart we talked about buying small lots @1785, and I hope you all closed it with insane pips of profit. As we see the precious metal hiked upto 1831 this week.
As I have been got cut up partying too I couldn't manage time to share my setup update, but here it is! LETS MAKE SOME SERIOS MONEY!
You see the Simple S&R levels, playing out good. We see some opportunity of buying here at 1800-1803, taking profit at 1823. Also we sell if the price escalate below 1800 and we take profit @ 1797 and then if rejected then @1789 which is the next support level.
I hope my analysis will be helpful again for my followers and viewers. Please Share if you agree.
Be careful with your risk management. Trade safe.
Follow to learn and earn.
Let's make money all together.
CHEERS to this NEW YEAR!

Your Success Formula | What Drives a Big Change 🏔️
Hey traders,
There’s a well-known Chinese proverb that says, “A journey of a thousand miles begins with a single step.”
The one thing that prevents you from attaining your goal is hidden in your psyche, deep inside your soul. People usually look for shortcuts and want to accomplish their goals in one night. But the thing about long-term goals is that they can not be accomplished in a single day! It’s not like they require one huge, monumental effort to be achieved.
The only way you’re going to accomplish something really big and ambitious – the kind of goal that will transform your life forever – is by consistently taking one small step at a time in the direction of your dreams.
The importance of small incremental steps should be recognized by everyone, life is full of challenges, ups, and downs, but one should not lose hope or give up during the process. Failure should be considered as a learning point, an opportunity for growth.
Be ready for a journey of thousand miles this year. Be ready to meet the chaos and unknown. That is the only way to evolve and be better.
Remember that nothing is impossible to achieve unless you decide to do it at all costs.
Do you agree with this quote?
❤️Please, support this idea with like and comment!❤️

