XAUUSDXAUUSD is in a correction phase. The price is currently near the 2380-2396 resistance zone. If the price cannot break through the 2399 level, it is expected that there is a chance that the price will go down. Consider selling in the red zone.
>>GooD Luck 😊
❤️ Like and subscribe to never miss a new idea!
*Always follow your trading plan regarding entry, risk management
Forex-gold

HelenP. I Gold will continue to move up to $2430 levelHi folks today I'm prepared for you Gold analytics. Some days ago price reached the support level, which coincided with the support zone and even rose a little higher, but soon turned around and dropped to 2295 points, breaking the 2355 level again. Then price turned around and started to trades inside consolidation, where it reached the support level and made a fake breakout from it, after which dropped to the trend line, which coincided with the bottom part of the range. After this movement, Gold started to grow and quickly rose to the 2355 support level and broke it, thereby exiting from consolidation also. Next, the price made a retest and then rebounded up from this level to the 2430 resistance level. When Gold reached this level, it broke it and rose until to 2483 points, after which made impulse down, lower than the resistance level with the trend line, breaking them. After this, the price tried to grow, but it only reached the 2430 level and at once rebounded down to the support level. JNow price rising, for this case, I expect that XAUUSD will make a small movement down and then continue to grow to the resistance level. That's why my goal is 2430 level. If you like my analytics you may support me with your like/comment ❤️

Gold can grow a little and then continue to decline in channelHello traders, I want share with you my opinion about Gold. Looking at the chart, we can see how the price a not long time ago entered to upward channel, where at once it broke the support level, which coincided with the buyer zone and continued to move up. Later price reached the resistance line of the channel, rebounded, and fell to the support line, after which reached the resistance level, which coincided with the seller zone. Soon, Gold broke this level and rose until to the resistance line of the channel, after which turned around and started to decline inside the downward channel, leaving the upward channel. Next, Gold broke the 2430 level again and dropped to the support line of the downward channel, but at once rebounded and rose to the 2430 level. Then price bounced and fell to the buyer zone, which coincided with the support level, after which it started to grow. At the moment, I think Gold can grow a little more and then drop lower than the support level, breaking it. For this reason, I set my TP at 2330 points. Please share this idea with your friends and click Boost 🚀

Gold (Xau/Usd) H4 Trendline BreakoutThe XAU/USD pair on the H4 timeframe presents a potential selling opportunity due to a recent downward breakout from a well-defined Channel pattern. This suggests a shift in momentum towards the downside in the coming Days.
Key Points:
Sell Entry: Consider entering a short position around the current price of 2405, positioned close to the breakout level. This offers an entry point near the perceived shift in momentum.
Target Levels:
1st Support – 2335
2nd Support – 2297
Stop-Loss: To manage risk, place a stop-loss order above 2490. This helps limit potential losses if the price unexpectedly reverses and breaks back upwards.
Your likes and comments are incredibly motivating and will encourage me to share more analysis with you.
Best Regards, KABHI FOREX TRADING
Thank you.

HelenP. I Gold can break resistance level and continue to growHi folks today I'm prepared for you Gold analytics. A few moments ago price declined to the support level, which coincided with the support zone, and at once bounced and tried to grow, but failed and dropped lower this level, breaking it. Then in a short time, Gold rose higher than the 2320 level, breaking it again and some time traded near, after which fell back to the trend line, After this movement, the price rebounded from this line and started to grow and in a short time rose 2391 points, after which made small correction movement. Then price reached the resistance level, which coincided with the resistance zone, broke it, and rose to 2483 points, but soon turned around and dropped to the trend line, thereby breaking the resistance level one more time. But now, XAUUSD trades close to this level and I expect that the price will make a small movement down to almost the trend line and then rebound up higher than the resistance level, breaking it and continuing to move up. That's why I set my goal at 2460 points. If you like my analytics you may support me with your like/comment ❤️

XAUUSDXAUUSD price is in the main resistance zone 2432-2448. If the price cannot break through the 2448 level, there is a chance that the price will decline. Consider selling in the red zone.
>>GooD Luck 😊
❤️ Like and subscribe to never miss a new idea!
*Always follow your trading plan regarding entry, risk management

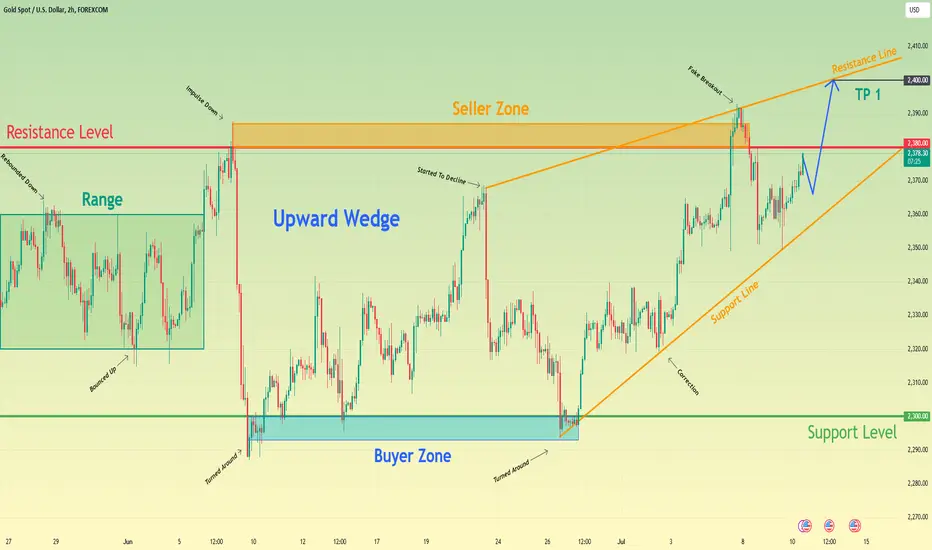
Gold can break resistance level and continue to move upHello traders, I want share with you my opinion about Gold. Observing the chart, we can see that the price some days ago entered to range, where some time traded and then rose to the top part of this pattern, but at once turned around and made a correction movement. After this movement, the price rebounded and in a short time rose to the resistance level, which coincided with the seller zone, thereby exiting from the range and even later breaking the 2380 level. But at once Gold turned around and made impulse down to the buyer zone, which coincided with the support level. Then the price turned around and started to grow to 2367 points, after which it turned around and quickly declined back to the buyer zone. Also, the price started to trades inside the wedge, where it rebounded from the support line, which is located in the buyer zone, and in a short time rose to the resistance level. Gold made a fake breakout of this level and recently fell below the 2380 level, breaking it again. Then it fell to the support line of the wedge and started to grow, so, in my opinion, the price can make little correction and then reach the resistance level and break it. After this movement, Gold will continue to grow to the resistance line of the wedge. For this reason, I set my TP at 2380 points. Please share this idea with your friends and click Boost 🚀
gold is ready to catch new ATH in my opinion when we reach at 2440 and all of the feds speech ended we are ready to pump my target is 2565
dyor its just trend trading and analysis

HelenP. I Gold can fall to $2280 points, breaking support levelHi folks today I'm prepared for you Gold analytics. If we look at the chart, we can see how the price some days ago rebounded from the support level and made a strong impulse up to the trend line, thereby breaking the resistance level, which coincided with the resistance zone. After this movement, the price turned around from the trend line and in a short time declined lower than the 2385 level, breaking it one more time. Next, the price declined a little more, and then some time traded near the 2310 support level, after which turned around and in quickly rose to the resistance level. After this movement, the price made an impulse down from the resistance level and fell to the support zone, but soon turned around and rose higher than the support level, making a fake breakout. Later price also broke the trend line, but after this, GOLD rose a little and then made impulse down, breaking this line one more time. Price fell lower support level, but a not long time ago it rebounded from the support zone and rose higher than the 2310 level and trend line as well. Just now, the price trades near the trend line and I expect that XAUUSD will decline to a support level, breaking the trend line. After this, the price can break the support level and continue to fall, therefore I set my goal at 2280 points. If you like my analytics you may support me with your like/comment ❤️

Gold can correct to support level and then start to move upHello traders, I want share with you my opinion about Gold. By observing the chart, we can see that the price declined to the support line, thereby breaking the support level, which coincided with the buyer zone, but at once rebounded and started to grow. In a short time price rose higher than the 2310 level, breaking it again, and then rose to the resistance level, which coincided with the seller zone. Soon, GOLD broke this level, made a retest, and rose to 2442 points, after which turned around and started to decline. Price quickly declined lower than the resistance level with the support line, thereby breaking it. After this movement, the price some time traded in range and then reached the resistance level again, but at once rebounded and made impulse down lower than the 2310 level, to support line of the pennant. Next, Gold in a short time rose to the resistance line of the pennant, after which rebounded back to the support line. But a not long time ago it bounced up and now trades near the support level. In my opinion, the price can decline to the support level and then start to grow to the resistance line of the pennant. After this, Gold can break this line, thereby exiting from the pennant, and then continue to grow, therefore I set my TP at 2360 points. Please share this idea with your friends and click Boost 🚀

EUR/USD : Big Fall Ahead ? (READ THE CAPTION)By analyzing the EUR/USD chart on the 4-hour timeframe, we see that the price has started to rise exactly as we expected. It fully filled the first FVG and even about 50% of the second FVG. The overall return of this analysis has been over 85 pips. Currently, the Euro is trading around 1.072 and might start a further correction from this level. The 1.07380 to 1.07620 range is an important supply zone and should be closely monitored.
Please support me with your likes and comments to motivate me to share more analysis with you and share your opinion about the possible trend of this chart with me !
Best Regards , Arman Shaban

Gold can break resistance level and continue grow to 2365 pointsHello traders, I want share with you my opinion about Gold. Looking at the chart, we can see how the price a few moments ago price rose to a resistance level, which coincided with the seller zone and soon broke it. After this movement, it made little correction and then rose to 2450 points, and then made impulse down to 2330 level, breaking 2385 level. Then Gold started to trades inside the range, where it some time traded near the current resistance level and some time later price rose to the seller zone, after which turned around and made a downward impulse. Price entered to wedge, thereby exiting from the range and also breaking the 2330 level, which coincided with the buyer zone. Gold fell to the support line of the wedge and then started to grow to the 2330 level. When the price reached this level, it broke it and reached the resistance line of the wedge, but a not long time ago XAU turned around and fell back to the support line of the wedge, breaking the current resistance level one more time. Now, the price trades in the buyer zone, so, in my opinion, it can rebound up from the support line and break the resistance level. After this, the price will continue to grow to the resistance line of the wedge, therefore I set my TP at 2365 points, which coincided with this line. Please share this idea with your friends and click Boost 🚀

HelenP. I Gold will make impulse from support level to $2360Hi folks today I'm prepared for you Gold analytics. If we look at the chart, we can see how the price some time ago broke the support level, which coincided with the support zone, and made a retest. After this, XAU continued to move up and later reached the resistance level, which coincided with the resistance zone, and soon broke this level too, after which rose to the trend line. Next, the price turned around and started to decline inside the downward channel, and made at once impulse down to the support line, breaking the 2385 level again, and even made a fake breakout of the support line of the channel. After this movement, the price quickly rose to the resistance level, which coincided with the trend line, which is the resistance line too and then rebounded down to the support zone. Then Gold in a short time rose back and even a little higher than the trend line, but a not long time ago, the price turned around and fell back to the channel, making a fake breakout of the resistance line. Now, I expect that XAUUSD will fall to the support level and then repeat movement up, higher than the trend line, thereby exiting from the channel. That's why I set my target at 2360 points. If you like my analytics you may support me with your like/comment ❤️

XAUUSDXAUUSD price is near the support zone 2280 - 2267. If the price cannot break through the 2267 level, it is expected that there is a chance that the price will rebound. Consider buying a red zone.
>>GooD Luck 😊
❤️ Like and subscribe to never miss a new idea!

Gold can fall to support level, break it and continue to declineHello traders, I want share with you my opinion about Gold. Looking at the chart, we can see how the price some days ago price started to trade inside the wedge, where it at once made an impulse up from the support line to the resistance line, after which turned around and fell to the support level. Then price some time traded near this level and then started to grow to the resistance line of the wedge pattern and when Gold reached this line, the price broke it, thereby exiting from the wedge pattern. Next, XAU quickly rose higher than the 2415 level, which coincided with the seller zone, but soon turned around and started to decline inside the downward channel. In the channel, the price declined to the support line, breaking the resistance level, after which rose to the resistance line of the channel. Then Gold almost fell to the 2285 support level, after which turned around and in a short time rose to the resistance line of the channel. At the moment, the price continues to trades near this line, so, I think that price can decline to the support level, after which Gold will break it and continue to decline. For this reason, I set my TP at 2240 points. Please share this idea with your friends and click Boost 🚀

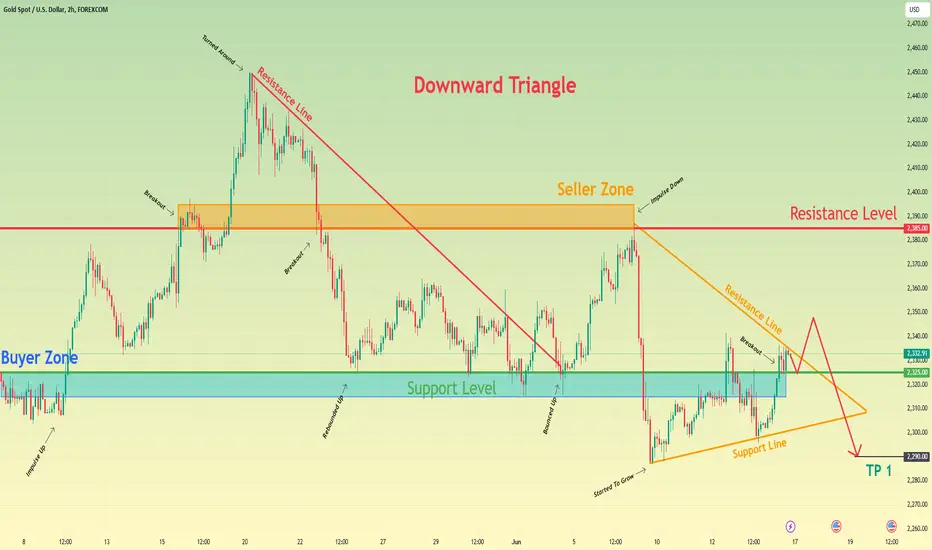
Gold can exit from triangle and then drop lower support levelHello traders, I want share with you my opinion about Gold. Looking at the chart, we can see how the price a not long time ago declined a little lower than the buyer zone, but soon turned around and made a strong impulse up, breaking the 2325 support level. Later price reached a resistance level, which coincided with the seller zone and broke it too, after which made little correction and then continued to grow to the resistance line. When the price reached the resistance line, it turned around and in a short time declined to the support level, breaking the 2385 level one more time. Next, the price some time traded near the support level and later broke the resistance line, after which rose to the resistance level and at once made a downward impulse, lower than the 2325 level, breaking it. Also, Gold started to trades inside the triangle, where it bounced from the support line and quickly reached the support level, broke it, and reached the resistance line of the triangle. To this day, the price continues to trades near the resistance line, so, that's why I think that Gold can exit from the triangle pattern and then make drop lower support level, breaking it. For this case, I set my TP at 2290 points. Please share this idea with your friends and click Boost 🚀
HelenP. I Gold can make small movement up and then rebound downHi folks today I'm prepared for you Gold analytics. Some time ago price reached a resistance level, which coincided with the resistance zone and soon broke it, after which made little correction movement and then continued to grow to the trend line. When the price reached this line, it turned around and started to decline inside the downward channel, where Gold in a short time declined to the support line, breaking the 2385 level, and then started to grow. Later price rose to the resistance level again, but at once rebounded and made an impulse down to the support level, which coincided with the support zone and even fell to this area. Soon, the price turned around and started to grow, thereby making a fake breakout of 2300, after which the price made a correction to the support level and now rising again. For my mind, XAUUSD will make one more movement up and then rebound down to the support zone. That's why I set my goal at 2290 points. If you like my analytics you may support me with your like/comment ❤️

Gold can correct to support level and then rebound up to 2345Hello traders, I want share with you my opinion about Gold. Observing the chart, we can see that the price some days ago price started to trades inside an upward pennant, where it at once made a strong impulse up from the support line to the resistance line, which coincided with the seller zone, breaking 2285 and 2415 levels. Soon, the price turned around and in a short time declined to the support level, which coincided with the support area, after which started to grow to a resistance line. When the price reached this line, it two times tried to break it, and on the second try, Gold broke the resistance line, thereby exiting from the pennant and continuing to move up to the seller zone. After the price entered to seller zone, it soon turned around and in a short time declined lower the 2415 resistance level, making a fake breakout of it. After this, the price rose to the resistance line, after which rebounded down to the support level, but a not long time ago it bounced and started to grow. In my opinion, the price can correct to the support level, after which Gold turns around and rebounds up to the resistance line. For this case, I set my target at 2345 points, which coincided with this line. Please share this idea with your friends and click Boost 🚀

HelenP. I Gold will rebound up from support level to $2350Hi folks today I'm prepared for you Gold analytics. If we look a the chart we can see how the price rebounded from the trend line and made a strong impulse up to the resistance level, thereby breaking the 2290 support level and even soon XAU broke the resistance level too and rose higher resistance zone. But then the price turned around and made a correction movement, declining lower than the resistance level, after which the price tried to repeat the past impulse, but when it reached the 2400 level, Gold in a short time declined to the support level, which coincided with the support zone. Also, the price entered to this area and even fell to the trend line, after which at once made impulse up, higher than the resistance level with the resistance zone. But later XAUUSD turned around and dropped to the trend line first, breaking the resistance level one more time, and recently it broke the trend line and declined to the support level. Just now, I expect that the price will rebound up from the support level to the trend line, after which it can break this line and continue to grow. That's why I set my goal at 2350 points. If you like my analytics you may support me with your like/comment ❤️

HelenP. I Gold can rebound down from top part of range to $2330Hi folks today I'm prepared for you Gold analytics. Some days ago price started to decline from the trend line and in a short time declined to the resistance level, after which broke this level and continued to fall. Later, Gold fell to the support level, which coincided with the support zone, and started to trades inside consolidation, where it at once started to grow. But soon, the price turned around and made a correction movement to the support zone, after which tried to grow but failed and fell back. Then XAUUSD repeated this movement and later rebounded up from the support zone to the trend line inside consolidation, and soon broke the trend line as well. After this movement, the price reached the top part of the range and started to decline, therefore I expect that GOLD will reach the trend line, then rebound up to the top part of the consolidation, after which starts to decline to the support level, breaking the trend line. That's why my goal is a 2330 support level. If you like my analytics you may support me with your like/comment ❤️

Gold can rebound down from resistance line to 2280 support levelHello traders, I want share with you my opinion about Gold. Looking at the chart, we can see how the price reached the resistance line and then made an upward impulse to the 2280 support level, which coincided with the support area and soon broke this level as well. Then price made a retest and started to trades inside the range, where firstly it rose to the resistance level, which coincided with the seller zone, but at once turned around and fell to the support level. After this, Gold rebounded from the support level, which coincided with the resistance line and bottom part of the range and started to grow. In a short time, the price reached the 2410 level, breaking it, thereby exiting from the range also and even rose higher than the seller zone, but soon turned around and fell to the resistance line, making a fake breakout of the 2410 level. Soon, Gold broke the resistance line and at the moment continues to trades near this line. So, I think that XAU can rise to the resistance line and then rebound down to the support level, therefore I set my target at the 2280 level. Please share this idea with your friends and click Boost 🚀

HelenP. I Gold can break trend line and continue fall to $2290Hi folks today I'm prepared for you Gold analytics. A not long time ago price little declined and then made impulse up higher than the resistance level, which coincided with the resistance zone, but soon turned around and declined below this level, making a fake breakout. Then Gold reached the 2400 resistance level again, but at once rebounded and fell to the support zone, which coincided with the 2310 support level, and then rebounded and tried to grow. Price failed and in a short time declined lower the 2310 level, breaking it and later even reaching the trend line, after which rebounded up and broke the 2310 support level one more time. The Gold made a strong impulse up, an even higher resistance level to 2450 points, but soon turned around and started to decline. In a short time price fell to the trend line, thereby breaking the 2400 level again and now it continues to trades near this line. For my mind, XAUUSD will make a small move up and then rebound down to 2290 points, thereby breaking the trend line and also the support level. If you like my analytics you may support me with your like/comment ❤️

Gold can break resistance line and continue to move upHello traders, I want share with you my opinion about Gold. By observing the chart, we can see that the price a not long time ago started to grow inside the upward channel, where it soon broke the support level, which coincided with the buyer zone. After this, Gold made a retest and continued to grow in the channel and soon reached the resistance line, but at once rebounded and made a correction movement to support line of the channel. Then price rebounded from the support line and in a short time rose to the resistance level and also broke it and grew to the channel's resistance line. As well then, XAU exited from the channel and reached the resistance line, after which turned around and fell firstly to the 2405 resistance level, broke it again, and declined to the 2330 support level. After this, the price bounced from this level and tried to rise, but after some movement up, it rolled down to the buyer zone. A few moments ago, the price rebounded from this area and rose to the resistance line, which continues to trade near. In my opinion, the price can correct to the support level and then rebound up, higher than the resistance line, breaking it. For this case, I set my target at 2380 points. Please share this idea with your friends and click Boost 🚀
