EUR-USD Bullish Breakout! Buy!
Hello,Traders!
EUR-USD is going up now
And the pair made a bullish
Breakout of the key horizontal
Level of 1.1593 and the breakout
Is confirmed so we are bullish
Biased and we will be
Expecting a further
Bullish move up
Buy!
Comment and subscribe to help us grow!
Check out other forecasts below too!
Disclosure: I am part of Trade Nation's Influencer program and receive a monthly fee for using their TradingView charts in my analysis.
Forex-trading

NZD_USD LOCAL SHORT|
✅NZD_USD is going up now
But a strong resistance level is ahead at 0.5950
Thus I am expecting a pullback
And a move down towards the target of 0.5920
SHORT🔥
✅Like and subscribe to never miss a new idea!✅

NZD-CAD Bullish Flag Breakout! Buy!
Hello,Traders!
NZD-CAD made a bullish
Breakout from the bullish
Flag pattern and the breakout
Is confirmed so we are
Bullish biased and we will
Be expecting a further
Bullish move up
Buy!
Comment and subscribe to help us grow!
Check out other forecasts below too!
Disclosure: I am part of Trade Nation's Influencer program and receive a monthly fee for using their TradingView charts in my analysis.

AUD_JPY BEARISH BIAS|SHORT|
✅AUD_JPY has retested a key resistance level of 96.000
And as the pair is already making a bearish pullback
A move down to retest the demand level below at 95.500 is likely
SHORT🔥
✅Like and subscribe to never miss a new idea!✅

EUR-NZD Short From Resistance! Sell!
Hello,Traders!
EUR-NZD keeps growing
But the pair is locally overbought
So after the pair hits a horizontal
Resistance of 1.9680 we will
Be expecting a local correction
Sell!
Comment and subscribe to help us grow!
Check out other forecasts below too!
Disclosure: I am part of Trade Nation's Influencer program and receive a monthly fee for using their TradingView charts in my analysis.

CAD_JPY STRONG UPTREND|LONG|
✅CAD_JPY is trading in an uptrend
Along the rising support line
Which makes me bullish biased
And the pair is already making
A bullish rebound from the support
So a further move up is expected
With the target of retesting the
Level above at 107.705
LONG🚀
✅Like and subscribe to never miss a new idea!✅

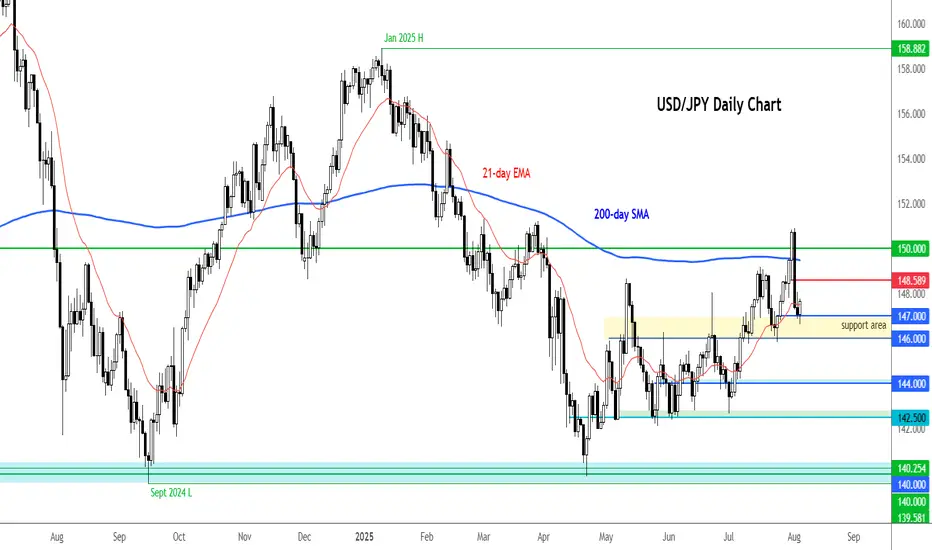
USD/JPY bounced off key support ahead of ISM surveyAfter Friday's weak jobs report and the downward revisions to prior readings, the mood shifted towards the dollar, with markets leaning towards the Fed delivering more than a couple of rate cuts this year. But we have seen a bit of a recovery in the USD since, suggesting investors are either expecting employment to pick up again or inflation to remain sticky amid higher tariffs.
Today’s attention turns to the ISM services report for July, where a modest uptick is expected. Should that materialise, it could give the dollar some further support following Friday’s wobble. We’ll also be hearing from Fed officials Susan Collins and Lisa Cook on Wednesday – and their comments may well shape expectations heading into the autumn.
Ahead of these events, the USD/JPY has bounced off the key support range we highlighted yesterday, between 146.00-147.00 area. A close below this zone would be a bearish outcome, but while it continues to hold we would favour looking for bullish trades than bearish ones. 148.60 then 150.00 are the next key levels to watch on the upside.
By Fawad Razaqzada, market analyst with FOREX.com
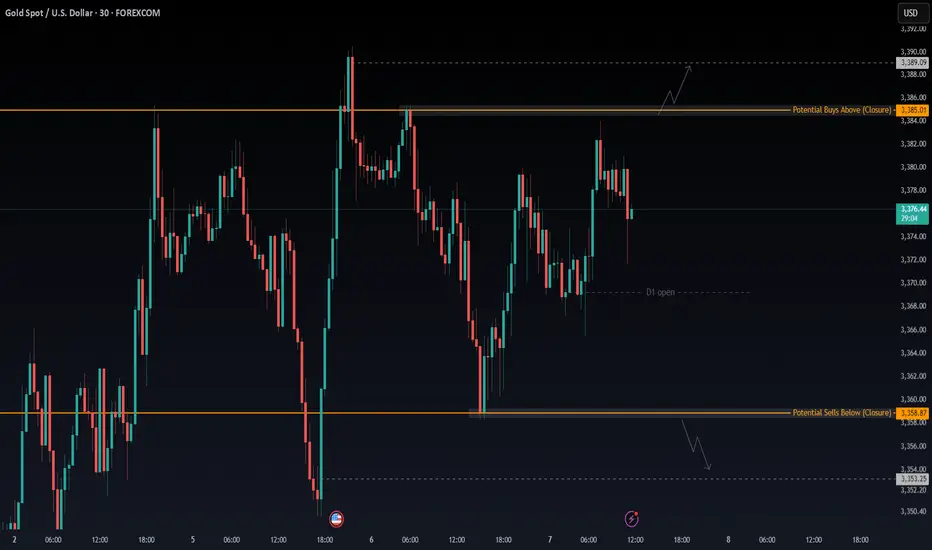
XAUUSD 30M – Stuck in a Range, Waiting for a Clean BreakGold is currently moving within a tight range between $3,385.01 (resistance) and $3,358.87 (support). Price has tested both edges multiple times, but without any clean follow through. The movement inside this zone is choppy and lacks momentum.
While trades inside the range are possible, they carry more risk due to inconsistent structure and quick reversals. The better setup is to wait for a confirmed break on either side.
Key Levels:
→ A 30 minute candle close above $3,385.01 could bring buyers in, with upside targets near $3,389.09 and beyond.
→ A clean break and close below $3,358.87 would shift momentum to the downside and may open the path toward $3,353.25 or lower.
For now, it’s a range with no clear dominance. Staying patient and waiting for a breakout gives better risk to reward.
#XAUUSD #Gold #PriceAction #RangeSetup #BreakoutTrade #SupportResistance #30mChart
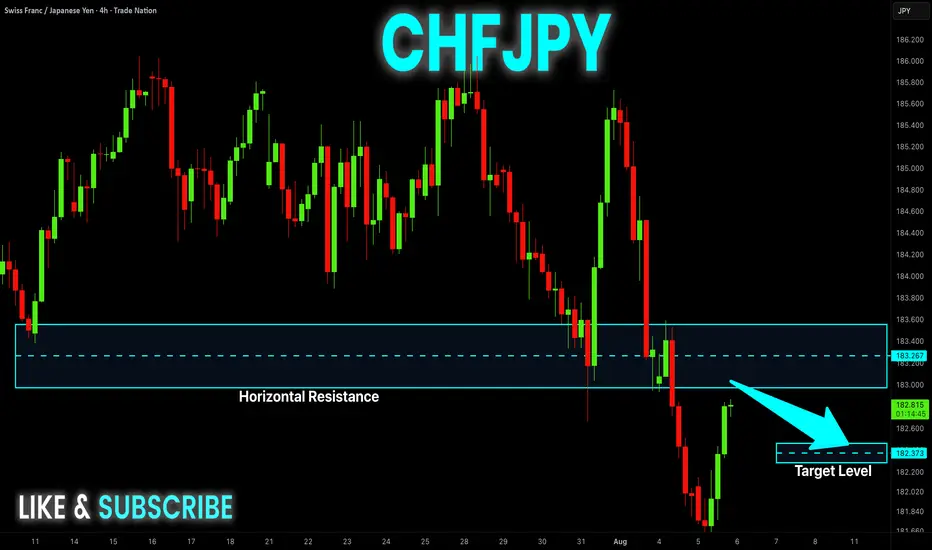
CHF-JPY Potential Short! Sell!
Hello,Traders!
CHF-JPY is making a rebound
But we are bearish biased
And after the pair hits the
Horizontal resistance of 183.400
We will be expecting a
Local bearish correction
Sell!
Comment and subscribe to help us grow!
Check out other forecasts below too!
Disclosure: I am part of Trade Nation's Influencer program and receive a monthly fee for using their TradingView charts in my analysis.
NZD_JPY LOCAL SHORT|
✅NZD_JPY went up sharply
But a strong resistance level was hit at 87.100
Thus I am expecting a pullback
And a move down towards the target of 86.937
SHORT🔥
✅Like and subscribe to never miss a new idea!✅

XAUUSD – Decision Zone Between $3,395 & $3,362Gold continues to trade within a defined structure, now pulling back from local highs after rejecting near the open. Price is approaching key support just above $3,362, which now acts as the decision point for the next leg.
Buyers held this zone previously, but momentum has weakened and the next move will be critical:
→ $3,395.76 is the upside trigger; a confirmed 30m close above could open the door toward $3,407 and higher
→ A failure to hold $3,362.60 support would expose $3,358 and possibly accelerate a bearish continuation
→ The structure remains range bound, but compression is building beneath resistance
This is a pivotal zone for gold short term. Either bulls reclaim control with a strong breakout above $3,395 or sellers step in on a confirmed breakdown below $3,362 to reset structure lower.
#XAUUSD #GoldAnalysis #PriceAction #BreakoutLevels #SupportResistance

GBP_NZD BULLISH BREAKOUT|LONG|
✅GBP_NZD broke the key structure level of 2.2500
While trading in an local downtrend
Which makes me bearish
And I think that after the retest of the broken level is complete
A rebound and bearish continuation will follow
SHORT🔥
✅Like and subscribe to never miss a new idea!✅

Gold's Next Move? Eyes on the Liquidity Trap Below!Gold has created internal liquidity during the New York session and is now moving downward. There is liquidity resting below the recent swing lows, and beneath that lie bullish Pending Demand (PD) arrays. If the market takes out this liquidity, we can then look for bullish confirmations from the PD arrays for potential buy opportunities.
Do Your Own Research (DYOR).

EUR_JPY SUPPORT AHEA|LONG|
✅EUR_JPY is going down now
But a strong support level is ahead at 169.757
Thus I am expecting a rebound
And a move up towards the target of 170.400
LONG🚀
✅Like and subscribe to never miss a new idea!✅
Disclosure: I am part of Trade Nation's Influencer program and receive a monthly fee for using their TradingView charts in my analysis.

EUR-CHF Resistance Ahead! Sell!
Hello,Traders!
EUR-CHF went up sharply
And the pair is locally
Overbought so after it
Hits the horizontal resistance
Above at 0.9367 we will be
Expecting a local bearish correction
Sell!
Comment and subscribe to help us grow!
Check out other forecasts below too!
Disclosure: I am part of Trade Nation's Influencer program and receive a monthly fee for using their TradingView charts in my analysis.

NZD-CAD Will Go UP! Buy!
Hello,Traders!
NZD-CAD made a retest
Of the horizontal support level
Of 0.8125 from where we
Are already seeing a nice
Bullish rebound so we will
Be expecting a further
Bullish move up
Buy!
Comment and subscribe to help us grow!
Check out other forecasts below too!
Disclosure: I am part of Trade Nation's Influencer program and receive a monthly fee for using their TradingView charts in my analysis.

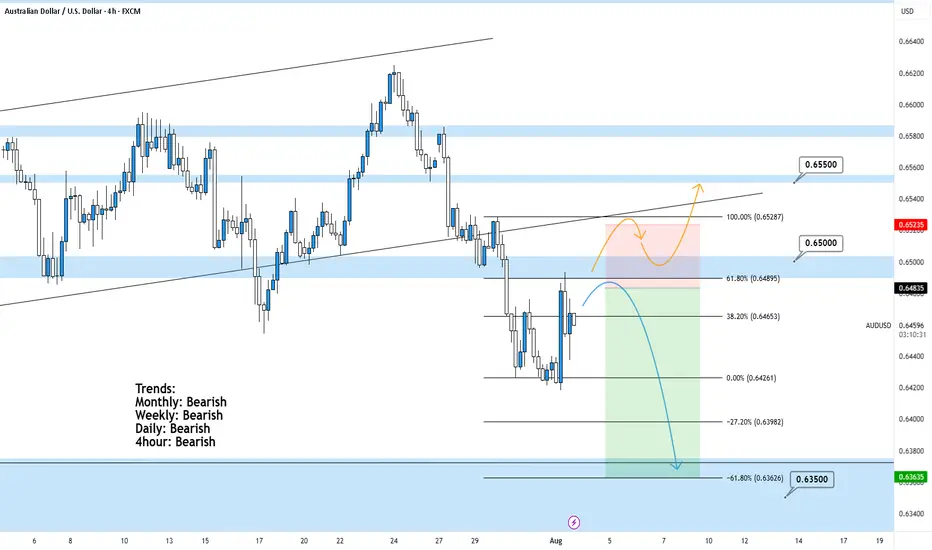
AUDUSD 4Hour TF - August 3rd,2025🟦 AUDUSD 4H Analysis Bearish Idea
📅 August 3, 2025
🔹 Top-Down Trend Bias:
• Monthly – Bearish
• Weekly – Bearish
• Daily – Bearish
• 4H – Bearish
AUDUSD remains in a clear downtrend across all major timeframes. Current price action shows a corrective move off recent lows but all signs point to this being a temporary pullback, not a reversal.
🔍 Key Zone: 0.6485 – 0.6528
This zone aligns with the 61.8% fib retracement, and previous structure making it a high probability rejection area.
✅ Scenario A: Bearish Continuation (Blue Path)
1.If price taps into 0.6485–0.6525 and rejects
2.Look for bearish confirmation (engulfing, lower high, break of structure)
Target 1: 0.6426 (previous low)
Target 2: 0.6398
Extended Target: 0.6350
This is the trend following setup, most probable given full HTF alignment.
⚠️ Scenario B: Bullish Breakout (Orange Path)
If price breaks and closes above 0.65000
1.Could signal short term shift with upside potential toward 0.6550
2.However, this is a counter-trend idea and lower probability unless higher timeframes begin shifting
🧠 Final Notes
• Bias remains bearish until proven otherwise
• Watch for confirmation at the fib/trendline confluence zone
• Patience > prediction
NZD_CAD REBOUND AHEAD|LONG|
✅NZD_CAD has been falling recently
And the pair seems locally oversold
So as the pair retested a horizontal support of 0.8125
And made a rebound
Price growth is to be expected
LONG🚀
✅Like and subscribe to never miss a new idea!✅

EUR-USD Will Fall! Sell!
Hello,Traders!
EUR-USD will hit the
Horizontal resistance of 1.1620
On Monday after making a
Powerful move up on Friday
And as the pair is locally
Overbought a local bearish
Correction is to be expected
Sell!
Comment and subscribe to help us grow!
Check out other forecasts below too!
Disclosure: I am part of Trade Nation's Influencer program and receive a monthly fee for using their TradingView charts in my analysis.

NZD-CHF Risky Long! Buy!
Hello,Traders!
NZD-CHF keeps falling and
Will hit the horizontal support
Of 0.4738 on Monday from
Where we will be expecting
A local rebound and a
Bullish move up
Buy!
Comment and subscribe to help us grow!
Check out other forecasts below too!
Disclosure: I am part of Trade Nation's Influencer program and receive a monthly fee for using their TradingView charts in my analysis.

NZD-JPY Local Long! Buy!
Hello,Traders!
NZD-JPY is retsting a
Strong horizontal support
Level around 87.044 and
As the pair is locally
Oversold we will be expecting
A local rebound and a move
Up on Monday!
Buy!
Comment and subscribe to help us grow!
Check out other forecasts below too!
Disclosure: I am part of Trade Nation's Influencer program and receive a monthly fee for using their TradingView charts in my analysis.

EUR_USD POTENTIAL SHORT|
✅EUR_USD has been growing recently
And the pair seems locally overbought
So as the pair is approaching
A horizontal resistance of 1.1632
Price decline is to be expected
SHORT🔥
✅Like and subscribe to never miss a new idea!✅
Disclosure: I am part of Trade Nation's Influencer program and receive a monthly fee for using their TradingView charts in my analysis.

CAD_JPY BEARISH BREKAOUT|SHORT|
✅CAD_JPY broke the key structure level of 107.400
While trading in an local downtrend
Which makes me bearish
And I think that after the retest of the broken level is complete
A rebound and bearish continuation will follow
SHORT🔥
✅Like and subscribe to never miss a new idea!✅
Disclosure: I am part of Trade Nation's Influencer program and receive a monthly fee for using their TradingView charts in my analysis.
