HOW DOES THE FED PUSH THE MARKET?Hello everyone!
Today I want to discuss with you a very important and interesting topic.
This topic relates to fundamental analysis and it will be useful to every trader.
Let's go!
The US Dollar and the whole world
As we know, after the Second World War, the dollar became the main reserve currency.
The US economy has grown and become the largest on the planet.
The impact of the US dollar on the world seems to have no boundaries.
All central banks of all countries are forced to hold large amounts of funds in dollars.
Because it is the dollar that makes it possible to make monetary transactions between countries without any problems.
Thanks to the growing US economy, it is profitable for countries to invest in US bonds and in American companies.
Based on the above, the whole world depends on the US Dollar.
The Fed and the interest rate
The Fed has one of the most important instruments of influence on the economy – the interest rate.
The whole world is watching what the Fed decides on the interest rate.
Why?
Everything is simple.
The interest rate is the interest at which loans are issued to banks.
If the interest rate is high, it is expensive to take out a loan and therefore there are fewer loans.
If the interest rate is low, it is inexpensive to take loans, and therefore companies happily take cheap loans.
How does this affect the market?
As you know, companies need funds for growth, one of the sources of funds is credit.
If the interest rate is low, it is easy for companies to take out loans and direct funds for development – the company is growing.
When companies grow, the stock market grows, people invest in stocks, the market grows even more.
On the other hand, if the interest rate is high, it is expensive to take out a loan and companies do not grow because of this, people do not invest in them.
And where to invest in such moments?
In bonds.
The lower the interest rate, the higher the yield on the bonds.
Remember this.
People still need to invest their funds somewhere, and they choose a less dangerous option than stocks, which will help save their funds, and at this moment many choose bonds, the demand for them has lost, the yield is growing.
Interest rate data pushes the market, forces huge amounts of funds to flow from bonds to stocks, big banks take loans or vice versa, all this affects the American economy, on which the whole world depends.
That is why it is so important to monitor the Fed data, understand how they affect the market and the ability to correctly interpret the data can ultimately bring you a lot of profit.
Traders, if you liked this idea or if you have your own opinion about it, write in the comments. I will be glad 👩💻
Forex-trading-signals
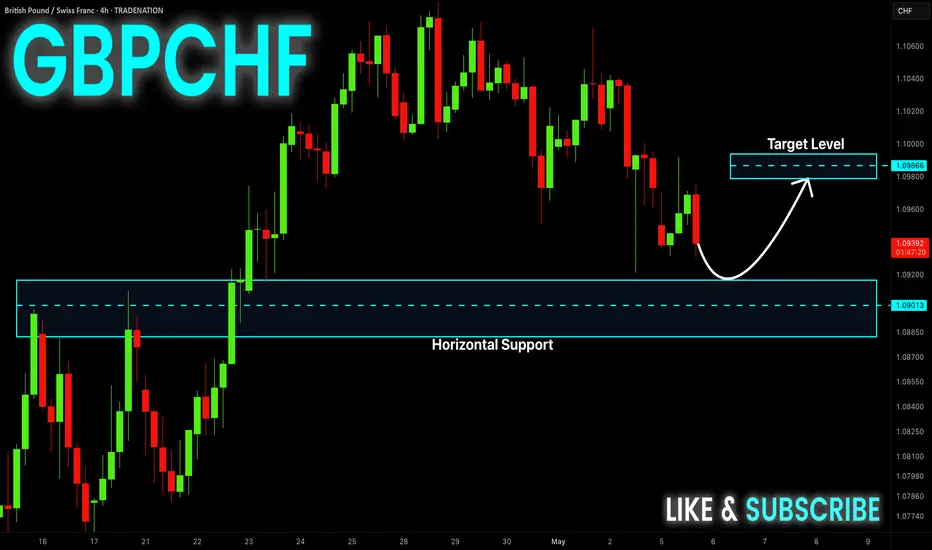
DOUBLE BOTTOMHello everyone!
It's time to repeat the most popular patterns in trading.
One of these patterns is a DOUBLE BOTTOM.
Forming
There are several factors that you should pay attention to.
First, a new minimum appears.
This breakthrough is accompanied by increased volumes.
Such volumes are fixed by the indicator at this point, because there were a lot of stop orders here and the market absorbed them.
After this breakdown, the price begins a correction.
Nowhere without correction.
The correction is usually made to the breakout level, which used to be support, and now is resistance.
Having reached the level, the price turns down again.
And here is an important point.
If this breakdown is strong, then the price should go to update the lows further.
In theory, you can open short positions in the rebound area in the hope of continuing the trend.
Then we see the formation of the second bottom.
One of the main factors that the price will not fall further is the declining volumes.
This is a divergence.
From this we understand that forces are shifting to the other side and the trend may change.
In addition, we see that the price could not gain a foothold below the first bottom, which tells us about the weakness of sellers.
results
A double bottom is often found on the chart and serves as a signal for closing short positions and possibly opening long positions.
With a proper understanding of this pattern, you can get a lot of profit from trading.
The main thing is not to forget to monitor volumes, divergence and candlesticks that indicate the strength or weakness of the trend.
Traders, if you liked this idea or if you have your own opinion about it, write in the comments. I will be glad 👩💻
THE WAY THE TREND CHANGESHello everyone!
We continue our training.
Today we will try to figure out how the trend changes its direction.
I want to say right away that this is a schematic designation, having understood which, you will be able to identify important zones and structures of trend change.
When you understand the principles, then you can make money on it.
Accumulation
The first area to pay attention to is the accumulation zone.
These zones collect large volumes of limit orders on both sides of them, which is liquidity.
This liquidity will be eaten up by the market at some point.
Breakdown
At some point, the price makes a breakdown in one of the sides, thereby eating up liquidity.
This breakdown may be a normal continuation of the trend, and in order not to confuse it with a reversal, you need to wait for the next phase.
Update
After the breakdown, the price turns sharply and updates the minimum of the accumulation zone.
What happened here?
If the trend had the strength to continue its movement, the price would not have formed a new low
After updating the accumulation zone, the price indicated to us a possible trend change.
Correction
Then we can observe a return to the accumulation zone, but this movement turns out to be weak, and we do not see an update of the maximum of the accumulation zone.
At this point, it is possible to consider opening a short position.
But if you don't have time to open a position, don't worry, the price will give you another chance.
After updating the last minimum, the price is again adjusted to the accumulation zone, but this peak is lower than the previous one.
This reversal is a good signal to enter a position.
This is how the price behaves when the upward movement is reversed.
To reverse a downtrend, the same rules work only in the opposite direction.
Conclusions
This scheme works perfectly.
Using it, you will be able to find excellent entry points and close positions that were opened against the emerging trend.
History repeats itself, and you can see it on the graph.
Learn how to work with these schemes in order to be able to enter the position in time in the future.
Learn, practice and earn.
MARKET CONDITIONS Hello everyone!
We continue the series of training articles.
Today I want to touch on the topic of MARKET CONDITIONS .
Go.
What is the market like?
As you know, the market does not move only up or only down.
The price always makes fluctuations of a wave nature.
What does it mean?
BEARISH TREND
This trend is characterized by the fact that the price updates the previous lows, but cannot update the previous highs.
If you look at the monthly chart, such a movement may consist only of falling candles.
In fact, if you switch to a smaller timeframe, you can see corrective movements.
And this can be observed on all movements.
In a bearish trend, it is best to open short positions.
A good moment to open a position can be the end of the correction, which confirms that buyers are not able to update the maximum, which means that the downtrend is still strong.
RANGE
This period of the market is the most boring, because the price is not particularly moving anywhere.
In fact, there is an accumulation of large positions.
But boring does not mean that it is impossible to make money on it.
The simplest trading tactic under such conditions is to sell from the resistance level and buy from the support level.
Do not forget to put a stop loss, because sooner or later there will be a breakdown.
BULLISH TREND
This trend is characterized by an increase in price, an update of the highs and the inability to update the lows.
The fact that sellers cannot push the price below the previous minimums tells us that the strength is on the buyers' side.
It is best to open long positions and press the updates of the highs.
STRUCTURE
This structure or model: BEARISH TREND - RANGE - BULLISH TREND, will occur very often.
This is exactly how the trend is changing.
At first, the price is controlled by one star, it can be bears and then there will be a downtrend, it can be bulls and then there will be an uptrend.
At some point, the dominant force loses power over the price, and the opposite one gains momentum, at such moments the range begins.
There is a struggle going on here and whoever wins will rule the price.
Sometimes it also happens that after the range, the previous trend continues, which means that the opposing force did not have enough power to change the trend, be prepared for this.
CONCLUSIONS
Do not think that the trend will continue forever.
Do not believe that you know the future and the price will go exactly where you predicted.
Be objective and study the market.
Traders, if you liked this idea or if you have your own opinion about it, write in the comments. I will be glad 👩💻
THE MOST TRADED CURRENCIES IN THE WORLDHello everyone!
Today we will touch upon an interesting and important topic of the forex market.
There are enough opportunities in the world to trade currencies of all countries, but most of the trade volume is occupied by the main ones.
Let's figure out which currencies are traded by traders more than others.
US Dollar
The most important currency on the planet is the US Dollar.
There is nowhere without it: most of the operations on the market take place through the American dollar.
In addition, the United States is currently the largest economy on the planet. A huge part of world trade is concentrated in the USA or occurs through the USA.
The dollar itself is the reserve currency in the world, central and commercial banks hold large reserves of dollars in their accounts to make international transactions.
Yes, Gold, Copper, Oil and much more are valued in dollars.
Wherever you look, there is a dollar everywhere and everyone uses it.
Because of these factors, the dollar is No. 1 in terms of volumes with an average daily volume of 2.9 trillion US dollars.
Euro
The second largest trading currency in the world.
The main reason is the scale of the economies of the countries that are part of the eurozone.
Currently, the eurozone unites 20 countries.
Countries such as Germany, France, Italy have quite large economies, in total, together with other European countries, the euro accounts for 20% of world reserves.
The average daily volume is almost 1.1 trillion US dollars
Japanese Yen
Over the past decades, the Asian region has developed strongly.
Countries improved and increased production, which eventually led to the fact that Asian countries are now of great importance in the global economy.
Japan's manufacturing sector has a strong influence on the world and on the yen.
Therefore, when export figures increase, the yen rises.
The Japanese yen currently ranks third in terms of trading volumes in the world, with an average daily volume of 554 billion US dollars.
Since China is a key competitor of Japan in the industrial goods market, the weakening of the Chinese yuan has a detrimental effect on the yen, because then the export of Chinese goods will become more attractive.
In addition to China, the yen is also affected by the price of oil, since Japan is a major importer of this raw material.
Pound Sterling
The official currency of the United Kingdom and its Territories is the Pound sterling.
The economy of the Kingdom is of great importance for the entire world economy, since England is one of the main financial centers of the world.
In terms of volume, the pound sterling ranks fourth in the world with an average daily volume of almost 422 billion US dollars.
The share of this currency accounts for about 4.5% of world reserves.
The main indicator of the strength or weakness of the currency is the UK.
The monetary policy of the Bank of England, the GDP of England has a strong influence on the currency.
The exit of England from the European Union also had a strong impact.
It is the Pound Sterling that closes the four largest volumes of the planet.
Then there are such currencies as the Australian dollar, Canadian Dollar, Swiss Franc, Chinese Yuan.
All of them in total, of course, lose to the big four listed above, but these currencies also have sufficient volume, which makes it possible to trade pairs with these currencies quite profitably.
Volatility
Given the volume of a particular currency in the global economy, we can understand which currency pair will have greater volatility and which will not.
If you are a trader who wants to make a profit quickly, then the EURUSD pair is suitable for you – the two largest economies in the world.
Next comes – USDJPY. The economies of these countries are in first and third place, respectively, which means greater volatility.
If you need something in between, then you should pay attention to such currencies as – AUDUSD, USDCAD, NZDUSD. These currencies are linked to the first economy of the world, which will give sufficient volatility, while the second currency in these pairs does not have a huge volume, so price movements will not be so dangerous for a conservative trader.
You can also pay attention to pairs where countries with a smaller global volume are involved. Movement in these pairs will be slow and sometimes even boring, but definitely very safe.
Conclusion
Knowing which currency is strong on the world stage and which is not is very important for choosing a pair for trading.
Knowing what affects a particular currency helps to understand the future price movement.
Professional traders understand these issues and choose currency pairs suitable for their style.
Beginners trade everything in a row.
Do not be lazy to study and then the profit will come to you.
Traders, if you liked this idea or if you have your own opinion about it, write in the comments. I will be glad 👩💻
BUYERS vs. SELLERSHello everyone!
Who are the stronger sellers or buyers right now?
The one who finds out the answer will be able to earn a lot.
Over time, one side weakens, the other gains strength.
It is not easy to catch this moment, but there are several methods for determining a possible change in the dominant force in the market.
Japanese candles, namely their bodies, can help us with this.
The body shows how strong or weak one or the other side is.
The body shows whether buyers are losing strength and whether sellers are gaining strength.
Are buyers or sellers strong?
By looking at a particular candle and its body, we can understand what was happening in the market in a given period of time.
If we see a full-bodied green candle that has no shadows, then we can say with confidence that buyers are winning.
The point is that buyers were able to push the price up after the opening and until the closing, which sellers could not resist.
On the other hand, if we see a full-bodied candle of red color, we can say that the sellers won.
Without much resistance, sellers pushed the price down from the beginning to the end and were able to close at the very bottom of the candle.
Full–bodied candles speak of enormous strength, they can appear confirming the trend or starting it, in any case - this is a strong sign.
Still strong, but…
If you see a green candle with a long body and small, short shadows on the chart, then you can say that buyers dominate the market.
But what are these shadows?
These shadows remind us that sellers, although losing heavily, still did not give up.
It's the same with candles that have long red bodies and short shadows.
Sellers are strong, but buyers are still here, as the shadows remind us.
Seeing such shadows, you should not be afraid and open positions in the opposite direction, no.
It's just a reminder.
The fight is getting harder.
A candle with a small green body, which is located at the top, shows us that buyers have taken over the market, but the victory turned out to be very difficult.
The long shadow under the body indicates to us the rage of the sellers, who dragged the price down for a very long time, but still lost in the end.
Maybe it was the last impulse of buyers?
This fight was almost on an equal footing, but the victory remained with the buyers.
In such situations, you can ask the question - Will there be a U-turn?
Red body on top, with a long shadow.
The sellers won here, but the buyers fought with dignity.
Depending on the context, this figure can serve as a signal of an imminent reversal.
After all, sellers were able to push the price very deep, but buyers did not give them a foothold there.
The last push?
The short body is green, and above it is a long shadow.
The victory remained with the buyers, but was it easy? No.
Perhaps it was the last rush of buyers, after which there is no strength to fight anymore.
Maybe the price will not turn right away, because the buyers have won and they still have strength, but their strength is clearly running out.
The same is the case with candles, whose bodies are red, indicating the victory of sellers, but long shadows over the body indicate the strength of buyers.
The forces of buyers were able to push the price, but not to fix it.
This signal is even more bearish, because the price closed below the opening.
Conclusion
Each candle is important, but the context is more important.
Candles help to get the first signals if you are able to understand them correctly.
The shadows of candles are the story of a struggle that usually escapes the eye, but at the same time carries a lot of information.
Be careful and don't stop learning.
Traders, if you liked this idea or if you have your own opinion about it, write in the comments. I will be glad 👩💻
GUIDE TO JAPANESE CANDLESHello everyone!
Today we will discuss JAPANESE CANDLES!
Let's try to understand what they mean and how to use this information in your trading.
LET'S GO!
Bullish and Bearish PIN BAR
A bullish pin bar is a candle with a long shadow, the body of which is located at the top of the candle.
Such a candle was formed under the pressure of sellers who were able to push the price down, after which buyers turned on, who pushed the price above the opening and were able to gain a foothold there.
This strength of buyers signals to us that sellers are losing dominance in the market and a trend reversal is possible soon.
A bearish pin bar has a mirror structure relative to a bullish pin bar.
Buyers can't keep the price high, and sellers take up the trend.
At these points, we can expect the early completion of the previous impulse and a possible trend change.
Bullish and bearish harami
Bullish harami consists of two candles: the first is a long full-bodied candle, the second is small with a small body.
After a strong downward impulse (the first candle), a sharp reversal begins (the second candle).
At the same time, the second candle often opens with a gep.
The momentum of the first candle is the last spurt of the market, after which buyers take over the market.
The gap in the opening of the second candle and the closing of the first confirms the strength of buyers.
Bear harami has a similar structure, but a mirror movement.
The last impulse of buyers, was replaced by the gep of sellers.
This sign indicates a possible reversal.
Bottom and top tweezers
These Japanese candles are characterized by two long full-bodied candles.
After the first strong impulse, there is a sharp reversal in the opposite direction.
This reversal has a huge force, as it is able not only to turn the price against the main trend, but will immediately gain a foothold low.
This figure is called tweezers, as the price pierces the level and abruptly returns back.
A very strong signal for a reversal.
Conclusion
These patterns are very popular and useful.
The ability to use them correctly in trading can bring significant profits.
These patterns help to determine the price reversal, which contributes to a better entry into the position.
Traders, if you liked this idea or if you have your own opinion about it, write in the comments. I will be glad 👩💻
GOLD in 2023Hello everyone!
Today I want to try to analyze the factors that will affect gold in the new year.
We will try to understand what to expect from gold and where the price may end up.
The difficulty of predicting GOLD prices
Predicting a possible future is a difficult and thankless task for itself.
Predicting the future price of gold is also difficult, because gold is an independent asset and it can be perceived as a separate currency.
At the same time, if currencies can be tied to the economies of countries, then what should GOLD be tied to?
The main indicators for gold are the volume of its purchases, the volume of invested funds of gold mining companies and the cost of gold production in general.
Since gold is used in the jewelry industry, it is possible to predict the future price movement of an asset if you understand the future demand for jewelry, which is very difficult to do.
With economic growth, people become richer and buy jewelry, which increases demand.
Moreover, during economic downturns, it increases the amount of money invested in gold, so people try to escape from inflation and loss of money in a crisis.
It is difficult to compare all these data with each other, because there is a lot of uncertainty in them, which is why the forecast for gold is a difficult matter.
Profitable?
Historically, gold is constantly growing.
Since 2000, the price of gold has increased 6 times.
Since 1970, gold has grown 51 times.
Does this mean that it will grow next year as well?
No. Such a large historical period gives us an idea of the direction of the main trend.
2023
The World Bank has made a forecast for the next year, which indicates that the price of gold will fall.
But don't blindly believe other people's analytics.
For example, the World Bank in 2018 predicted that in 2021 the price of gold will be equal to $ 1,247.
Now we know that the price in 2021 was in the range from 1676 to 1950.
You always need to conduct your own analysis and draw your own conclusions.
Now let's try to understand what will happen in 2023.
There are several main factors that point to the growth of gold next year:
1. Low interest rates
2. Raising inflation expectations
3. Higher oil prices
4. Increased demand from institutional investors
5. Devaluation of currencies of emerging economies
Low interest rates
The yield on 10-year Treasury bonds is at a historically low level.
Now investing in such bonds will bring you 1.5% per year.
That is very little and investors will look for alternative sources of income.
Since the stock market is overheated, investing in gold looks like an attractive option.
A large amount of investment funds will push up the price of gold.
Rising inflation expectations
Inflation is accelerating already this year and the US Federal Reserve predicts an increase in inflation in 2023.
Inflation is growing every year and in 2022 it amounted to more than 4%.
Inflation, as you know, devalues the currency, which increases the value of gold.
The amount of gold that you could buy for $ 1,000 a few years ago is already worth more, and it will no longer be possible to buy the same amount for the same money, and this trend is expected to continue.
Higher oil prices
Historically high oil prices contribute to an increase in the value of gold.
This can be explained by the fact that oil is an important factor in increasing inflation, the growth of which, as we noted above, weakens the currency, which positively affects the price of gold.
Everything that makes the currency weaken makes gold only stronger.
In 2023, according to analysts' forecasts, the price of oil will rise, respectively, we can expect an increase in gold.
Increased demand from institutional investors
In 2022, the record for the volume of gold purchases was updated.
Central banks bought 400 tons of gold worth $ 20 billion, which is the highest figure in half a century.
And there is an explanation for this: low interest rates and currency printing leads to currency depreciation.
Banks need to somehow avoid losses.
The stock market is overheated, and bonds give too small a percentage of profit, which, according to expectations, will not help to avoid even inflationary risks, and what remains?
The market correction forces Central banks to buy huge volumes of gold, which inevitably pushes the price.
Conclusions
These are not all factors that may affect the growth of gold next year.
In addition, the world is extremely volatile and there is a possibility of factors that will push the price down, for example, an increase in interest rates or other drastic changes related to inflation and, for example, the adoption of cryptocurrencies by world banks.
Unexpected and drastic political decisions and the actions of some countries have already been able to affect the global economy this year.
That is why long-term forecasting of such an important asset for the global economy as gold is extremely difficult.
It is necessary to be objective in the analysis, open to the possible emergence of new factors and soberly assess the real situation.
Traders, if you liked this idea or if you have your own opinion about it, write in the comments. I will be glad 👩💻
ANALYSIS OF THE BULLISH MOVEMENTHello everyone!
Today I want to discuss with you the bullish movement or bullish momentum.
The topic is interesting, and most importantly profitable!
Beginning of observations
To begin with, we need an uptrend.
If you open long positions when there is an uptrend in the market, you will make a profit more often.
The best entry point will be a reversal, after correction.
This is the moment we are waiting for.
The beginning of the correction will be marked by the renewal of the lows and the scrapping of the upward trend.
An imbalance appears on the chart, usually in the area of the level breakout..
Reversal+position opening
The beginning of an upward movement begins to emerge when the price cannot update the minimum and begins to form each new minimum above the previous one.
In addition, the structure breaks down and an imbalance appears in the area of breaking the level up.
Long positions can be opened at these points.
If you did not have time to open a position or want to wait for a conservative opportunity to enter, you can open a long position when the price returns to the previously broken level and tests it again.
Goals
Previous highs may be the targets.
This price movement pattern is observed on all timeframes every day.
With the correct use of this method, if you have trained well and learned how to correctly identify these points, you will be able to earn.
Train, study and earn .
Traders, if you liked this idea or if you have your own opinion about it, write in the comments. I will be glad 👩💻
THE HISTORY OF FOREXHello everyone!
Today I want to dive into the history of the Forex market.
Knowing history is useful, because sometimes history repeats itself.
The one who knows history will not make the mistakes of the past.
The beginning of the story
With the advent of markets, the question arose how to pay for the goods.
In ancient times, the first way was barter.
People exchanged some goods for others.
This method developed and at some point salt and spices became popular means of exchange.
In the 6th century, people realized that they needed to come up with something universal, so the first gold coins came to replace spices as payment.
Gold coins differed from spices and other trading methods in important features: portability, durability, divisibility, uniformity, limited supply and acceptability.
The Gold Standard
For a long time, gold coins were used as payment.
The problem was that they weighed a lot and it was extremely inconvenient to carry them in large quantities.
So, in the 1800s, countries adopted the gold standard.
The idea was that the government promised to redeem paper money if someone decided to exchange it for gold.
The amount of gold is limited and its extraction costs money and time, in difficult times it has become difficult to get enough gold to print a new volume of paper money.
During the First World War, countries had to suspend the gold standard, because more money was needed to wage war, and right now.
The Bretton Woods system
After the Second World War, representatives of the United States, Great Britain and France to create a new world order.
The whole of Europe suffered from the war and only the United States was able to emerge victorious, because the dollar had only become stronger by that time.
The adoption of the Bretton Woods Agreement was aimed at creating a regulated market with a currency peg.
A regulated fixed exchange rate is an exchange rate policy in which a currency is fixed against another currency.
All countries fixed their exchange rate to the dollar, and the dollar was pegged to gold, since after the Second World War, the SS owned the largest reserves of gold.
In the end, the old gold problem loomed over the market again. More money was needed, and there wasn't enough gold for that. Therefore, in 1971, Richard M. Nixon put an end to the Bretton Woods system, which soon led to the free floating of the US dollar against other foreign currencies.
The beginning of a free-floating system
European countries were not happy with the dollar peg, so in 1972 an attempt was made to get rid of the dollar.
The agreements created by the Europeans, like the Bretton Woods Agreement, collapsed in 1973 and all this led to the transition to a free-floating system.
Plaza Accord
In the 1980s, the dollar rose strongly, exporters did not like it.
In the early 1980s, the dollar rose strongly against other major currencies. It was hard for exporters and the subsequent US balance of payments.
The US dollar weighed on third world economies and led to factory closures.
In 1985, a secret meeting was held between representatives of the largest economies, but information about the meeting leaked to the media, which forced the countries to make a statement encouraging the strengthening of non-dollar currencies.
This event was called "Plaza Accord", after which the dollar began to fall sharply.
EURO
The Second World War broke up the countries of Europe, creating many economic problems for the region.
Wanting to save the region, many treaties were concluded, but the most fruitful was the 1992 treaty called the Maastricht Treaty.
The introduction of the euro has given European banks and businesses a clear benefit from eliminating currency risk in an ever-globalizing economy.
Online trading
In the 1990s, the world began to develop rapidly.
What used to require more time and human resources was now being done faster and cheaper thanks to the Internet.
Money began to flow quickly from hand to hand, between continents, volumes grew rapidly.
The fall of the Berlin Wall and the collapse of the Soviet Union made the world open, there was an opportunity to trade Asian currencies that were previously inaccessible to traders.
Online trading has started to reach a new level.
Liquidity has increased dramatically due to the congruence of markets, spreads have decreased due to the competition of online brokers and new technologies.
The time has come when anyone could enter the forex market and try to make money.
The volume of funds in the market grew at an incredible rate.
The future of the Forex market
The forex market is growing from year to year.
Volumes are increasing.
There are more and more opportunities.
Trading is evolving, as is the currency, which has led to the creation of cryptocurrencies and the crypto market, the development of which is striking in its rapidity.
Never in history has a person had such an opportunity to earn a lot of money sitting at home.
But do not forget about the risks, study the market and trading methods and then you will be able to grab your piece of the big pie.
Good luck!
Traders, if you liked this idea or if you have an opinion about it, write in the comments. I will be glad 👩💻
HOW TO DETERMINE THE TRENDHello everyone!
Today I want to discuss with you the methods of trend identification.
Finding a trend is an important task, because it is by trading according to the trend that you can earn a lot of money.
PATTERNS
Thanks to the patterns, you can understand where the price will go.
There are many patterns confirming the trend: flag, pennant, wedge, and so on.
The exit from these patterns is the confirmation of the strength of the main trend.
Follow the patterns, they will help you find the trend.
MA
Moving Average is an important trend indicator and is quite clear and simple.
The moving average is used by analysts in large banks and funds for a reason.
The main trend indicator is the price rebound from the moving average.
If the price bounces from the moving average towards the trend, then the trend is strong.
CHANNELS
The trend pushes the price in one direction and even the corrections become shorter.
Under such conditions, the channel boundaries are directed towards the trend.
Channel breakouts also occur in the direction of the trend, which is a confirmation of the trend.
FIBONACCI
Thanks to the Fibonacci levels, you can identify good entry points.
It is enough to stretch the grid to the price impulse.
This trend helps to open a position with a good entry point.
And what methods do you use to identify the trend?
Traders, if you liked this idea or if you have an opinion about it, write in the comments. I will be glad 👩💻
VIX IndexThe Volatility Index VIX is one of the most popular methods for determining stock market emotions. In full, it stands for CBOE Volatility Index, the volatility index of the Chicago Board Options Exchange.
The market is an emotion, always has been, always will be. Robots? Great, but they are created by people with emotions. And a trader needs a method that allows him to identify these emotions. That's where the VIX index comes in. It is based on the volatility of options on the S&P 500 Index. Yes, yes, it's actually an index for an index, this happens in the markets. The VIX index is also known as the Fear and Greed Index.
The index is expressed as a percentage and indicates the probability of the S&P 500 index moving over a period of 30 days, where the probability level is 68% (one standard deviation from the normal distribution curve, aka the Gaussian curve). Let's say that if the VIX is 15, therefore the expected change in the S&P 500 index over the course of a year, with a 68% probability, is less than 15% up or down.
What does that have to do with emotion? For that, we need to understand the forces that underlie any strong market movement.
Greed is the desire to possess more and more than is really needed. Whether it be money, goods, services, or any material values.
According to a number of scientific studies, greed is the product of a chemical reaction in our brains that causes common sense to be discarded and sometimes causes irreversible changes in both the brain structure and the body. Perhaps someday a pill for greed will be invented, but for now, everyone is greedy without restraint.
Greed is as addictive as smoking or drinking alcohol. "He has pathological greed," "he's the greediest guy the world has ever seen," are all victims of a very common mania.
The average trader comes to the market and he is subjected to the strongest emotional influence, caused by the very brain "chemistry". He wants more and more and more, all the time. He wants more numbers on the account. He can't stop, he can't control himself. As the result, brokers and different near-market agents use this obsession with pleasure, exploiting his mental disease.
Similar effects are associated with the emotions of "happiness" and euphoria. As a result, such traders' brains are constantly bombarded with emotional temptations and endless financial carrots, just as narcotic substances give the effect of not getting high at all but of temporary relief.
The dot-com bubble
This is a classic example of market greed. The Internet bubble led to millions of investors continuously pouring money into Internet companies between 1995 and 2000, despite the fact that most of them had no future.
It got to the point of absurdity. Some companies were getting hundreds of millions of dollars just for creating the website "XYZ dot com". Greed bred greed, led to a colossal overestimation of assets and their real value. Investors, obsessed with making easy money, invested insane amounts of money in nothing. The inflated bubble naturally burst and took all the money of the greedy people with it.
The Financial Crisis of 2008
The book "The Big Short: Inside the Doomsday Machine" by Michael Lewis (and the movie "The Big Short ") tells the story of how a few people profited from the massive greed of others. An instrument like CDS (Credit Default Swap) turned into a crazy financial pyramid scheme with a turnover of over $62 trillion. In the financial crisis of 2007-2010, the volume of this market shrank threefold another bubble driven by greed and obsession burst at the seams, and the financial world shuddered and shrank dramatically. Only a few people made a fortune as they worked against the greed of the crowd.
Fear
An uncomfortable state of constant stress, waiting for the worst fate and constant threat. The dot-com bubble also demonstrated this emotion well. To cope with the horrific results of the dot-com bubble, out of fear, investors took money out of the stock market and put it into the safest possible instruments, like stable investment funds or government-backed funds. These funds were not very profitable, but their main advantage in the eyes of investors was minimal risk. This is an example of how investors ruined all of their long-term investment plans because fear forced them to hide their money literally under their pillow. These assets did not generate income, but remained conditionally safe.
How to read VIX
The correlation between the VIX and the S&P 500 is quite clear. Let's compare the values, where the blue line is the VIX and the orange line is the S&P 500.
As we can see, a decrease in the VIX corresponds to an increase in the S&P 500, while an increase in the VIX (fear) in contrast is a signal of a collapse of the S&P 500.
Statistics show that there is an inverse correlation between the VIX and the S&P 500, as the VIX moved in the opposite direction from the S&P 500 more than 80% of the time between 2000 and 2012.
Where the VIX peaks, there is a decline in the S&P 500 and all the associated effects that affect both the dollar and other currencies.
So, if the VIX is less than 20, investors are less worried, the volatility of the S&P 500 is expected to be low.
If the VIX is greater than 30, investor fear increases as option prices on the S&P 500 rise; hence, investors pay more to hedge their assets.
A typical picture is, for example, the VIX is at an ultra-low 10 and the S&P 500 is breaking new growth records. This is all an indication of an impending collapse of the S&P 500. However, if the Central Banks change monetary policy accordingly, this VIX level could very well become the new "normal" value.
One scenario to use is to wait for the VIX to consolidate above 30 and enter the SPX on its decline. When investors have a scare, it's an indication of a panic sell-off.
Let's look at some real examples. Since the beginning of this year, the VIX Index has been hitting fear records, reaching a high of 30. In theory, this means a drop in the SPX index.
Well, why in theory? In practice it worked out 100%, the SPX index really collapsed spectacularly.
Conclusion
As we know, the S&P 500 index, which we have already studied, is the "king" index. It not only shows the state of the U.S. economy and stock market, but also indirectly shows the state of a mass of other assets, from interrelated indices to the value of the dollar. Because of correlation, Fear and Greed indices can be adapted to everything, both indices and currency pairs. It is one of the most popular stock indicators, unique in its kind and actively used for long-term market forecasts.
5 Steps to Better TradingStart journaling
This is one of the most important things in trading. You can see the numbers clearly without fooling yourself and know what's working and what's not. It also helps to start noticing the most common trading mistakes you may be making, whether you enter/exit early, whether you are better at managing trades actively or passively, the quality of your SL/TP levels and the likelihood of reaching them, etc.
If you spend 20 minutes going over your log this weekend, it will give you more insight into how to minimize losses and maximize profits than anything else you can do.
Stop trying to predict the market
This is another big problem. Wizards effortlessly take other people's money: Casinos, they don't try to predict a player's next move, they just set up a statistical edge in their favor and watch it happen over time. This is the closest thing to the Holy Grail that will ever exist.
Not opening a position is in itself a position
FOMO causes traders to get into losing trades more often than anything else. Learn to be patient and just wait for quality trades, it has given me one of the biggest boosts to growth and greatly limits losses. Staying committed to a trading plan, limits the temptation to make impulsive trades. This habit will help to control the FOMO trades. be patient, be disciplined the market will always present opportunities.
Solid risk-management
Limiting maximum drawdown and MAE, limiting leverage (but also increasing it on high probability sets), backtesting, equity curve modeling, maintaining a good asymmetric RR, cross correlation/diversification, etc. Wait for confirmation before entering a trade. better to enter a trade late and be right, than early and be wrong.
Treating trading as a job
Take your work as seriously as any other important activity in your life. You should have regular trading start and end hours, and prepare very carefully for trading sessions. Also, write reports and collect statistics to document your work.
The Most Powerful Consolidation PatternWhat is the Cypher Pattern?
Cypher is a powerful consolidation pattern. In the harmonic pattern world, the Cypher pattern is a four-leg reversal pattern that follows Fibonacci ratios. The Cypher pattern is less common because it's hard for the market price to match up with fixed Fibonacci ratios. The Cypher pattern needs to follow the Fibonacci sequence in order to work correctly. This pattern works well in the ranging markets. The winrate of this pattern can reach up to 70%. On an hourly timeframe, for example, it has a 72% win rate on AUDCAD.
Defining the Cypher Pattern
The first rule of the Cyper pattern is that the price of a security must stay above the 0.382 Fibonacci ratio and below the 0.618 Fibonacci ratio. There is a third point in the Cypher pattern, which is labeled "B." This is the point where XA's swing-leg retraces the 0.382 to 0.618 Fibonacci retracements.
The next rule of the Cypher pattern is a Fibonacci extension of the XA leg that comes in at 1.27, but it doesn't exceed the 1.414 Fibonacci ratios. This point of the move is labeled "C" and completes the BC swing-leg of the Cypher pattern. The final part of the Cypher pattern is where our orders will be executed. This is at the point D, which is located at the 0.786 Fibonacci retracements of the entire move started from X up to C.
How to Correctly Draw Cypher Pattern
1. The XA Move
The market creates an impulse/anchor leg when prices move a lot in a specific direction. This is the leg that is farthest away from the body. Once we know which direction we want to go, we can look for other things that need to be met in order to go that way.
2. The AB Move
After our initial move, we will look for price action to confirm our new position. If the candlestick matches the distance between the two legs by at least 38.2% then the move is considered valid. Price action does not have to close above the 38.2 be considered a valid.
The (B) leg of the trade is considered invalid if the price action does not hit a minimum of 38.2% of the original price of the (XA) move, or if it closes beyond the 61.8% retracement of the (XA) leg's original price.
3. The BC Move
Once we have met the requirements for step 2, we can look for the C leg. The market created a valid C leg by fulfilling at least a 127.2 extension of the (XA) leg. Price action also has to close above or below the previous (A) leg. This leg is invalid if it doesn't fulfill a 127.2 extension of (XA) or if it closes beyond a 141.4 extension of (XA).
4. Entry point
The market formed a successful entry point by following a 78.6% retracement of the previous move. The market forms a successful (D) completion point (entry) by fulfilling a 78.6 retracement of the (XC) move. For this completion to be valid, the (D) leg must exceed the (B) leg.
Take Profit, Stops, and Entries
Entry: The (D) completion point, which is the 78.6 retracement of the (XC) move, serves as the entry point for the Cypher pattern.
Stops: It is recommended to place stops 10 pip's beyond the (X) point.
TP1: The 38.2 retracement of the (CD) leg is the first target. If targets are met, then stops move to breakeven.
TP2: The (CD) leg's 61.8 retracement represents Target 2.
*Fibonacci retracements should be updated to the highest/lowest (D) point following entrance if price movement continues.
Examples
Conclusion
The Cypher trading strategy has a higher winning percentage than other harmonic patterns, but it's rare to see it appear on the chart. So, we need to take full advantage of the times it does show up.
STOCK MARKET AND FOREX CORRELATIONStocks and indices are often used for predicting the currency market. No wonder, in this world of trading, everything is interconnected in one way or another. There's a connection between stocks and currencies. Say, if you want to buy shares of a Japanese company on the Tokyo Stock Exchange, you can only do it in the local currency. As a result, your currency will have to be converted into yen (JPY), which naturally leads to an increased demand for it. The more stocks you buy on the Tokyo Stock Exchange, the more demand for the yen. Conversely, the more the currency is sold, for whatever purpose, the lower its value.
When a country's stock market seems attractive, they start flooding it with money. Conversely, if a country's stock market is in shambles, investors run from it headlong, looking for more attractive places to invest. If one country's stock market performs better than another, capital will flow from one country to the other. This will have an immediate effect on their currencies. Where the money is, the currency is stronger, where the stock market is weak, the national currency weakens.
A strong stock market causes a strong currency.
A weak stock market - a weak currency.
Key global indices
Let's take a look at the key world indices that interest us. As you will notice, many of them correlate and complement each other.
Dow Jones Index
The oldest and the most famous index in the world. There are actually several of them, but the most popular one is called the Dow Jones Industrial Average (DJIA).
It is the key U.S. stock index, which unites 30 companies with publicly available shares. By the way, despite the name, these companies are not particularly connected with the industry, because it is not in favor now. There are simply 30 of the largest companies in America.
This index is closely watched by investors around the world. It is a great indicator of the entire state of the U.S. economy, reacting to local and foreign economic and political events. The index tracks incredibly wealthy companies, you've heard of most of them. McDonald's, Intel, Apple are all in there.
S&P 500 Index
The Standard & Poor 500 Index, also known as the S&P 500, is one of the best-known indices on the planet. It is a weighted average price index of the 500 largest U.S. companies.
In fact, it is a key indicator of the entire U.S. economy and it is used to judge its performance. The S&P 500 Index (SPX) is the most traded index in the world after the Dow Jones Industrial Average.
Nikkei
The Nikkei index is like the Dow Jones Industrial Average, but for the Japanese. It averages the performance of the 225 largest companies in the Japanese stock market. Typical representatives of the Nikkei are Toyota, Mitsubishi, Fuji and others.
DAX
Deutscher Aktien Index is index of the German stock exchange, which includes 30 "blue chips" the largest companies whose shares are traded on the Frankfurt Stock Exchange. Germany is the most powerful economy in the EU, so if you are interested in the Euro, you should watch the DAX. The index includes companies like Adidas, Deutsche Bank, SAP, Daimler AG and Volkswagen.
EURO STOXX 50
The Dow Jones Euro Stoxx 50 Index is one of the key indices in the eurozone, reflecting the success of major EU companies. The index includes 50 companies from 12 EU countries.
FTSE
Financial Times Stock Exchange, also known as footsie, an index of the largest companies listed on the London Stock Exchange. There are several variations of it (which is often the case with indices). Let's say the FTSE 100 includes 100 companies and the FTSE 250, respectively, includes the 250 largest companies in the UK.
Hang Seng
The Hang Seng Index (HSI) for the Hong Kong Exchange shows changes in the prices of companies listed on the Hong Kong Exchange. The index includes the 50 largest companies with a capitalization of 58% of the total volume of the Stock Exchange.
The relationship between the stock market and the Forex
Now let's see if we should take all these indices into account when working with currency pairs. Of course, you should to determine general market trends at higher timeframes (remember multiframe analysis). In general, when the stock market is on the rise, investors are more willing to invest in it, buying the national currency. Which leads, of course, to its strengthening.
If, however, the stock market falls inconsolably, investors take their money, converting it back into their currency and the national currency weakens. However, there are two exceptions the U.S. and Japan. The economic growth of these countries often leads to the fact that their national currencies are weakening such a funny paradox, nevertheless, related to certain economic mechanisms. Let's look at how the Dow Jones Industrial Average interacts with the Nikkei.
As you can see, the DJIA and the Nikkei 225 are following each other. Moreover, sometimes the movement of one index anticipates the movement of the other, which allows you to use such a miniature time machine for making predictions.
Let's see other examples:
USD/JPY and DJI
USD/JPY and NI225
EURJPY and STOXX50
GBPJPY and FTSE100
Correlation can be regarded as an additional indicator of the global market trend. If the indicators of two interrelated assets diverge, it is much easier to determine the trends of each by methods of technical analysis. And you already know what to do with trend lines.
Let's look at some popular correlations between commodities and currency pairs.
Gold is up, the dollar is down. In economic crises, investors often buy gold for dollars, which is always up.
Gold up, AUD/USD up. Australia is the second largest supplier of gold in the world, so the Australian dollar exchange rate is in no small part related to the demand for gold.
Gold up, USD/CAD down. Canada is the 5th largest supplier of gold in the world. Therefore, if gold prices are going up, the USD/CAD pair is going down (because everybody is buying CAD).
Gold is up, EUR/USD is up. Both gold and the euro are considered the "anti-dollar". Therefore, an increase in the price of gold often leads to an increase in the EUR/USD exchange rate.
Oil is up; USD/CAD is down. Canada is the largest oil producer in the world, exporting more than 2 million barrels a day, mostly to the U.S. If oil goes up in price, the pair on the chart goes down.
Bond yields are up/the national currency is up. It is quite clear: the higher the interest rates state bonds, the more they are purchased for the national currency. As the demand for bonds goes up, the exchange rate goes up.
The DJIA is down, the Nikkei is down. The US and Japanese economies are very closely linked and go up as well as down.
Nikkei is down, USD/JPY is down. Investors often choose the yen as a "safe haven" in times of economic trouble.
The stock market, the state of which can be analyzed through indices, is directly correlated with currency pairs. Studying their interaction, you can often find situations when these data diverge so that one index acts as a "time machine" for the other. What is important is not only the correlation itself but also the fact that its polarity changes from positive to negative and vice versa.
CURRENCY CORRELATIONSCorrelation only shows exactly how two assets move in relation to each other. In the case of currency correlation, it is exactly the same story. Forex pairs can move together, in different directions, or not interact at all. Keep in mind that we are not trading just currencies, we are trading a currency pair where each participant in the pair influences the other. Therefore, correlation can be a useful tool, and almost the only one if you want to successfully trade several currency pairs at once.
Currency correlation is based on the so-called correlation coefficient, which is in a simple range between -1 and +1.
• Perfect positive correlation (coefficient of +1) means that two currency pairs move in the same direction 100% of the time.
• A perfect negative correlation (coefficient -1) implies exactly the opposite. Pairs constantly move in different directions.
If the correlation is 0, then there is no correlation at all, it is zero and the pairs are not related in any way.
The Risks of Currency Correlations
If you trade several currency pairs at once, you must realize at once how much such trading is exposed to risk. Sometimes people choose several pairs at once in order to minimize their risks, but they forget about the positive correlation, when pairs go in the same direction.
Let's assume that we took two pairs on the 4-hour timeframe, EUR/USD and GBP/USD. The correlation coefficient is 0.94, very nice. This means that both pairs are literally following each other.
If we open trades on both pairs, we thereby immediately double our position and the risks. They increase. Because if you are wrong with the forecast, you will be doubly wrong at once, because the pairs are mirrored.
You have put it up, the price went down, a double loss. So there is correlation. Also, it makes no sense to sell one instrument and buy another, because even with an accurate forecast one of them will bring you a loss.
The volatility also differs. One pair might jump 200 pips, while the other might jump only 180 pips. That's why it's necessary to play with simultaneous trades on different pairs very carefully and without fanaticism, the correlation decides everything here.
Now let's compare the opposite case, EUR/USD and USD/CHF. They have the opposite case, a strong inverse correlation, where the coefficient often reaches the absolute value of -1.00.
The pairs are like two magnets with opposite poles, constantly pushing away from each other. If you open opposite trades on two pairs with a negative correlation, it will be the same as two identical trades on pairs with a positive correlation, again doubling your risk. The most reasonable thing is definitely to work with only one pair and not to play with the opposite pair trades, because you can quickly reach ugly values.
Correlation coefficients
Now let's see how we can look at the correlation coefficients.
-1.0. Perfect inverse correlation.
-0.8. Very strong inverse correlation.
-0.6. Strong inverse correlation.
-0.4. Moderate inverse correlation.
-0.2. Weak inverse correlation
0. No correlation
0.2 Weak, slight correlation
0.4. Weak correlation
0.6. Moderate correlation
0.8. Strong correlation
1.0. Perfect correlation
So what to do with the correlation, can it be used or not?
1. Eliminate risk
If you like to open simultaneous trades on different pairs, knowing about their correlation will help you avoid getting into the described situation where you double your risk if two pairs go in the same direction. Or you bet in different directions, not realizing that the pairs have an inverse correlation and this again doubles your risk.
2. Doubling your profits or losses
If you decide to play with simultaneous trades on different pairs, a successful trade on pairs that have a direct correlation will double your profits. Or losses, of course, if something went wrong and the forecast was wrong.
3. Risk Diversification
Market risks can be divided into two currency pairs. If you certainly understand what you are doing and if the correlation between pairs is not perfect. To do so, we take pairs with a direct correlation around 0.7 (or higher), say EUR/USD and GBP/USD. Let's say you bet on USD going up. Instead of two bets on EUR/USD going down, you could bet on EUR/USD going down and GBP/USD going up. If the dollar falls, the euro will be less affected than the pound.
4. Risk Hedging
This method is already used in forex, where it is taken into account that each currency pair has its own pip value. If you have an upside position in EUR/USD and the price moves against you, a downside position in an opposite pair, such as USD/CHF, can help. You should not forget about the different pip value in forex. For example, the EUR/USD and USD/CHF have a nearly perfect correlation, except that when trading a $1000 mini lot, one pip of the EUR/USD costs $1, while USD/CHF costs $0.93. As a result, buying a EUR/USD minilot allows you to hedge your risks while simultaneously buying a USD/CHF minilot. If the EUR/USD falls 10 pips, you lose $10. However, the return on the USD/CHF will be $9.30. So instead of $10, you would only lose 70 cents, fine.
Hedging in forex looks great, but there are plenty of drawbacks as well. For when EUR/USD rises frantically, you simultaneously lose money on USD/CHF. Also, the correlation is rarely perfect, it's constantly floating, so instead of hedging you could lose everything.
5. Correlation, Breakouts and False Breaks
Correlation can also be used to predict price behavior at significant levels. Let's assume that the EUR/USD is testing a significant support level. We have studied it and decided to enter upon its breakout. Since EUR/USD is positively correlated with GBP/USD and negatively correlated with USD/CHF and USD/JPY, we should check if the other three pairs are moving in the same volatility as EUR/USD.
Most likely, GBP/USD is also near resistance levels, and USD/CHF and USD/JPY are near key resistance levels too. All this means that the USD move the market and there are all the indications for a breakout of the EUR/USD, because all the three pairs are moving synchronously. We have to wait for the breakout.
And now let's assume that these three pairs do not move synchronously with EUR/USD. GBP/USD has no intention to fall, USD/JPY does not increase, and USD/CHF does not show any signs of sideways movement. What does this mean? The only thing that the fall of EUR/USD is not connected with the dollar and is obviously caused by negative news from the Eurozone.
The price can be below the key support level, but if the three correlated pairs do not move synchronously enough with EUR/USD, we should not expect a breakout. Moreover, it can be a false break of resistance.
Yes, you can still enter the breakout without a correlation confirmation, but then make a smaller trade volume, because you need to reduce your risks.
Correlation: pros and cons
Here everything is obvious. The cons are your risks are doubled if you open trades for two mirrored correlated pairs. In addition, the correlation changes regularly at different time intervals, which should be taken into account in your work. The pros are correlation allows you to diversify risks, hedge your trades.
Also remember that:
ratios are calculated based on daily closing prices;
a positive coefficient means that two pairs move in the same direction;
negative in opposite directions;
the closer the coefficient is to values +1 and -1, the stronger the correlation.
Examples of pairs that move synchronously:
EUR/USD and GBP/USD;
EUR/USD and AUD/USD;
EUR/USD and NZD/USD;
USD/CHF and USD/JPY;
AUD/USD and NZD/USD.
Pairs with negative correlation:
EUR/USD and USD/CHF;
GBP/USD and USD/JPY;
USD/CAD and AUD/USD;
USD/JPY and AUD/USD;
GBP/USD and USD/CHF.
Do not forget to use all that you have learned, keep in mind the risk management, and then the currency pairs correlation may become a valuable tool in your trading arsenal. And most importantly, it will allow you to avoid mistakes when you trade two pairs at once and don't even realize that you are doubling your risks if there is a complete synchronous correlation between the selected pairs.
FACTORS THAT PUSH THE PRICEHello everybody!
Today I want to discuss with you a serious question - What factors are pushing the price?
As you know, there is fundamental and technical analysis.
Each trader himself gives preference to what to use in the analysis.
And we will try to understand what pushes the price.
NEWS
The first thing that comes to mind is NEWS .
News affects OUR WHOLE LIFE .
The news pushes crowds of people to one point and forces them to flee from another.
News is a strong factor.
If the central bank decides something, it will be in the news and it will definitely push the market.
If the president of the country has decided something, it is shown on the news and it pushes the market.
If a person who decided the fate of an entire industry was fired, it will push the market and the price.
Therefore, it is IMPORTANT to follow the news and, more importantly, correctly interpret the news and be able to predict the future mood and future actions of the crowd based on them.
PATTERNS
All traders see the same chart, but everyone perceives it differently.
There are many reasons for this: someone knows more patterns, someone has more experience, someone understands better than another, someone has better discipline.
And when one or another pattern appears on the chart, people start trading and push the price.
You may have noticed that if no special picture is visible on the market, then the market is sluggish.
As soon as a pattern emerges, movement begins.
People entered the market.
Can we say that patterns move the price?
Or maybe someone is creating patterns on the chart to move the price?
EMOTIONS
We have already touched on this topic above, but it is worth noting separately.
Emotions play an important role in everything.
If the crowd is happy, the market is growing.
The crowd is afraid - the market is falling.
The crowd can be angry at the company or the country, close positions and thereby push the price down because of their bias..
The one who knows how to understand other people's emotions is able to predict the future actions of the crowd and make money on it.
Think about it...
SUPPLY AND DEMAND
Classical works on economics teach us that the market is controlled by supply and demand.
more precisely, the difference between supply and demand.
If the demand is large, the price rises, if the demand is small, the price falls.
The logic is simple: if people buy a lot, someone will start raising the price before selling, why not, because people buy.
When people don't want to buy, the one who needs to sell will lower the price to lure the buyer, because you need to sell something.
At the same time, it is important that there should always be both a buyer and a seller, otherwise the price will stand still or move slowly.
When there is both a buyer and a seller on the market and a lot of transactions are made, the price moves quickly, volumes increase, so even strong jumps (GAPS) are possible.
MANIPULATION
Manipulation is the darkest, most hidden action from prying eyes.
No one can say for sure whether it was manipulation or not.
Can someone push the market?
You often observe that the price reaches your stop, after which it immediately goes in the right direction, but without you.
Many traders believe that manipulation can be observed in the market .
Someone thinks that every movement is manipulation.
What do you think?
Traders, if you liked this idea or if you have your own opinion about it, write in the comments. I will be glad 👩💻
Why Is The Price Reversing After Hitting Stop Loss?Hello, my fellow Forex traders!
Today we will discuss one, one might say, rhetorical question that often arises among beginners and quite experienced traders. This question is as follows: "Why, as soon as my stop is hit, the price reverses?"
Why does it happen? Does the market see where you put your orders and why does it kick them out to spite you, immediately reversing in the original direction? Let's try to figure out what is the prerequisite for this situation, where most market participants put their stop losses, what to do about it and how to deal with it.
The basic idea
Let's assume you have detected the " Engulfing" pattern on the chart and concluded that the price will go up in the future. It does not matter whether the signal was shown by the indicator or the trading system. The question is, where would you place a stop loss here? Most likely, either under the candlestick or near the last local low.
Everything seems to be fine, but then the price knocks out your stop loss and goes, as expected, up. I think you can give many such examples from your own practice or from observations of other traders.
Why does this happen?
The fact is that in addition to other traders like you and me, there are big players in the market: hedge funds, banks, various institutional investors. They open rather large positions, i.e. positions of very large volume, for opening which they need a sufficient level of liquidity.
If one tries to open such a position in the middle of a trend, high volume can move the price in the direction of the position, but after that the price is likely to roll back leaving the trader at a disadvantage.
Imagine this if you, for example, come to the market to buy potatoes, but not 1 kilogram, but a whole truck. It would seem that you should get a more favorable price as a wholesale buyer, but in fact the more favorable price will be received by the one, who came to buy 1 kg.
So, the big players have to cheat and look for places with a lot of liquidity to sell in order to buy profitably and vice versa. Actually, your stop-loss for a buy position is nothing but a sell order. Accordingly, it is profitable for a large player to take exactly this liquidity in the form of stop-loss and pending sell stop orders, and thus gain his own position without moving the market price much.
You're probably wondering how such a big player could be interested in such small positions. But the fact is that approximately 95% of traders place orders in approximately the same places. Accordingly, since people think alike, the big players don't need to see all the insider information about exactly where your stop loss is, it's obvious enough. After the liquidity has been absorbed, the market goes in its own direction, but without you.
Most market participants place their stop losses at one of these locations:
Local lows/highs;
Support/resistance levels;
Round levels;
Borders of channels, rectangles and other consolidation patterns.
Where do I place a stop loss?
1) The first thing that comes to mind is not to put a stop in principle, no stop - no problem. However, this practice will not suit everyone. If you are new to the market, it is dangerous to work without a stop-loss, that is, to keep it in mind, or to use a virtual one without placing it directly in the market, and such practice often leads to large losses or loss of the entire deposit.
2) Some use various technical tricks, applying the so-called virtual stop-loss. That is, the order will be closed, but it will be closed by an Expert Advisor, not by an automatic market order. But, in fact, it does not matter whether the stop is in the market or not the behavior of the big players will not change from this.
3) The next logical solution is to put a stop loss with a larger margin (at a farther distance). This solution is not the worst and has the right to live. The reserve, however, should not be too large, otherwise you just increase the risk for nothing. This option will not help in all cases, but in general it is not a bad compromise.
4) The opposite solution a very short stop. If it is hit, you can not worry too much and then re-enter the market. This solution also has the right to life, but most often it implies a re-entry. At the same time, if the stop was hit, you need to understand why it happened, and only after analyzing the situation, enter for the second time.
5) You can enter in the same way after a false-break. If you have received confirmation of a false-break, it is possible to use this situation to your own advantage. That is, to enter the market, when the stops of other participants have been knocked out.
6) To calculate the size of a stop loss, you can use not only the chart itself, but also other tools such as the ATR indicator. The ATR readings are usually multiplied by a multiplier, such as 2 or 3. In this case, we have a daily chart and the ATR values are large enough, so a multiplier of 2 will be sufficient. The indicator shows 112 points, so we set a stop loss at a distance of 224 points (112 * 2) from the entry point. In general, as the tests show, this is probably one of the most correct ways to set a stop loss.
Conclusion
You are free to apply any of the listed solutions. Perhaps you will find your own solution to the problem some use fibo, some use ATR. The best solution is the Average True Range indicator. This is a sure way to avoid frequent stop triggering situations with a subsequent price reversal. The main thing is try to think differently than everyone else, keep in mind the big players and their methods of position taking and you will be fine!
HOW THE INTEREST RATE AFFECTS THE FOREXGood day, fellow traders!
The topic of interest rates often appears on the agenda of various media and many are aware that it is closely connected with the global economy and finance and somehow affects the processes taking place in the foreign exchange markets. But what do interest rates really mean and why do they influence Forex trends?
The interest rate is the rate at which the central bank lends to commercial banks. They, in turn, lend to commercial companies based on this official rate. If the rates are high, then the loans are more expensive and so are the goods on the markets, and therefore less competitive. The demand for loans falls, inflation slows down and, consequently, the currency becomes more expensive.
Conversely, if rates are low, then commercial banks and then companies take loans at lower interest rates (sometimes negative), which allows you to sell goods cheaper, the Central Bank prints more money and inflation accelerates the currency becomes cheaper.
Monetary policy: why and how rates are regulated
Rates can be high or low. However, these values are always relative, so it is important to consider the historical trend and the rise/decline in relation to their own historical values.
The central bank raises the rate to prevent the economy from overheating. This happens when there is no room for growth in the economy and prices begin to rise outside of real increases in the production of goods and services, which leads to accelerated inflation and a depreciation in the trade rate of the currency.
A rate hike slows inflation and makes the currency more attractive in the eyes of investors, and commercial banks deposit investor funds at a higher interest rate. In contrast, a rate cut is stimulative and serves to accelerate economic processes, cheap credit for business, low taxes, lower unemployment, and increase business activity. This accelerates inflation and lowers the trade rate of the currency.
When and how often interest rates are changed
Central banks independently determine the timing of interest rate reviews. In the U.S., for example, rates are regulated by the Federal Open Market Committee (FOMC). And needless to say, the whole world is watching their meetings. Usually, special committees of national central banks adopt a particular monetary rate at the beginning of the fiscal year, but, if necessary, they can change it later.
In the EU, the refinancing rate is regulated by the European Central Bank. In the United Kingdom, it is the Bank of England. In Japan it is the Bank of Japan and so on. The markets also take into account the rates of Switzerland, Canada, RBA, Norway, China, India, Korea and some European countries such as France, Italy, Germany, Spain and others.
What happens in the forex market?
If you opened the economic calendar and found that the officials of a national Central Bank are meeting to decide on interest rates then the rates may change and change the trend, depending on whether they are going down or up.
Or rates can remain at the same level, and then the trend will be determined on the basis of the current dynamics: if last time rates were cut then the trend will be bearish, and if they were raised it will be bullish.
As a rule, the prospects for rising or falling rates are repeatedly announced for a long period before they are changed. Long-term investors and position traders take advantage of this to take profits or to avoid risks.
Conclusion
• Watching interest rates is important to understand the global currency trend;
• A decrease in interest rates stimulates the economy and an increase in interest rates cools economic growth;
• If interest rates rise, the currency strengthens; if they fall, it weakens.
FALSE BREAKOUTHow predict a false breakout?
Predicting a false or true breakout is complicated by the fact that the currency rate takes into account everything. The release of news or any unforeseen events, or insider information can make big traders give up their intentions to reverse price or breakout levels.
In most cases currency rates behavior near important lines will show if the breakout is true or false. High volatility is associated with the actions of a large trader, who is "pushing through" the currency rate in order to gather stop-losses and reverse quotes. High volatility and large candles on the approach to the level is a sign of an upcoming false-break.
A true breakout is defined by low volatility, especially in case of a sharp transition to a sideways trend after a strong trend. The phenomenon of volatility narrowing before the resumption of a trend movement is described in details in the literature and in the strategies of various indicators.
False breakdouts usually occur when market volatility is low you will notice that the range of candles becomes small.
False Breakdown Trading Strategies
If we talk about the general approach to strategies for catching reversals from important levels, it is worth highlighting two tactical techniques.
1. Entry after the price returns beyond the key level
The first one is aggressive and the most efficient way to enter by pending order, which is executed after the candle closes behind the level. The break in the resistance level gives the opportunity to place the Sell Stop. The indent of the pending order may be larger or smaller depending on the pair type, timeframe and volatility.
The order will be triggered only upon reversal of prices. The trader should protect the trade with a stop loss, which is placed behind the maximum of a false breakout. Take Profit can be set at the closest support level if the situation with a false breakdown is considered in the growth of the currency market.
In case of the fall the trader places the Buy Stop order. The size of the stop loss is determined by the minimum of a false breakdown candle. After the rebound and the activation of the order, it is necessary to set a take profit at the nearest resistance.
The trader should understand that high volatility is able to activate the pending order without the long tail of the candle and continue the trend movement in the direction of the breakout. Quotes may also fail to reach the take because of low liquidity or an incorrectly chosen level. However, in general, a false breakout is a profitable strategy and can be explained by the logic of the market.
So, the rules in brief:
- After the formation of a breakout level, which we consider to be false, we place a pending Sell Stop order slightly below the level that was broken through;
- We set a Stop Loss order for the maximum of a false breakout;
- Take Profit to the nearest opposite level.
For sell trades, everything is the same.
2. Waiting for a pullback to the key level.
The second method is more conservative, as it requires waiting for a false breakout signal. The tactics requires to wait not only for the quotes return after the price has passed the level, but also for the first correction. This pullback should confirm the resistance/support and breakout falsity.
Once this confirmation is obtained, the trader can enter using a pending order or the market, placing a stop loss after the breakout candlestick and take the order at the nearest support/resistance. The trading tactics in this case does not differ from the considered plan of actions in the first example.
Conclusion
The mechanism of a false-break involves the removal of stop-losses of most traders, which increases the probability of a rebound, i.e. the profit of the trader who caught the reversal. In this case, the first method, aggressive trading, is more justified.
As with any strategy, breakout trading requires the user to fine-tune the strategy by adding additional indicators, testing indents for placing pending orders, developing methods for determining resistance and support lines.
TRADE FROM ACCUMULATION ZONESHello everyone!
Today I want to analyze a very useful topic - how to trade from accumulation zones .
Accumulation
Surely you have noticed that the price first makes an impulse, then stops, after which it makes an impulse again.
This is the simplest scheme of price movement.
Each stage can be disassembled and a good trader should be able to trade at each stage.
Accumulation is the stage at which the price moves sideways, that is, accumulates.
This stage exists due to the fact that the price cannot constantly move up or down, there are moments when the strength of sellers or buyers ends and you need to take a break, gain a new position and push the price.
Trading is possible inside the accumulation, but using a different technique, today we will discuss how to trade when the price has left the accumulation zone.
beginning
First , you should note the resistance and support levels between which the price moves in the accumulation zone.
They are usually easy to identify.
If you can't identify them, don't trade, wait for a situation that will be clear to you.
Exit
At the moment when the price goes beyond the accumulation limits, we start looking for an entry point.
Most often, if the price has broken through the accumulation zone down, the price will continue to go down.
But there are times when the price makes a false breakout and goes in the other direction.
Such moments occur and you should not forget about them.
It is impossible to always know where the price will go.
If the price has broken through the zone down, you can go straight into the short - it will be an aggressive entry.
It is aggressive because there is a possibility that this is a false breakdown and the price will go further up.
A conservative entry will be when the price rolls back to the zone and begins a reversal from it.
A reversal means that the price cannot go higher back into the zone and will fall down.
Similarly, long trades are opened only in the other direction.
As you can see on the chart, accumulation zones appear not only during the reversal, but also during the continuation of the trend.
In situations where the price after the accumulation zone went further towards the previous trend, it means that the trend is strong enough, although there was resistance on the other side.
Positions are always opened the same way:
1. Identify the area of the field.
2. Waiting for the breakdown.
3. Looking for an entry point (aggressive entry or conservative).
This technique is very simple and it works quite well .
The main thing is to follow the rules and don't risk too much.
In addition, the direction on the higher timeframe is important.
And don't forget the most important rule: the trend is your friend .
Thanks!
Traders, if you liked this idea or if you have your own opinion about it, write in the comments. I will be glad 👩💻
8 Easy and Effective Ways to Improve Intellectual PerformanceToday we are going to talk about personal effectiveness. Have you ever noticed that as you get older, it becomes more and more difficult to concentrate, study large amounts of information, evaluate variants of events, etc.? And in trading it is impossible to do without it. And not only at Forex, but also in real life. The 21st century is the century of information. I will share with you ten simple and effective ways to increase mental performance, and you can implement them today. Without too much effort.
1 Start the day with physical activity
This is the hardest to follow of the tips presented here. But it works. Physical activity first thing in the morning, on an empty stomach, helps to get the blood and oxygen flowing through your body. As a result, you have clarity of thought during the day, it is easier to concentrate, and the work goes easier. What kinds of activities? It's up to you. I practice yoga in a light form, someone runs, someone swims, someone can do physical exercises, even a short walk will do. The main condition is that your "warm-up" should be at least 15-20 minutes.
2 Make a to-do list
Make a list of ABSOLUTELY all the things you have to do. Not just work stuff, but plans like: go out, buy something, go on a summer vacation, change the tires on your car, walk your dog, read a book called Think and Get Rich. In short, absolutely ALL things to do.
3 Take a break every hour
The human brain is built in such a way that for about 20 minutes it speeds up, adjusts to the task. At the 30th minute it reaches the peak of activity, and then there is a decline. After 40-50 minutes of intellectual work, the body needs to rest. You have probably noticed yourself how after an hour of work there is a "dullness. This is a sure sign that you need a break. So, do not give your body too much stress, take a break every hour. 10 minutes is just enough time to recover and get back to work. During the break you can relax by lying on the couch, play some simple game, like on the phone, or give yourself a little physical workout.
4 Drink water
Continuing the topic of how our brain works, it is worth mentioning that it needs “moisture” to function properly. Insufficient supply of water to the brain is another cause of dullness. Don't let your head go dry. Drink a glass of clean water every 2 hours. Not coffee, not tea, but just water.
5 Four hours per day to work
This may sound like an excuse for laziness, but there have been studies in which scientists have found that a person can PRODUCTIVELY work intellectually for no more than 4 hours a day. Meaning pure working time, minus breaks and interruptions. Of course, a person can work more hours, but after 4 hours the productivity and quality of intellectual activity drops significantly. Therefore, if possible, try to work less time, but more productively as a result.
6 A daytime nap is useful
It is no wonder that kids in kindergarten are put to bed in the afternoon. A nap during the day is very good for the body. Google even has special pods in its offices where employees can take an hour nap. If possible, try to give yourself an hour after lunch for a nap. After you wake up, you will get a lot more done than if you had worked without a break.
7 Walk
Studies have found that people who walked 1-2 km a day worked much better than those who neglected walking. Richard Bach, the famous esoteric writer, also mentions in one of his books about the "Walking Fairy". As you know, ideas often come up while walking, Bach personified their appearance in the form of the Fairy, who gives you new thoughts as you walk down the street.
8 Don't drink too much alcohol
The advice is obvious, but relevant. Systematic alcohol consumption destroys the hippocampus, the part of the brain responsible for memory, orientation in space, its destruction can even lead to Alzheimer's disease. You do not want to become an idiot, requiring the constant supervision of doctors? But if you want to drink, drink it in moderation.