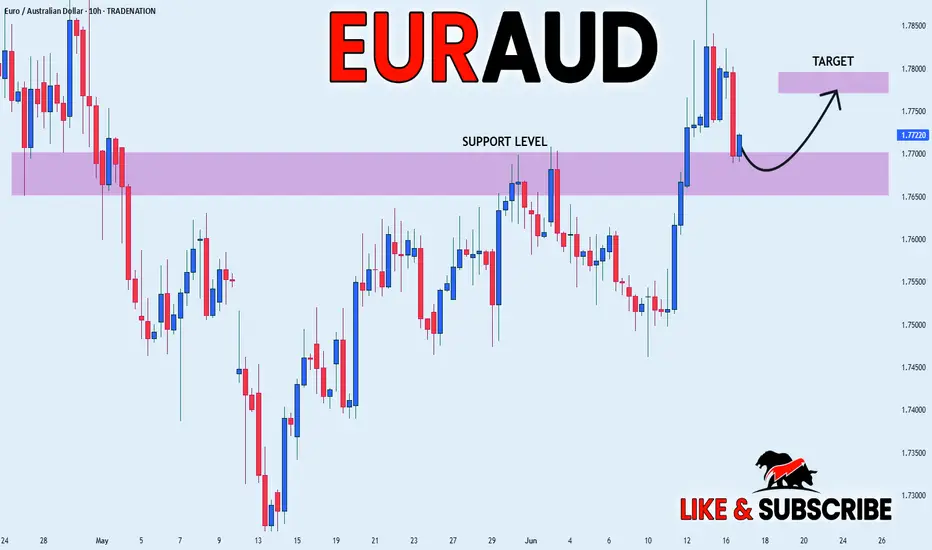
EUR_AUD WILL GROW|LONG|
✅EUR_AUD went down to retest
A horizontal support of 1.7572
Which makes me locally bullish biased
And I think that a move up
From the level is to be expected
Towards the target above at 1.7800
LONG🚀
✅Like and subscribe to never miss a new idea!✅
Disclosure: I am part of Trade Nation's Influencer program and receive a monthly fee for using their TradingView charts in my analysis.
Forex-trading
EUR-CHF Resistance Ahead! Sell!
Hello,Traders!
EUR-CHF keeps growing
But a strong horizontal
Resistance of 0.9445
Is ahead so after the
Retest we will be expecting
A local bearish move down
Sell!
Comment and subscribe to help us grow!
Check out other forecasts below too!
Disclosure: I am part of Trade Nation's Influencer program and receive a monthly fee for using their TradingView charts in my analysis.

CAD-CHF Potential Short! Sell!
Hello,Traders!
CAD-CHF made a retest
Of the horizontal resistance
Of 0.5990 and pullback is
Already happening so we are
Locally bearish biased and
We will be expecting a
Further bearish move down
Sell!
Comment and subscribe to help us grow!
Check out other forecasts below too!
Disclosure: I am part of Trade Nation's Influencer program and receive a monthly fee for using their TradingView charts in my analysis.

AUD_JPY MOVE DOWN AHEAD|SHORT|
✅AUD_JPY made a retest of
The strong horizontal resistance of 93.900
Level of 106.083 and as you
Can see the pair is already
Making a local pullback from
The level which sends a clear
Bearish signal to us therefore
We will be expecting a
Further bearish correction
SHORT🔥
✅Like and subscribe to never miss a new idea!✅
Disclosure: I am part of Trade Nation's Influencer program and receive a monthly fee for using their TradingView charts in my analysis.

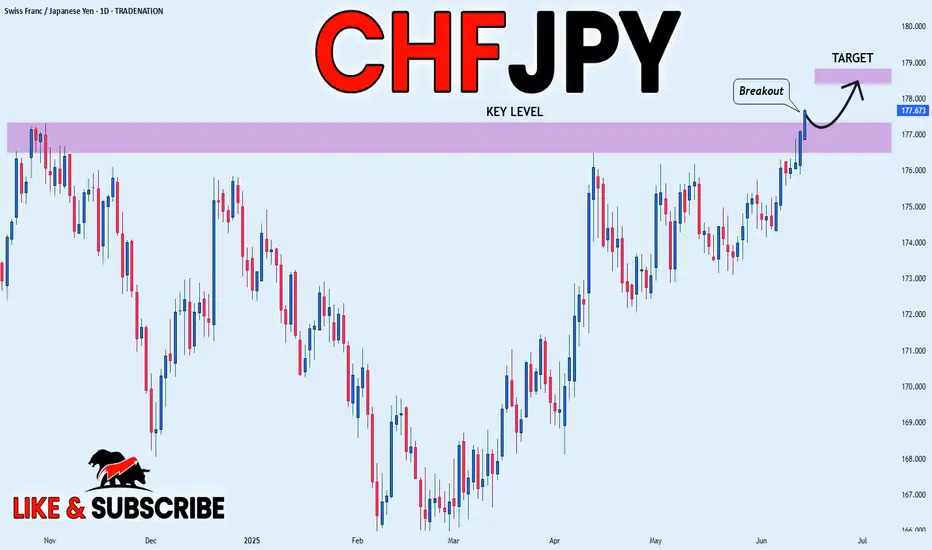
CHF-JPY Will Keep Growing! Buy!
Hello,Traders!
CHF-JPY made a bullish
Breakout of the key horizontal
Level of 177.327 and the
Breakout is confirmed so
We are bullish biased
And we will be expecting
A further bullish continuation
Buy!
Comment and subscribe to help us grow!
Check out other forecasts below too!
Disclosure: I am part of Trade Nation's Influencer program and receive a monthly fee for using their TradingView charts in my analysis.

AUD-CHF Pullback Ahead! Sell!
Hello,Traders!
AUD-CHF made a retest
Of the strong wide horizontal
Resistance around 0.5289
And we are already seeing a
Local pullback so we are
Locally bearish biased and
We will be expecting a
Further bearish move down
On Monday
Sell!
Comment and subscribe to help us grow!
Check out other forecasts below too!
Disclosure: I am part of Trade Nation's Influencer program and receive a monthly fee for using their TradingView charts in my analysis.

NZD_CAD REBOUND AHEAD|LONG|
✅NZD_CAD is set to retest a
Strong support level below at 0.8160
After trading in a local downtrend for some time
Which makes a bullish rebound a likely scenario
With the target being a local resistance above at 0.8182
LONG🚀
✅Like and subscribe to never miss a new idea!✅
Disclosure: I am part of Trade Nation's Influencer program and receive a monthly fee for using their TradingView charts in my analysis.

CAD_CHF SHORT FROM RESISTANCE|
✅CAD_CHF has retested a key resistance level of 0.5990
And as the pair is already making a bearish pullback
A move down to retest the demand level below at 0.5960 is likely
SHORT🔥
✅Like and subscribe to never miss a new idea!✅
Disclosure: I am part of Trade Nation's Influencer program and receive a monthly fee for using their TradingView charts in my analysis.

NZD-CAD Free Signal! Buy!
Hello,Traders!
NZD-CAD is about to retest
A horizontal support level
Of 0.8161 from where we
Will be expecting a local
Bullish rebound so we can
Enter a long trade with the
Take Profit of 0.8191 and
The Stop Loss of 0.8153
Buy!
Comment and subscribe to help us grow!
Check out other forecasts below too!
Disclosure: I am part of Trade Nation's Influencer program and receive a monthly fee for using their TradingView charts in my analysis.

GBPCHF Breaks Rising Wedge – Reversal Targets 1.0940 and 1.0815GBPCHF has broken down from a rising wedge formation on the 4H chart, signaling a shift from bullish momentum to bearish control. The pattern break comes near the 50% retracement level, with price now trading below ascending trendline support. With fundamental headwinds weighing on the British pound and safe-haven demand supporting the Swiss franc, the setup favors a short bias targeting the 1.0940 and 1.0815 zones.
🔍 Technical Analysis
Pattern: Rising wedge → broken to the downside
Breakout Confirmation: Price has closed below the wedge support (trendline)
Key Support Levels:
1.0940 → 38.2% fib + previous structure support
1.0815 → 23.6% fib retracement + horizontal support zone
1.0608 → Full wedge base (longer-term target)
Resistance / Invalidation:
1.1150 – a close back above this level invalidates the breakdown
Candle Behavior:
Bearish structure forming with lower highs
Clean engulfing candle closed below wedge
📉 Bias: Bearish (confirmed technical reversal)
🌍 Fundamental Context
🇬🇧 British Pound (GBP)
UK CPI expected to rise (3.3% forecast), which may limit BoE cuts, but not bullish enough to support GBP
Political uncertainty resurfaces (Labour slipping in polls)
BoE speakers are split; no clear support from policy
🇨🇭 Swiss Franc (CHF)
Safe-haven flows rising on:
Global growth slowdown
Tensions between U.S.–Iran
Downgrade of U.S. debt → risk aversion favors CHF
SNB remains cautious, but CHF gains defensive strength in risk-off conditions
🎯 Trade Setup
Bias: Sell
Entry Zone: 1.1080–1.1100 (breakout confirmation)
Targets:
TP1: 1.0940
TP2: 1.0815
TP3: 1.0608 (extension target)
Stop Loss: Above 1.1150
⚠️ Risk Factors
CPI surprise tomorrow could cause GBP spikes — be cautious around the release
If equities rally hard or CHF weakens globally, price could retest the wedge structure before falling
BoE hawkish surprise could challenge short-term bearish bias
🧭 Conclusion
GBP/CHF has broken out of a rising wedge — a classic bearish reversal signal. The technical break aligns with macro weakness in GBP and CHF strength in a risk-off environment. Short trades remain valid below 1.1150, targeting a drop to 1.0940 and 1.0815 in the coming sessions.

GBPUSD: Your Trading Plan For Next Week 🇬🇧🇺🇸
GBPUSD formed an ascending triangle pattern on a daily time frame.
Your next signal to buy will be a bullish violation of its neckline.
To confirm a breakout, we will need a daily candle close above 1.362.
A bullish continuation will be expected to 1.37 level then.
❤️Please, support my work with like, thank you!❤️
I am part of Trade Nation's Influencer program and receive a monthly fee for using their TradingView charts in my analysis.

AUD_CHF LOCAL SHORT|
✅AUD_CHF has retested a resistance level of 0.5290
And we are seeing a bearish reaction
With the price going down but we need
To wait for a confirmation
Before entering the trade, so that we
Get a higher success probability of the trade
SHORT🔥
✅Like and subscribe to never miss a new idea!✅
Disclosure: I am part of Trade Nation's Influencer program and receive a monthly fee for using their TradingView charts in my analysis.

CHF_JPY BULLISH BREAKOUT|LONG|
✅CHF_JPY is going up
Now and the pair made a bullish
Breakout of the key horizontal
Level of 177.000 and the breakout
Is confirmed so we are bullish
Biased and we will be expecting
A further bullish move up
On Monday
LONG🚀
✅Like and subscribe to never miss a new idea!✅
Disclosure: I am part of Trade Nation's Influencer program and receive a monthly fee for using their TradingView charts in my analysis.
AUD-JPY Will Go Down! Sell!
Hello,Traders!
AUD-JPY made a retest
A wide horizontal resistance
Around 93.900 from where
We are already seeing a
Local bearish pullback so
We will be expecting
A further bearish move
Down on Monday
Sell!
Comment and subscribe to help us grow!
Check out other forecasts below too!
Disclosure: I am part of Trade Nation's Influencer program and receive a monthly fee for using their TradingView charts in my analysis.

CAD-JPY Free Signal! Sell!
Hello,Traders!
CAD-JPY went up sharply
But the pair failed to break
A strong horizontal resistance
Of 106.266 from where we
Can enter a short trade with
The Take Profit of 105.768
And the Stop Loss of 106.326
Sell!
Comment and subscribe to help us grow!
Check out other forecasts below too!
Disclosure: I am part of Trade Nation's Influencer program and receive a monthly fee for using their TradingView charts in my analysis.

GBP_JPY LOCAL SHORT|
✅GBP_JPY has been growing recently
And the pair seems locally overbought
So as the pair is approaching a horizontal resistance of 196.400
Price decline is to be expected
SHORT🔥
✅Like and subscribe to never miss a new idea!✅
Disclosure: I am part of Trade Nation's Influencer program and receive a monthly fee for using their TradingView charts in my analysis.

GBP_CHF RESISTANCE AHEAD|SHORT|
✅GBP_CHF is going up now
But a strong resistance level is ahead at 1.1070
Thus I am expecting a pullback
And a move down towards the target of 1.1013
SHORT🔥
✅Like and subscribe to never miss a new idea!✅
Disclosure: I am part of Trade Nation's Influencer program and receive a monthly fee for using their TradingView charts in my analysis.

EUR-CAD An Interesting Setup! Buy!
Hello,Traders!
EUR-CAD is trading in an
Uptrend along the rising
Support which now
Confluences with the falling
Support line as well so as the
Pair was making a bearish
Correction we will be expecting
A bullish rebound from the
Confluence area and a further
Bullish move up
Sell!
Comment and subscribe to help us grow!
Check out other forecasts below too!
Disclosure: I am part of Trade Nation's Influencer program and receive a monthly fee for using their TradingView charts in my analysis.

EUR-NZD Potential Short! Sell!
Hello,Traders!
EUR-NZD is going up
Just as we predicted but
The pair will soon hit a
Horizontal resistance
Of 1.9287 from where
We will be expecting a
Local pullback and a
Move down
Sell!
Comment and subscribe to help us grow!
Check out other forecasts below too!
Disclosure: I am part of Trade Nation's Influencer program and receive a monthly fee for using their TradingView charts in my analysis.

USOIL || Geopolitical Spike Hits Major Resistance - Watch $77.77🛢️
📅 June 13, 2025
👤 By: MJTRADING
🔍 🧭 Fundamental Context – Risk Premium on the Rise:
Crude oil surged sharply today following reports of Israeli airstrikes on Iranian territory — a move that reawakens fears of broader Middle East escalation. Iran plays a crucial role in OPEC and controls the strategic Strait of Hormuz , through which ~20% of global oil passes.
While Iran has not officially responded yet, markets are pricing in the potential for:
* Military retaliation
* Disruption of oil exports or maritime routes
* Heightened volatility across global risk assets
=======================================================
📉 📊 Technical Structure – Tag of Key Resistance at $77.7:
Price exploded upward, piercing the descending channel that's been intact since mid-2022.
Today's daily wick tagged the $77.70 level, a major horizontal resistance and channel top.
This zone has repeatedly acted as a pivot in both bullish and bearish phases.
Volume confirmed the move – highest daily volume in months, suggesting institutional reaction.
💡 Trading Outlook:
🔼 Scenario A – Breakout & Close Above $77.7 = Bull Continuation
If tomorrow closes firmly above $77.70:
Target 1: $88.88 supply zone
Target 2: $90.00 psychological resistance
Setup: Conservative entries on retest of $75–77 area with tight invalidation
🔽 Scenario B – Failed Breakout → Fade Back Inside Channel
If this was a headline-driven spike with no follow-through, bears may re-enter strongly
A close below $75 could confirm bull trap
Support zone to watch: $66.66 (mid-channel, EMA confluence)
⚠️ Risk Factors to Monitor:
Iran’s response (military, diplomatic, strategic)
US/NATO reaction to potential escalation
Strait of Hormuz disruption
OPEC commentary or Saudi-led output adjustment
Market sentiment unwind (profit-taking from overbought spike)
💬 Markets love emotion, but traders survive with structure. This is not the time to be reckless — size down, be responsive, and respect both breakouts and fakeouts.
📎 #CrudeOil #Geopolitics #OilSpike #WTI #MiddleEastTensions #Iran #IranIsrael #TechnicalAnalysis #MJTRADING

CAD_CHF STRONG SUPPORT AHEAD|LONG|
✅CAD_CHF will be retesting a support
Level soon around 0.5920
From where I am expecting a bullish reaction
With the price going up but we need
To wait for a reversal pattern to form
Before entering the trade, so that we
Get a higher success probability of the trade
LONG🚀
✅Like and subscribe to never miss a new idea!✅
Disclosure: I am part of Trade Nation's Influencer program and receive a monthly fee for using their TradingView charts in my analysis.

AUD-CHF Free Signal! Buy!
Hello,Traders!
AUD-CHF fell down sharply
But the pair will soon hit a
Horizontal support level
Of 0.5281 from where we
Can go long with the
Take Profit of 0.5312
And the Stop Loss of 0.5273
Buy!
Comment and subscribe to help us grow!
Check out other forecasts below too!
Disclosure: I am part of Trade Nation's Influencer program and receive a monthly fee for using their TradingView charts in my analysis.

NZD_JPY WILL KEEP GROWING|LONG|
✅NZD_JPY is trading along
The rising support line
And as the pair is going up now
After the retest of the line
I am expecting the price to keep growing
To retest the supply levels above at 87.429
LONG🚀
✅Like and subscribe to never miss a new idea!✅
Disclosure: I am part of Trade Nation's Influencer program and receive a monthly fee for using their TradingView charts in my analysis.
