GBP-NZD Resistance Ahead! Sell!
Hello,Traders!
GBP-NZD keeps growing
But the pair will soon hit
A horizontal resistance
Level above at 2.2540
So after the retest we
Will be expecting a
Local bearish pullback
Sell!
Comment and subscribe to help us grow!
Check out other forecasts below too!
Disclosure: I am part of Trade Nation's Influencer program and receive a monthly fee for using their TradingView charts in my analysis.
Forex-trading

EUR_CAD LOCAL SHORT|
✅EUR_CAD is going up now
But a strong resistance level is ahead at 1.5760
Thus I am expecting a pullback
And a move down towards the target of 1.5660
SHORT🔥
✅Like and subscribe to never miss a new idea!✅
Disclosure: I am part of Trade Nation's Influencer program and receive a monthly fee for using their TradingView charts in my analysis.

EUR-JPY Pullback Ahead! Sell!
Hello,Traders!
EUR-JPY keeps growing
Just as I predicted in my
Previous analysis and the
Pair is locally overbought
So after the pair hits the
Horizontal resistance above
At 166.715 we will be
Expecting a local pullback
And a bearish correction
Sell!
Comment and subscribe to help us grow!
Check out other forecasts below too!
Disclosure: I am part of Trade Nation's Influencer program and receive a monthly fee for using their TradingView charts in my analysis.

NZD_CHF BEARISH BIAS|SHORT|
✅NZD_CHF has retested a key resistance level of 0.5000
And as the pair is already making a bearish pullback
A move down to retest the demand level below at 0.4941 is likely
SHORT🔥
✅Like and subscribe to never miss a new idea!✅
Disclosure: I am part of Trade Nation's Influencer program and receive a monthly fee for using their TradingView charts in my analysis.

GBP-USD Bearish Breakout! Sell!
Hello,Traders!
GBP-USD made a bearish
Breakout of the rising support
Which is a resistance now and
The breakout is confirmed
So we are bearish biased
And we will be expecting
A further bearish move down
Sell!
Comment and subscribe to help us grow!
Check out other forecasts below too!
Disclosure: I am part of Trade Nation's Influencer program and receive a monthly fee for using their TradingView charts in my analysis.

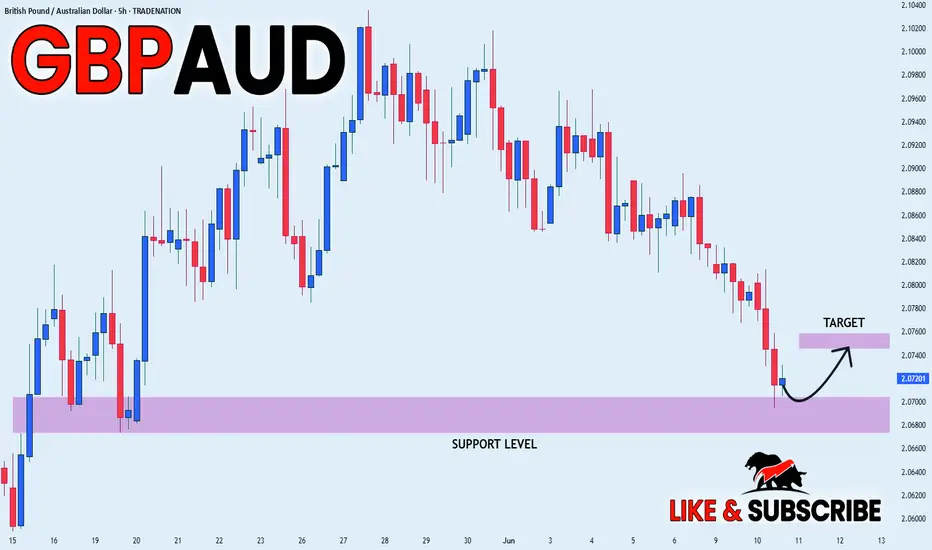
GBP_AUD RIKSY LONG|
✅GBP_AUD fell down sharply
But a strong support level was hit at 2.0680
Thus as a rebound is already happening
A move up towards the target of 2.0749 shall follow
LONG🚀
✅Like and subscribe to never miss a new idea!✅
Disclosure: I am part of Trade Nation's Influencer program and receive a monthly fee for using their TradingView charts in my analysis.
EUR-JPY Bullish Breakout! Buy!
Hello,Traders!
EUR-JPY is trading in an
Uptrend an the pair made a
Bullish breakout of the key
Horizontal level of 165.000
Which is confirmed so after
A a potential pullback we will
Be expecting a further
Bullish continuation
Buy!
Comment and subscribe to help us grow!
Check out other forecasts below too!
Disclosure: I am part of Trade Nation's Influencer program and receive a monthly fee for using their TradingView charts in my analysis.

We are waiting for the H4 liquidity backtest to place SELL GOLDYesterday there was a BUY point and a missed SELL. Currently gold is in wave 5. We are waiting for the H4 liquidity backtest to place a SELL order.
World gold prices rose after the People's Bank of China announced on June 7 that it had added gold to its reserves for the seventh consecutive month in May. China's gold reserves were valued at $241.99 billion at the end of last month, down from $243.59 billion at the end of April. Gold prices hit an all-time high (over $3,500/ounce) in April, which boosted the value of China's holdings of the precious metal.
Investors are now waiting for the US Consumer Price Index (CPI), data due on June 13, to assess the country's economic health and predict the trajectory of the US Federal Reserve's interest rate cuts.
Let's wait for SELL
Best regards, StarrOne !!!

MarketBreakdown | EURUSD, AUDUSD, USDCHF, EURCAD
Here are the updates & outlook for multiple instruments in my watch list.
1️⃣ #EURUSD daily time frame 🇪🇺🇺🇸
Though the pair remains quite weak for the last few days,
I strongly believe that bulls have unrealized potential.
The pair may continue rising and reach the underlined yellow resistance soon.
2️⃣ #AUDUSD daily time frame 🇦🇺🇺🇸
The price is testing a significant horizontal resistance.
Its bullish breakout will provide a strong bullish signal.
The pair will go way higher then.
3️⃣ #USDCHF daily time frame 🇺🇸🇨🇭
The price is stuck within a narrow consolidation range.
I think that a sideways movement is going to continue
and the price will drop to the support of the range soon.
4️⃣ #EURCAD daily time frame 🇪🇺🇨🇦
The price action is contracting within a symmetrical triangle pattern.
Such a pattern signifies a deep indecision.
A breakout of one of its boundaries will indicate the side of the next market move.
Do you agree with my market breakdown?
❤️Please, support my work with like, thank you!❤️
I am part of Trade Nation's Influencer program and receive a monthly fee for using their TradingView charts in my analysis.

GBP-CHF Wait For Breakout! Buy!
Hello,Traders!
GBP-CHF formed a bullish
Triangle pattern so we are
Locally bullish biased and
IF we see a bullish breakout
Our bullish bias will be
Confirmed and we will be
Expecting a further
Bullish continuation
Buy!
Comment and subscribe to help us grow!
Check out other forecasts below too!
Disclosure: I am part of Trade Nation's Influencer program and receive a monthly fee for using their TradingView charts in my analysis.

GBP_NZD GROWTH AHEAD|LONG|
✅GBP_NZD went down to retest
A horizontal support of 2.2346
Which makes me locally bullish biased
And I think that a move up
From the level is to be expected
Towards the target above 2.2449
LONG🚀
✅Like and subscribe to never miss a new idea!✅
Disclosure: I am part of Trade Nation's Influencer program and receive a monthly fee for using their TradingView charts in my analysis.

EUR-AUD Potential Long! Buy!
Hello,Traders!
EUR-AUD made a retest
Of the horizontal support
Around 1.7480 and we are
Already seeing a bullish rebound
So a further move up
Is to be expected
Buy!
Comment and subscribe to help us grow!
Check out other forecasts below too!
Disclosure: I am part of Trade Nation's Influencer program and receive a monthly fee for using their TradingView charts in my analysis.

EUR_NZD WILL GO UP|LONG|
✅EUR_NZD fell down sharply
But a strong support level was hit at 1.8820
Thus as a rebound is already happening
A move up towards the target of 1.8923 shall follow
LONG🚀
✅Like and subscribe to never miss a new idea!✅
Disclosure: I am part of Trade Nation's Influencer program and receive a monthly fee for using their TradingView charts in my analysis.

EUR-CHF Local Short! Sell!
Hello,Traders!
EUR-CHF is making a rebound
And will soon hit a horizontal
Resistance level of 0.9400
From where we will be
Expecting a local bearish
Pullback and a move down
Sell!
Comment and subscribe to help us grow!
Check out other forecasts below too!
Disclosure: I am part of Trade Nation's Influencer program and receive a monthly fee for using their TradingView charts in my analysis.

CAD-JPY Pullback Expected! Sell!
Hello,Traders!
CAD-JPY made a retest of
The strong horizontal resistance
Level of 106.083 and as you
Can see the pair is already
Making a local pullback from
The level which sends a clear
Bearish signal to us therefore
We will be expecting a
Further bearish correction
Sell!
Comment and subscribe to help us grow!
Check out other forecasts below too!
Disclosure: I am part of Trade Nation's Influencer program and receive a monthly fee for using their TradingView charts in my analysis.

CHF_JPY WILL FALL|SHORT|
✅CHF_JPY price went up sharply
But a strong resistance level was hit around 176.330
Thus, as a pullback is already happening
And a move down towards the target of 175.799 shall follow
SHORT🔥
✅Like and subscribe to never miss a new idea!✅
Disclosure: I am part of Trade Nation's Influencer program and receive a monthly fee for using their TradingView charts in my analysis.

GBP_AUD REBOUND AHEAD|LONG|
✅GBP_AUD has been falling recently
And the pair seems locally oversold
So as the pair is approaching a horizontal support of 2.0786
Price growth is to be expected
LONG🚀
✅Like and subscribe to never miss a new idea!✅
Disclosure: I am part of Trade Nation's Influencer program and receive a monthly fee for using their TradingView charts in my analysis.

AUD-JPY Will Keep Growing! Buy!
Hello,Traders!
AUD-JPY made a bullish
Breakout of the key
Horizontal level of 93.800
And the breakout is confirmed
So we are bullish biased
And we will be expecting
A further bullish move up
Buy!
Comment and subscribe to help us grow!
Check out other forecasts below too!
Disclosure: I am part of Trade Nation's Influencer program and receive a monthly fee for using their TradingView charts in my analysis.

AUD_CHF ELEGANT SHORT|
✅AUD_CHF went up to retest
A horizontal resistance level of 0.5358
Which makes me locally bearish biased
And I think that a move down
From the level is to be expected
Towards the target below at 0.5330
SHORT🔥
✅Like and subscribe to never miss a new idea!✅
Disclosure: I am part of Trade Nation's Influencer program and receive a monthly fee for using their TradingView charts in my analysis.

CHF-JPY Correction Ahead! Sell!
Hello,Traders!
CHF-JPY will soon hit a
Horizontal resistance
Of 176.500 and as the
Pair is overbought we
Will be expecting a bearish
Correction next week
Sell!
Comment and subscribe to help us grow!
Check out other forecasts below too!
Disclosure: I am part of Trade Nation's Influencer program and receive a monthly fee for using their TradingView charts in my analysis.

AUD_JPY BULLISH BREAKOUT|LONG|
✅AUD_JPY is trading in a
Local uptrend and the pair
Broke the key horizontal level
Of 93.866 and the breakout is
Confirmed so we will be
Expecting a further
Bullish move up on Monday
LONG🚀
✅Like and subscribe to never miss a new idea!✅
Disclosure: I am part of Trade Nation's Influencer program and receive a monthly fee for using their TradingView charts in my analysis.

NZD-JPY Will Go Down! Sell!
Hello,Traders!
NZD-JPY keeps growing
But will soon hit a horizontal
Resistance of 87.730 and as
The pair is locally overbought
So after the retest we will
Be expecting a local
Bearish correction
Sell!
Comment and subscribe to help us grow!
Check out other forecasts below too!
Disclosure: I am part of Trade Nation's Influencer program and receive a monthly fee for using their TradingView charts in my analysis.

CAD_JPY SHORT FROM RESISTANCE|
✅CAD_JPY has been growing recently
And the pair seems locally overbought
So as the pair is approaching a horizontal resistance of 106.269
Price decline is to be expected
SHORT🔥
✅Like and subscribe to never miss a new idea!✅
Disclosure: I am part of Trade Nation's Influencer program and receive a monthly fee for using their TradingView charts in my analysis.
