XAUUSD – NFP STORM AHEADXAUUSD – NFP STORM AHEAD: WILL GOLD BREAK HIGHER OR FACE A DEEP CORRECTION?
Gold is entering a critical phase ahead of tonight’s Non-Farm Payrolls (NFP) report — one of the most influential economic releases globally. With US-China trade tensions resurfacing and growing concerns over US national debt, the precious metal market is likely to experience high volatility during the US session.
🌍 MACROECONOMIC & POLITICAL OUTLOOK
Trade negotiations between the US and China have resumed, with China reaffirming its intent to defend strategic metal exports amidst ongoing tariff threats.
The US national debt is projected to reach $55 trillion by 2034, prompting central banks worldwide to continue stockpiling gold as a hedge against fiat devaluation.
Fed Chair Jerome Powell maintains his stance of “not rushing to cut rates,” but political pressure — especially from former President Trump — is escalating rapidly.
Unemployment Claims fell slightly last week, reinforcing the view of a weakening labour market. If tonight’s NFP print disappoints, gold may surge on renewed expectations of future Fed easing.
📈 TECHNICAL ANALYSIS (H1 – EMA 13/34/89/200)
Gold has formed a classic impulsive wave structure, with recent highs tested around the 3408 – 3410 resistance zone.
Price action is consolidating near the EMA 89 and EMA 200, suggesting indecision and building energy for a potential breakout.
A breakdown below the 3344 – 3332 support zone could trigger a move toward the FVG liquidity block near 3320, a potential institutional buy level.
🔍 STRATEGIC KEYLEVELS TO WATCH
Resistance levels: 3380 – 3392 – 3408 – 3436
Support levels: 3365 – 3350 – 3344 – 3332 – 3320
🧭 TRADE SETUPS
🔻 SELL ZONE: 3408 – 3410
Stop Loss: 3415
Take Profit: 3404 → 3400 → 3395 → 3390 → 3380 → 3370 → 3360 → 3350
🔵 BUY ZONE: 3318 – 3316
Stop Loss: 3310
Take Profit: 3322 → 3326 → 3330 → 3335 → 3340 → 3350 → 3360 → ???
✅ CONCLUSION
Gold is “holding its breath” before the potential NFP-triggered breakout.
If NFP disappoints → USD weakens → Gold could explode above 3410.
If NFP beats expectations → Sellers may take full control and shift the market into a correction phase.
Forex-trading

GBP-JPY Free Signal! Sell!
Hello,Traders!
GBP-JPY made a retest of
The strong horizontal resistance
Of 196.260 and the pair seems
To be locally overbought
So we will go short with
The Take Profit of 195.525
And the Stop Loss of 196.455
Sell!
Comment and subscribe to help us grow!
Check out other forecasts below too!
Disclosure: I am part of Trade Nation's Influencer program and receive a monthly fee for using their TradingView charts in my analysis.

GBP_USD SWING BREAKOUT|SHORT|
✅GBP_USD was trading in an
Uptrend along the rising support
But now this support is broken
And the breakout is confirmed
So we are bearish biased
And we will be expecting a
Further bearish move down
SHORT🔥
✅Like and subscribe to never miss a new idea!✅
Disclosure: I am part of Trade Nation's Influencer program and receive a monthly fee for using their TradingView charts in my analysis.

GBP_JPY WILL FALL|SHORT|
✅GBP_JPY went up sharply
But a strong resistance level was hit at 196.400
Thus I am expecting a pullback
And a move down towards the target of 195.671
SHORT🔥
✅Like and subscribe to never miss a new idea!✅
Disclosure: I am part of Trade Nation's Influencer program and receive a monthly fee for using their TradingView charts in my analysis.

GBP-USD Local Long! Buy!
Hello,Traders!
GBP-USD made a bearish
Breakout of the rising support
So we are bearish biased mid-term
But locally the pair will soon
Hit a horizontal support
So we will be expecting a
Rebound and a local move up
Buy!
Comment and subscribe to help us grow!
Check out other forecasts below too!
Disclosure: I am part of Trade Nation's Influencer program and receive a monthly fee for using their TradingView charts in my analysis.

AUDJPY: Pullback Confirmed?! 🇦🇺🇯🇵
There is a high chance that AUDJPY will pull back
from the underlined resistance cluster.
Its false violation, a formation of a bearish imbalance candle
and a breakout of a rising trend line provide strong bearish confirmation.
Goal - 93.185
❤️Please, support my work with like, thank you!❤️
I am part of Trade Nation's Influencer program and receive a monthly fee for using their TradingView charts in my analysis.

AUD_JPY LOCAL SHORT|
✅The retest of the strong resistance level of 93.874 on AUD_JPY pair
Has happened after trading in a local uptrend from some time
Which makes price decrease a likely scenario
With the target being a local support below at 93.300
SHORT🔥
✅Like and subscribe to never miss a new idea!✅
Disclosure: I am part of Trade Nation's Influencer program and receive a monthly fee for using their TradingView charts in my analysis.

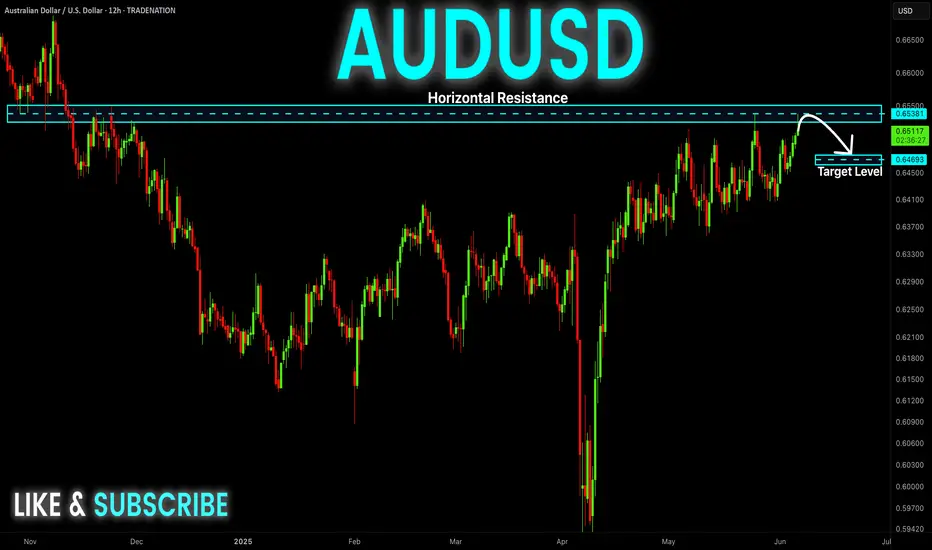
AUD-USD Short From Resistance! Sell!
Hello,Traders!
AUD-USD went up and hit
A horizontal resistance level
Of 0.6541 and as the level
Is strong we will be expecting
A local pullback and a
Bearish correction
Sell!
Comment and subscribe to help us grow!
Check out other forecasts below too!
Disclosure: I am part of Trade Nation's Influencer program and receive a monthly fee for using their TradingView charts in my analysis.
GBPUSD: Potential Reversal After Strong RallyThe British Pound has shown strong gains against the US Dollar, approaching a key resistance area. After such an extended move, a correction or reversal would be a logical expectation.
Technical Setup
There is a clear series of bearish divergences on the CCI (14) indicator. Price is forming a narrowing rising wedge, which often signals trend exhaustion.
Trade Plan
Sell limit orders: 1.3690 and 1.3850
Market entry: Only after confirmation — either a trendline break or a moving average crossover
Conclusion
GBPUSD shows signs of weakening at the top. I remain focused on short setups from resistance areas, waiting for confirmation to act.

EUR_JPY VERY RISKY LONG|
✅EUR_JPY is set to retest a
Local support level below at 162.900
After trading in a local downtrend for some time
Which makes a bullish rebound a likely scenario
With the target being a local resistance above at 163.112
LONG🚀
✅Like and subscribe to never miss a new idea!✅
Disclosure: I am part of Trade Nation's Influencer program and receive a monthly fee for using their TradingView charts in my analysis.

USD/JPY back at neckline as soft US data narrows yield spreadToday's soft US data releases weighed on US yields, which helped to further narrow the US-Japan spreads on the long dated bond yields. In turn, the USD/JPY gave up its entire gains from the day before when it was boosted by the JOLTS data. Next move could be defendant on the nonfarm payrolls report on Friday.
From a technical point of view, this is text book stuff. Price is testing a key area of support at the time of writing, between 142.00 to 142.70, as marked in grey on the chart. This zone has provided strong support on multiple occasions, preventing rates from sliding towards 140.00 zone. Now the more a level or an area is tested, the more likely it will break down. Will we see a break here in the next few days? Or will support continue to hold, as improving risk appetite gives US dollar some breathing space?
Well, the pair is down quite a lot on the session, so i wouldn't rule out a bounce here heading into US close. But the trend direction is clear: bearish.
By Fawad Razaqzada, market analyst with FOREX.com

GBP-CAD Will Go Down! Sell!
Hello,Traders!
GBP-CAD is already going
Down from the wide horizontal
Resistance of 1.8583 so we are
Locally bearish biased and
We will be expecting a
Further bearish move down
Sell!
Comment and subscribe to help us grow!
Check out other forecasts below too!
Disclosure: I am part of Trade Nation's Influencer program and receive a monthly fee for using their TradingView charts in my analysis.

GBP-USD Local Short! Sell!
Hello,Traders!
GBP-USD made a retest
Of the horizontal resistance
Of 1.3590 and we are already
Seeing a local pullback so
Despite a counter-trend
Direction of the trade
We will be expecting a
Local move down
Sell!
Comment and subscribe to help us grow!
Check out other forecasts below too!
Disclosure: I am part of Trade Nation's Influencer program and receive a monthly fee for using their TradingView charts in my analysis.

EUR_GBP POTENTIAL LONG|
✅EUR_GBP will be retesting a support level soon at 0.8400
From where I am expecting a bullish reaction
With the price going up but we need
To wait for a reversal pattern to form
Before entering the trade, so that we
Get a higher success probability of the trade
LONG🚀
✅Like and subscribe to never miss a new idea!✅
Disclosure: I am part of Trade Nation's Influencer program and receive a monthly fee for using their TradingView charts in my analysis.

EUR-USD Bullish Rebound! Buy!
Hello,Traders!
EUR-USD made a retest of
The falling support line
While trading in a local
Uptrend and we are already
Seeing a bullish reaction
So we are locally bullish
Biased and we will be
Expecting a further move up
Buy!
Comment and subscribe to help us grow!
Check out other forecasts below too!

EUR-GBP Support Ahead! Buy!
Hello,Traders!
EUR-GBP made a pullback
From the horizontal resistance
Above just as we predicted
In our previous analysis
But a local horizontal support
Level is ahead at 0.8398
So after the retest we
Will be expecting a
Bullish rebound and a
Local bullish move up
Buy!
Comment and subscribe to help us grow!
Check out other forecasts below too!
Disclosure: I am part of Trade Nation's Influencer program and receive a monthly fee for using their TradingView charts in my analysis.

XAUUSD: Break or Bounce at ResistanceGold has reached a critical technical zone near a long-term descending trendline and horizontal resistance around $3360–3380. Price action suggests a make-or-break moment is unfolding.
Key Technical Structure:
Descending Trendline Resistance from the April high capped the rally.
Current move has formed a rising wedge — typically bearish if broken.
Price is testing resistance confluence — a rejection could send Gold lower.
Scenarios to Watch:
🔹 Bullish Breakout:
Clean breakout and close above $3380 confirms trendline invalidation.
Upside projection points to $3500 — previous high and psychological level.
🔹 Bearish Rejection:
Failure to break the trendline + wedge breakdown can drag price to:
$3280 (38.2% Fib)
$3160–3200 zone (61.8% Fib + demand area)
Macro Factors to Watch:
Tariff escalation between US–EU could trigger risk-off → bullish for Gold.
FOMC policy pause, weak job data, or inflation rebound also support upside.
Stronger USD or yield spike may trigger wedge breakdown → bearish.
Conclusion:
XAUUSD is at a key inflection point. Wait for confirmation: either a clean breakout or a clear reversal rejection. Trade the resolution, not the anticipation.

USD-CHF Head And Shoulders Breakout! Sell!
Hello,Traders!
USD-CHF formed a H&S
Pattern and then made a
Bearish breakout which is
Confirmed so we are bearish
Biased and we will be expecting
A further bearish move down
Sell!
Comment and subscribe to help us grow!
Check out other forecasts below too!
Disclosure: I am part of Trade Nation's Influencer program and receive a monthly fee for using their TradingView charts in my analysis.

Market next move 🔻 1. False Breakout Risk
Price is hovering right at the resistance-turned-support zone.
The candles above this zone have long upper wicks, signaling rejection and selling pressure.
This may be a bull trap before reversal.
---
📉 2. Decreasing Bull Volume
Volume peaked earlier, but the most recent green candles are showing lower volume, suggesting weakening bullish momentum.
Lack of strong follow-through volume often precedes reversals.
---
🕳️ 3. Overextended Rally
Gold has moved sharply upward recently (over +2.5%).
There may be a need for a cooldown or retracement, especially if no fresh catalysts emerge.
---
⚠️ 4. Macro Factors Unpriced
The chart includes a U.S. event icon, likely representing upcoming economic data (e.g., Fed comments, job reports).
Any hawkish surprise (rate hike concerns, strong jobs report) could cause a sharp reversal in gold due to rising yields and a stronger USD.

NZD_USD RISKY SHORT FROM RESISTANCE|
✅NZD_USD has been growing recently
And the pair seems locally overbought
So as the pair is approaching a horizontal resistance of 0.6030
Price decline is to be expected
SHORT🔥
✅Like and subscribe to never miss a new idea!✅
Disclosure: I am part of Trade Nation's Influencer program and receive a monthly fee for using their TradingView charts in my analysis.

GBP-USD Will Go UP! Buy!
Hello,Traders!
GBP-USD is trading in an
Uptrend and the pair already
Made a rebound from the
Horizontal support level
Around 1.3431 from where
So we are bullish biased
And we will be expecting
A further bullish move up
Buy!
Comment and subscribe to help us grow!
Check out other forecasts below too!
Disclosure: I am part of Trade Nation's Influencer program and receive a monthly fee for using their TradingView charts in my analysis.

AUD_USD POTENTIAL LONG|
✅AUD_USD fell down sharply
But a strong support level was hit around 0.6400
Thus as a rebound is already happening
A move up towards the target of 0.6463 shall follow
LONG🚀
✅Like and subscribe to never miss a new idea!✅
Disclosure: I am part of Trade Nation's Influencer program and receive a monthly fee for using their TradingView charts in my analysis.

GBP-NZD Local Long! Buy!
Hello,Traders!
GBP-NZD will soon hit a
Horizontal support level
Of 2.0518 and as we have
Seem multiple rebounds
From the level we can
Bet on a one more rebound
And go long from the level
On Monday
Buy!
Comment and subscribe to help us grow!
Check out other forecasts below too!
Disclosure: I am part of Trade Nation's Influencer program and receive a monthly fee for using their TradingView charts in my analysis.
