USD-CAD Bearish Bias! Sell!
Hello,Traders!
USD-CAD is trading in a
Downtrend and the pair
Made a bearish breakout
Of the key horizontal level
Of 1.3774 which is now a
Resistance and the pair is
Making a local pullback
To retest the new resistance
From where we will be
Expecting a further
Bearish continuation
Sell!
Comment and subscribe to help us grow!
Check out other forecasts below too!
Disclosure: I am part of Trade Nation's Influencer program and receive a monthly fee for using their TradingView charts in my analysis.
Forex-trading

AUD_NZD SUPPORT AHEAD|LONG|
✅AUD_NZD is going down now
But a strong support level is ahead at 1.0780
Thus I am expecting a rebound
And a move up towards the target at 1.0827
LONG🚀
✅Like and subscribe to never miss a new idea!✅
Disclosure: I am part of Trade Nation's Influencer program and receive a monthly fee for using their TradingView charts in my analysis.

EUR-USD Local Long! Buy!
Hello,Traders!
EUR-USD made a retest
Of the key horizontal
Support level of 1.1369
And we are already seeing
A bullish rebound so we will
Be expecting a further
Bullish move up
Buy!
Comment and subscribe to help us grow!
Check out other forecasts below too!
Disclosure: I am part of Trade Nation's Influencer program and receive a monthly fee for using their TradingView charts in my analysis.

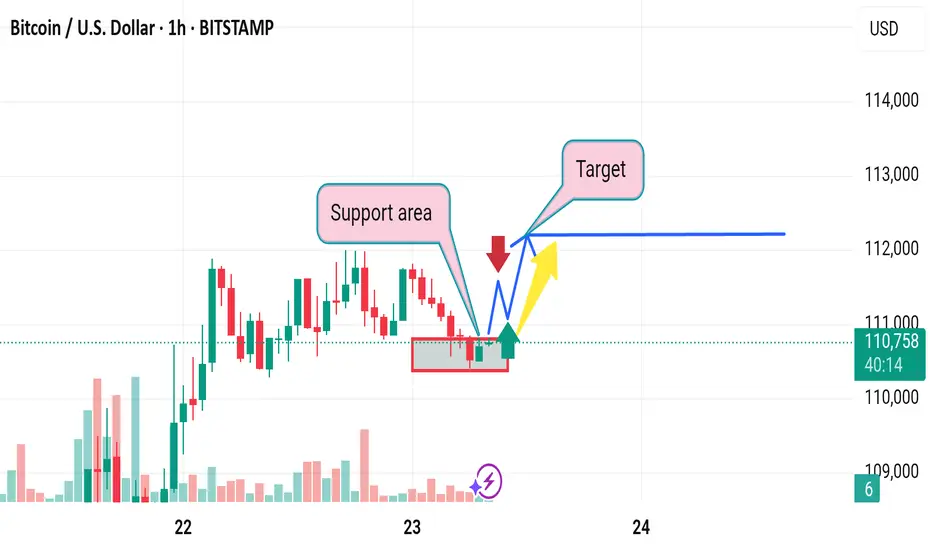
Market next target
Original Analysis Summary:
Identifies a bullish breakout above a support zone.
Expects continuation upward to a target zone after minor pullback.
Assumes support holds and bullish trend continues.
---
Disruptive Bearish Interpretation:
1. Fakeout Risk (Bull Trap):
Price broke above the support area, but this could be a false breakout designed to lure in long positions before a reversal.
2. Trendline Retest Failure:
The price is testing a trendline or resistance zone. Failure to break above this area could indicate rejection and reversal.
3. Bearish Divergence:
If momentum indicators (e.g., RSI or MACD, not shown here but inferred) show divergence, it may warn of weakening bullish strength despite price rising.
4. Candlestick Exhaustion:
Recent candles show upper wicks and slowing momentum — a common sign of potential exhaustion.

EUR_CAD RISKY LONG|
✅EUR_CAD is going down to retest
A horizontal support of 1.5570
Which makes me locally bullish biased
And I think that we will see a rebound
And a move up from the level
Towards the target above at 1.5630
LONG🚀
✅Like and subscribe to never miss a new idea!✅
Disclosure: I am part of Trade Nation's Influencer program and receive a monthly fee for using their TradingView charts in my analysis.

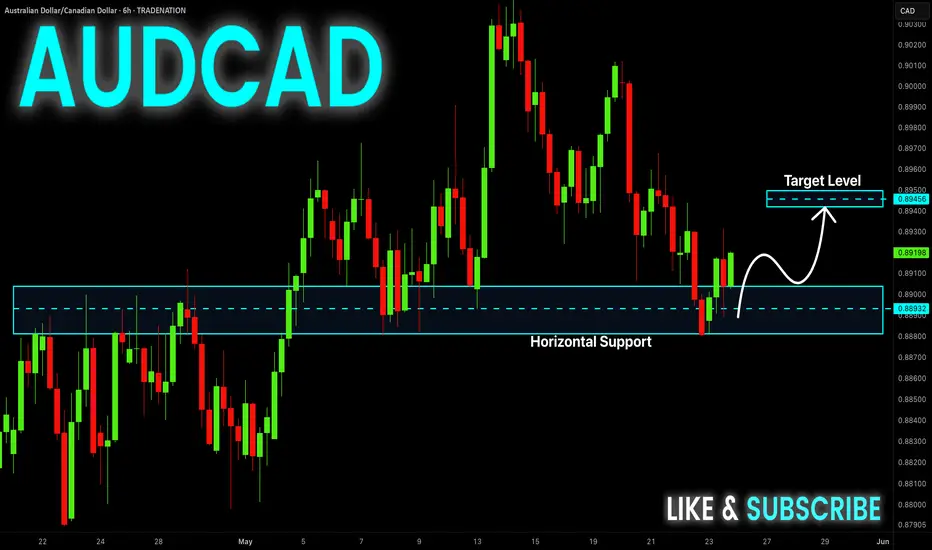
AUD-CAD Will Go UP! Buy!
Hello,Traders!
AUD-CAD made a retest
Of the horizontal support
Level of 0.8880 and we
Are already seeing a
Bullish rebound so we are
Locally bullish biased and
We will be expecting a
Further bullish move up
Buy!
Comment and subscribe to help us grow!
Check out other forecasts below too!
Disclosure: I am part of Trade Nation's Influencer program and receive a monthly fee for using their TradingView charts in my analysis.
EUR_NZD LOCAL LONG|
✅EUR_NZD is going down now
But a strong support level is ahead at 1.8940
Thus I am expecting a rebound
And a move up towards the target of 1.9022
LONG🚀
✅Like and subscribe to never miss a new idea!✅
Disclosure: I am part of Trade Nation's Influencer program and receive a monthly fee for using their TradingView charts in my analysis.

USD-CHF Free Signal! Buy!
Hello,Traders!
USD-CHF is once again
Retesting a horizontal support
Level around 0.8189 and the
Pair seems to have formed
A H&S pattern, so we are bearish
Biased, however, a local bullish
Rebound from the support
Is possible so while risky
A long trade still makes sense
With the Take Profit of 0.8238
And the Stop Loss of 0.8184
Buy!
Comment and subscribe to help us grow!
Check out other forecasts below too!
Disclosure: I am part of Trade Nation's Influencer program and receive a monthly fee for using their TradingView charts in my analysis.

EUR_USD HEAD AND SHOULDERS|LONG|
✅EUR_USD has formed a
Head and Shoulders pattern
And the pair has now formed
The last leg of it, so we are
Bullish biased and IF we see
A bullish breakout of the
Neckline of 1.1380 next week
Then we will be expecting a
Further bullish move up
LONG🚀
✅Like and subscribe to never miss a new idea!✅
Disclosure: I am part of Trade Nation's Influencer program and receive a monthly fee for using their TradingView charts in my analysis.

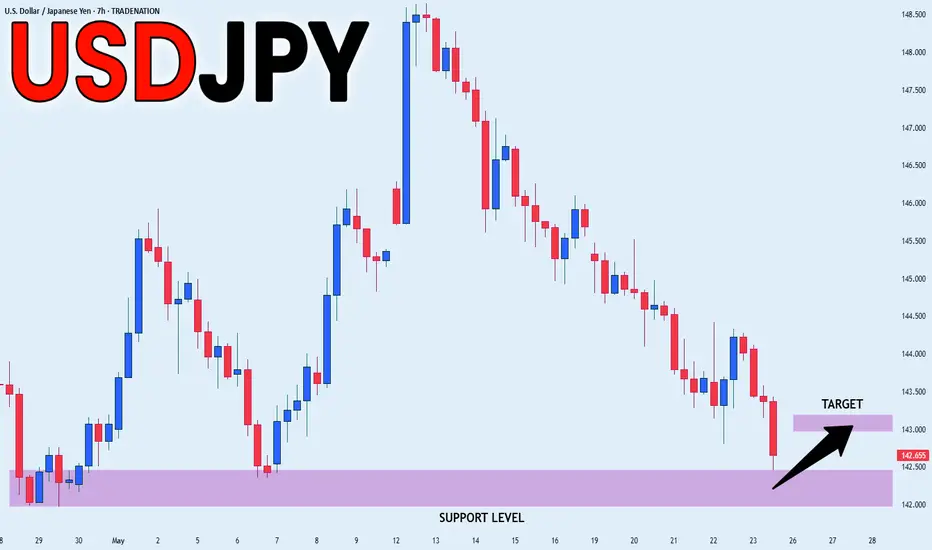
USD-JPY Free Signal For Monday! Buy!
Hello,Traders!
USD-JPY is about to retest
A horizontal support level
Around 142.000 and after
The retest on Monday we
Will be able to go long on
The pair with the Take
Profit of 143.331 and the
Stop Loss of 141.939
Buy!
Comment and subscribe to help us grow!
Check out other forecasts below too!
Disclosure: I am part of Trade Nation's Influencer program and receive a monthly fee for using their TradingView charts in my analysis.

GBP-CAD Support Cluster! Buy!
Hello,Traders!
GBP-CAD is trading in a
Local uptrend along the
Rising support and the pair
Made a retest of the support
Cluster of the rising and
Horizontal support lines
Around 1.8546 from where
We are already seeing a
Bullish rebound so we
Will be expecting a
Further local bullish move
Up on Monday
Buy!
Comment and subscribe to help us grow!
Check out other forecasts below too!
Disclosure: I am part of Trade Nation's Influencer program and receive a monthly fee for using their TradingView charts in my analysis.

GBP_USD SWING BREAKOUT|LONG|
✅GBP_USD made an absolutely
EPIC breakout of the key horizontal
Level of 1.3426 and the breakout is
Confirmed even on a DAILY timeframe
Which combined with the strong uptrend
Makes us extremely bullish biased on
The pair and we will be expecting
Further growth in the coming weeks
After a potential local pullback
LONG🚀
✅Like and subscribe to never miss a new idea!✅
Disclosure: I am part of Trade Nation's Influencer program and receive a monthly fee for using their TradingView charts in my analysis.

AUD-USD Free Signal For Monday! Sell!
Hello,Traders!
AUD-USD keep growing in
An uptrend an we are bullish
Biased mid-term, however
The pair is locally overbought
So after the pair enters the
Resistance area around 0.6510
On Monday we will be able
To go short on the pair
With the Take Profit of 0.6480
And the Stop Loss of 0.6516
Sell!
Comment and subscribe to help us grow!
Check out other forecasts below too!
Disclosure: I am part of Trade Nation's Influencer program and receive a monthly fee for using their TradingView charts in my analysis.

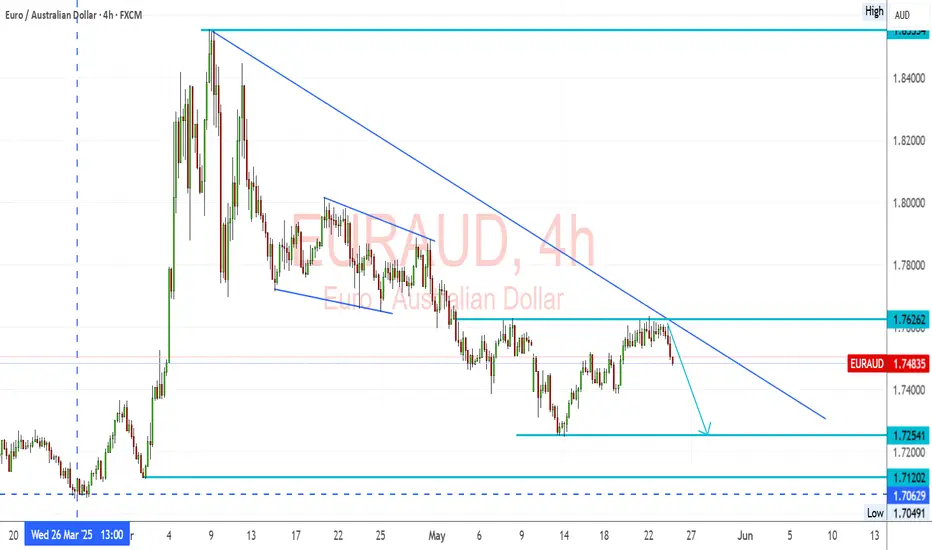
EURAUD – Trendline Holds, Bearish Setup Below 1.7626EURAUD Trend: EURAUD pair remains in a strong downtrend, marked by consistent lower highs and a descending trendline.
Resistance: 1.7626 has been retested and rejected, confirming it as a short-term ceiling.
Structure: The latest rejection from both horizontal resistance and the trendline confirms bearish intent.
🔽 Bearish Targets:
1.7254 – minor support and near-term target
1.7120 – stronger support zone
1.7060 – previous low and potential extended target
A clear break below 1.7400 could confirm continuation of the trend toward those levels.
Fundamental Overview:
🔻 EUR Weakness:
The Eurozone is slowing, particularly in Germany and France.
ECB remains cautious; recent comments show concern about tight financial conditions and sticky inflation.
Political uncertainties and mixed data prints are adding pressure.
🟢 AUD Support:
The RBA remains firm with hawkish language, holding rates while global peers lean dovish.
Commodities remain stable, and Australia benefits from demand out of Asia.
Domestic data (jobs and retail) shows surprising resilience.
Summary:
Bias: Bearish below 1.7626
Break Trigger: 1.7400
Target Range: 1.7250 – 1.7060
Fundamentals: Favor AUD on stronger economic footing and RBA policy tone
📉 EURAUD looks ready for another leg lower unless we see a breakout above 1.7630 with conviction.
AUD_USD SHORT FROM RESISTANCE|
✅AUD_USD has been growing recently
And the pair seems locally overbought
So as the pair is approaching a horizontal resistance of 0.6515
Price decline is to be expected on Monday
SHORT🔥
✅Like and subscribe to never miss a new idea!✅
Disclosure: I am part of Trade Nation's Influencer program and receive a monthly fee for using their TradingView charts in my analysis.

GBP_CAD RISING SUPPORT AHEAD|LONG|
✅GBP_CAD is trading along the rising support
And as the pair will soon retest it
I am expecting the price to go up
To retest the supply levels above at 1.8605
LONG🚀
✅Like and subscribe to never miss a new idea!✅
Disclosure: I am part of Trade Nation's Influencer program and receive a monthly fee for using their TradingView charts in my analysis.

USD_JPY SUPPORT AHEAD|LONG|
✅USD_JPY is going down now
But a strong support level is ahead at 142.000
Thus I am expecting a rebound
And a move up towards the target of 143.000
LONG🚀
✅Like and subscribe to never miss a new idea!✅
Disclosure: I am part of Trade Nation's Influencer program and receive a monthly fee for using their TradingView charts in my analysis.
GBP-USD Massive Swing Breakout! Buy!
Hello,Traders!
GBP-USD is trading in a
Strong uptrend and the
Pair made a massive
Bullish breakout of the
Key horizontal level
Of 1.3444 and went
Further up which reinforces
Our bullish bias and after
A potential pullback we
Will be expecting a
Further bullish move up
Next week
Buy!
Comment and subscribe to help us grow!
Check out other forecasts below too!
Disclosure: I am part of Trade Nation's Influencer program and receive a monthly fee for using their TradingView charts in my analysis.

GBPAUD: Important Breakout 🇬🇧🇦🇺
GBPAUD broke and closed above a significant falling trend line on a daily.
The next strong resistance is 2.1 level.
It will most likely be the next goal for the buyers.
❤️Please, support my work with like, thank you!❤️
I am part of Trade Nation's Influencer program and receive a monthly fee for using their TradingView charts in my analysis.

Market target 1. Support Area Assumption
Disruption: The highlighted support area is relatively narrow and based on a few candles. On a 1-hour chart, this might not provide a strong enough foundation for a meaningful bounce. The price has tested this level multiple times, suggesting weakening support rather than strength.
2. Target Projection
Disruption: The target area is drawn without showing how it was calculated—no Fibonacci level, previous resistance, or volume zone is referenced. Without clear technical justification, the target level appears speculative.
3. Pattern Expectation (Bounce Prediction)
Disruption: The blue arrow suggests a bullish reversal, but volume is declining, and there’s no strong bullish candle yet to confirm the move. In fact, multiple lower highs suggest bearish pressure.
4. Ignoring Bearish Continuation
Disruption: The red arrow suggesting a drop isn't emphasized as strongly as the bullish path. However, repeated testing of the support with no significant bounce increases the risk of a breakdown. Also, if macroeconomic conditions or broader crypto sentiment is bearish, this chart setup could break down easily.
5. Lack of Context
Disruption: The chart analysis is isolated to a short timeframe (1 hour). Without higher timeframe confluence (e.g., 4H, Daily), any short-term pattern can easily be a false signal.
NZD_CAD LONG SIGNAL|
✅NZD_CAD is going down to
Retest a horizontal support of 0.8160
Which makes me locally bullish biased
And I think that we will see a rebound
And a move up from the level
So we can go long wit the
TP of 0.8206 and the SL of 0.8152
LONG🚀
✅Like and subscribe to never miss a new idea!✅
Disclosure: I am part of Trade Nation's Influencer program and receive a monthly fee for using their TradingView charts in my analysis.

USD_CHF CORRECTION AHEAD|SHORT|
✅USD_CHF is going up now
But a strong resistance level is ahead at 0.8328
Thus I am expecting a pullback
And a move down towards the target of 0.8260
SHORT🔥
✅Like and subscribe to never miss a new idea!✅
Disclosure: I am part of Trade Nation's Influencer program and receive a monthly fee for using their TradingView charts in my analysis.

Market falls downward
1. Resistance Zone May Be Weak
Observation: A red rectangle marks a resistance area.
Disruption: This "resistance" level is based on a short-term bounce and may not have strong historical confluence. It lacks multiple rejections to establish it as a true resistance zone.
---
2. Overemphasis on Bearish Bias
Observation: Two bearish paths (blue and yellow) dominate the projection, indicating an expected drop.
Disruption: This may be prematurely bearish. There's no confirmation of rejection yet—no strong bearish candlestick pattern (like a shooting star, engulfing, or evening star) is visible in that zone.
---
3. Lack of Bullish Consideration
Observation: A small green arrow is shown but not given much weight.
Disruption: The recent candles show higher lows, indicating potential bullish pressure. If price breaks above the marked zone, it may trigger a short squeeze rally.
---
4. Volume Misalignment
Observation: Volume spikes during the bounce, especially on the green candles.
Disruption: Rising volume on a recovery typically supports continuation upward. This analysis ignores the bullish volume context and instead forecasts reversal.
---
5. No Higher Timeframe Confluence
Observation: 1-hour chart used in isolation.
Disruption: A strong bearish or bullish direction on the 4H or Daily chart would validate or invalidate this local setup. Without it, the trade thesis lacks broader context.
