Artavion Analysts Forecast Bitcoin to Reach $100,000 by End of MThe analytical company Artavion has released an updated forecast for the price of Bitcoin (BTC) by the end of May 2025. According to the experts, amid sustained institutional demand and limited supply following the recent halving, the price of the leading cryptocurrency could reach $100,000 in the coming days.
Key Growth Drivers
Analysts highlight several factors contributing to Bitcoin's price growth:
📈 Institutional Demand: Ongoing accumulation by investment funds and banks through spot ETFs approved in the U.S. and Asia.
⛏ Reduced Supply: The April halving has decreased miner rewards, limiting daily BTC issuance.
🇺🇸 Fed Policy Easing: Expectations of interest rate cuts are increasing demand for alternative assets, including crypto.
💼 Market Confidence: Growth in long-term holders and increasing BTC withdrawals from exchanges indicate a “HODLing” trend among investors.
Company Comment
"We are witnessing stable accumulation and a capital shift into digital assets. If markets avoid major shocks, Bitcoin has every chance to consolidate above $95,000 and briefly test the psychological barrier of $100,000," said Alexey Gurov, senior strategist at Artavion.
Potential Risks
Despite the optimistic outlook, analysts point out several risks that could impact the forecast:
📉 Unexpected macroeconomic data (e.g., rising inflation, stronger U.S. dollar);
⚠️ Regulatory actions from the SEC or other global bodies;
🌍 Escalation of geopolitical tensions, which could trigger risk-off sentiment.
Conclusion
Considering the current market environment and macroeconomic expectations, Artavion maintains a positive short-term outlook for Bitcoin through the end of May, while cautioning investors to remain aware of the sector’s inherent volatility and risk.
Forex-trading

XAUUAD UPDATE 22-05-2025The chart you provided is a technical analysis for Gold (CFDs on Gold - US$/OZ) on a 1-hour timeframe. Here’s a breakdown of what it shows:
1. Price Action:
The current price is around $3,331.56.
The price has recently entered a resistance zone (highlighted in yellow-red near the top).
2. Resistance Zones:
Upper resistance: Around $3,389 (top yellow box).
Immediate resistance: Around $3,330–$3,340 (where price is currently reacting).
3. Support Zone:
Lower support: Around $3,142–$3,160 (bottom yellow box).
4. Bearish Outlook (as indicated by the blue arrow):
The chart suggests a potential rejection from the current resistance zone.
A projected drop toward the lower support area is illustrated.
There’s a red-shaded box likely representing a stop-loss zone, implying a short trade setup with entry near the current level.
5. Volume: There’s a moderate rise in volume recently, which could support the momentum shift.
Conclusion: The chart analysis suggests a short setup expecting gold to fall from the current resistance zone to the support zone around $3,140, assuming price fails to break above resistance.
Would you like a technical analysis or trading plan based on this idea?

USD-CHF Risky Long! Buy!
Hello,Traders!
USD-CHF made a retest
Of the horizontal support
Of 0.8213 and we are already
Seeing a local rebound so
We are locally bullish biased
And we will be expecting a
Further bullish move up
Buy!
Comment and subscribe to help us grow!
Check out other forecasts below too!
Disclosure: I am part of Trade Nation's Influencer program and receive a monthly fee for using their TradingView charts in my analysis.

EUR-USD Potential Long! Buy!
Hello,Traders!
EUR-USD is trading in an
Uptrend and the pair made
A breakout of the key horizontal
Level of 1.1300 which is confirmed
So now the price is consolidating
Above the new support
And after a potential retest
Of the support level we are
Likely to see a further
Bullish move up
Buy!
Comment and subscribe to help us grow!
Check out other forecasts below too!
Disclosure: I am part of Trade Nation's Influencer program and receive a monthly fee for using their TradingView charts in my analysis.

AUD_NZD WILL FALL|SHORT|
✅AUD_NZD made a bearish
Breakout then a retest of the
New resistance around 1.0867
From where we are already
Seeing a powerful pullback
So we are locally bearish
Biased and we will be
Expecting a further move down
SHORT🔥
✅Like and subscribe to never miss a new idea!✅
Disclosure: I am part of Trade Nation's Influencer program and receive a monthly fee for using their TradingView charts in my analysis.

CAD-JPY Will Go UP! Buy!
Hello,Traders!
CAD-JPY made a retest
Of the horizontal support
Of 103,431 and we are
Already seeing a bullish
Rebound so we will be
Expecting a further
Local bullish rebound
Buy!
Comment and subscribe to help us grow!
Check out other forecasts below too!
Disclosure: I am part of Trade Nation's Influencer program and receive a monthly fee for using their TradingView charts in my analysis.

Market next move
Bearish Disruption to GBP/USD Analysis:
1. Support Weakness:
The price action within the red box shows multiple bearish candles, suggesting the zone is under pressure.
A break and close below this box could invalidate the bullish thesis.
2. Exhaustion Signals:
After a sharp rally, the market often consolidates or corrects. The current stall near 1.3400–1.3420 could indicate buying exhaustion.
The latest candle shows a strong bearish push into the support, hinting at potential for deeper decline.
3. Decreasing Volume:
Recent green candles had falling volume, which shows lack of conviction by buyers.
Meanwhile, red (bearish) candles show rising volume, signaling increased selling pressure.
4. Failed Breakout Setup:
If this bounce fails and price closes below 1.3380, this will form a false breakout or bull trap, triggering stop hunts and aggressive shorting.
5. Macroeconomic Headwinds:
GBP is sensitive to UK data and BoE policy. Any hawkish Fed or weak UK numbers may lead to a USD rebound, pushing GBP/USD lower.

USD/JPY Dips FurtherUSD/JPY Dips Further
USD/JPY declined below 144.50 and is currently consolidating losses.
Important Takeaways for USD/JPY Analysis Today
- USD/JPY is trading in a bearish zone below the 146.10 and 144.90 levels.
- There is a short-term bearish trend line forming with resistance at 144.25 on the hourly chart at FXOpen.
USD/JPY Technical Analysis
On the hourly chart of USD/JPY at FXOpen, the pair started a steady decline from well above the 146.00 zone. The US Dollar gained bearish momentum below the 145.00 support against the Japanese Yen.
The pair even settled below the 144.50 level and the 50-hour simple moving average. There was a spike below 144.00 and the pair traded as low as 143.72. It is now consolidating losses with a bearish angle. Immediate resistance on the USD/JPY chart is near the 23.6% Fib retracement level of the recent decline from the 146.10 swing high to the 143.42 low at 144.25.
There is also a short-term bearish trend line forming with resistance at 144.25. The first major resistance is near the 144.90 zone and the 50% Fib retracement level of the recent decline from the 146.10 swing high to the 143.42 low.
If there is a close above the 144.90 level and the hourly RSI moves above 50, the pair could rise toward 145.50. The next major resistance is near 146.10, above which the pair could test 147.50 in the coming days.
On the downside, the first major support is near 143.70. The next major support is near the 143.20 level. If there is a close below 143.20, the pair could decline steadily. In the stated case, the pair might drop toward the 142.00 support.
This article represents the opinion of the Companies operating under the FXOpen brand only. It is not to be construed as an offer, solicitation, or recommendation with respect to products and services provided by the Companies operating under the FXOpen brand, nor is it to be considered financial advice.

EUR_USD BULLISH BREAKOUT|LONG|
✅EUR_USD made a bullish
Breakout of the key horizontal
Level of 1.1287 and the breakout
Is confirmed so we are bullish
Biased and we will be expecting
A further bullish move up
After a potential local
Retest of the new support
LONG🚀
✅Like and subscribe to never miss a new idea!✅
Disclosure: I am part of Trade Nation's Influencer program and receive a monthly fee for using their TradingView charts in my analysis.

Btc short analysis successfully target reached. Trust on my analysis target 🎯 reached successfully
1000+pips profit booked
Enrty at 83800
Tp at 82300

AUD-CAD Local Long! Buy!
Hello,Traders!
AUD-CAD will soon hit
A horizontal support level
Of 0.8888 after a sharp
Fall down but its a strong
Support so we will be
Expecting a rebound and
A local move up
Buy!
Comment and subscribe to help us grow!
Check out other forecasts below too!
Disclosure: I am part of Trade Nation's Influencer program and receive a monthly fee for using their TradingView charts in my analysis.

GBP-CAD Will Keep Growing! Buy!
Hello,Traders!
GBP-CAD is trading in a local
Uptrend and the pair made a
Breakout and a retest of the
Key horizontal level of 1.8600
Which is now a support and
We are seeing a bullish rebound
From the new support already
So we are bullish biased and
We will be expecting a further
Bullish continuation
Buy!
Comment and subscribe to help us grow!
Check out other forecasts below too!
Disclosure: I am part of Trade Nation's Influencer program and receive a monthly fee for using their TradingView charts in my analysis.

GBP_NZD WILL GROW|LONG|
✅GBP_NZD has retested a key support level of 2.2520
And as the pair is already making a bullish rebound
A move up to retest the supply level above at 2.2600 is likely
LONG🚀
✅Like and subscribe to never miss a new idea!✅
Disclosure: I am part of Trade Nation's Influencer program and receive a monthly fee for using their TradingView charts in my analysis.

Market next move 1. Over-Reliance on Support Zone
The analysis heavily leans on the assumption that the support zone (marked with the purple "Support" label) will hold.
However, this support has already been tested multiple times, which weakens its strength.
A break below this zone could trigger significant stop-loss hunting, leading to a bearish breakdown instead of a bullish reversal.
2. Volume Analysis Suggests Weak Momentum
The recent bounce lacks strong volume. This suggests that buying interest is not convincing at this level.
Without volume confirmation, any bullish move is less likely to sustain.
3. Lower Highs Pattern
Despite small rallies, the chart is forming lower highs, which is typically a bearish signal.
This hints at seller dominance, and the yellow bullish projection might be overly optimistic.
4. Resistance Overhead
The price is approaching a short-term resistance zone (red box), which has rejected the price previously.
Without a clear breakout above that, the bullish case is speculative.
5. Fundamental Factors Unaccounted
The chart doesn’t account for macro factors like U.S. dollar strength, interest rates, or geopolitical influences that often affect gold.
If the dollar strengthens, gold may drop, breaking the support.
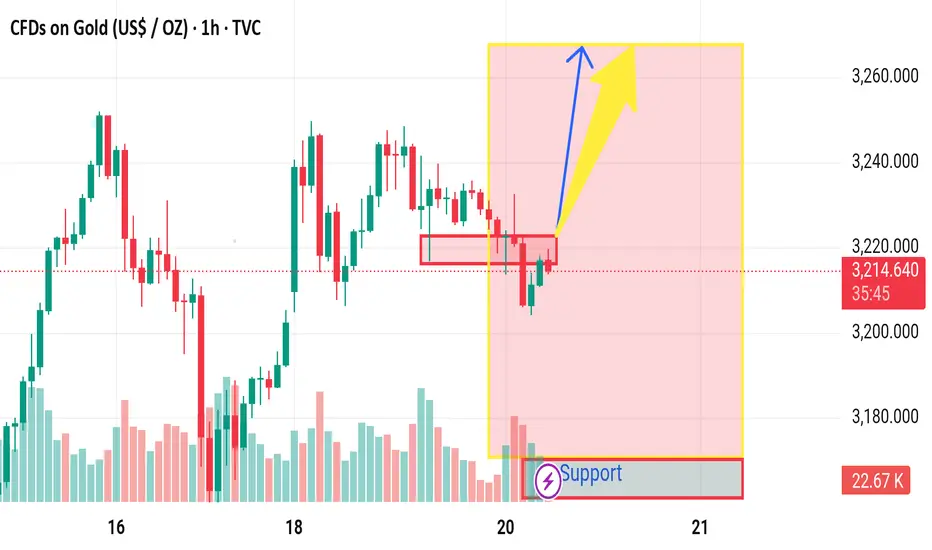
Market next move Bearish Disruption Analysis:
1. Range Weakness and Exhaustion Risk:
The price has been ranging within a tight zone, and repeated tests of the support line near 3,215–3,218 show weakening buyer pressure.
If bulls were strong, we might have already seen a breakout with momentum. Instead, there's sideways choppiness, suggesting indecision or exhaustion.
2. Lower Highs Forming:
Despite a flat support zone, price is forming lower highs, a bearish signal. Sellers are stepping in earlier on each bounce, tightening the range from the top.
3. Volume Depletion:
Volume is gradually dropping during this consolidation. If a breakout happens without a volume surge, it risks becoming a false breakout.
4. Liquidity Sweep Possibility:
Market makers might push price below the support zone (~3,215) to trigger stop-losses and accumulate orders before a potential real breakout. This would trap late buyers who enter early.
5. Bearish Scenario Path:
If price breaks below 3,215 and closes under that on decent volume, expect a move to the next demand zone near 3,200 or lower.
Downside target could be around 3,180–3,190, where the previous demand base formed on May 15.

GBP-AUD Double Top Pattern! Sell!
Hello,Traders!
GBP-AUD made a retest
Of the horizontal resistance
Level of 2.0820, then
Established a double-top
Pattern and is now going
Down so we are locally
Bearish biased which
Means that we will be
Expecting a further
Bearish move down
Sell!
Comment and subscribe to help us grow!
Check out other forecasts below too!
Disclosure: I am part of Trade Nation's Influencer program and receive a monthly fee for using their TradingView charts in my analysis.

USD-CHF Will Grow! Buy!
Hello,Traders!
USD-CHF made a retest of
The horizontal support level
Of 0.8318 from where we
Are already seeing a bullish
Rebound so we are locally
Bullish biased and we will
Be expecting a further
Bullish move up
Buy!
Comment and subscribe to help us grow!
Check out other forecasts below too!
Disclosure: I am part of Trade Nation's Influencer program and receive a monthly fee for using their TradingView charts in my analysis.

EUR_USD WILL GO DOWN|SHORT|
✅EUR_USD has retested a
Resistance level of 1.1290
And we are seeing a bearish reaction
With the price going down so we are
Bearish biased now and we will be
Expecting the pair to go further down
SHORT🔥
✅Like and subscribe to never miss a new idea!✅
Disclosure: I am part of Trade Nation's Influencer program and receive a monthly fee for using their TradingView charts in my analysis.

Market next move
1. Bearish Rejection from Resistance
Disruption: The price has struggled to break above the 3,240–3,250 area multiple times. This could indicate strong resistance.
Implication: If the price fails again, we may see a rejection and a move down towards the 3,180–3,160 support range instead of a bullish breakout.
---
2. Volume Analysis Caution
Disruption: The volume during recent upward moves is not significantly higher than the downswings.
Implication: Weak buying volume might not support a strong breakout, suggesting a fakeout could occur.
---
3. False Breakout Possibility
Disruption: A possible fake breakout above the red box might lure in buyers before a reversal.
Implication: Watch for a "bull trap" where the price briefly breaks up and then reverses sharply downward.
---
4. Macro Events Ahead
Disruption: The timing (around May 20) could align with macroeconomic news (e.g., Fed minutes, CPI, etc.).
Implication: News can trigger volatility and negate technical expectations.
---
5. RSI or Momentum Indicators?
Disruption: Without checking RSI or other momentum indicators, the analysis might lack confirmation.
Implication: Overbought/oversold conditions could shift the bias unexpectedly.

Next move Disruption Analysis: Bearish Risk Perspective
1. Sideways Consolidation (Red Box Zone):
The price is consolidating in a tight range between roughly 32.20 and 32.40, showing indecision and potential for either a breakout or breakdown.
Repeated rejections near the top of this box can signal exhaustion of buying pressure.
2. Volume Observation:
There’s no strong volume surge indicating accumulation; volume appears mixed and doesn't strongly support a bullish breakout.
A potential fakeout risk exists if the price spikes above the consolidation range only to fall back in (bull trap).
3. Potential Bearish Breakdown:
If the price breaks below the red box, especially under 32.20, it could trigger stop-losses and initiate a short-term bearish trend.
First downside target: 32.00 psychological level, followed by 31.80 support from previous lows.
4. Wick Rejection on Top:
The recent candles inside the box show long upper wicks — signs of selling pressure at higher levels.

Next target Bearish Disruption Points
1. False Breakout Risk
Price is hovering near the recent highs but hasn’t made a convincing higher high.
A fakeout above 32.42 followed by a sharp rejection could trap buyers and trigger a sell-off.
2. Exhaustion at Resistance
The current level (~32.33–32.42) was a previous distribution zone on May 13–14.
Low volume follow-through may indicate weak buying interest, increasing the odds of a reversal.
3. Bearish Divergence (Potential)
If RSI or MACD shows lower highs while price pushes up, that’s a bearish divergence—a common reversal signal.
(You’d need to check indicators for confirmation.)
4. Support Flip to Resistance
If the price breaks back below the red box (~32.25), the same zone could act as resistance, turning into a supply zone.
5. Volume Clue
Volume appears lower during the recent bullish attempts, hinting at buyer fatigue.
Higher volume on red candles would validate a bearish shift.

“Can You Snatch Profits from USD/CHF’s Wild Swings?”🔥 Swissy Snatch Strategy: USD/CHF Stealth Trade Plan 🔥
👋 Greetings, Profit Pirates & Chart Ninjas! 🕵️♂️💸
Welcome to the Swissy Snatch Strategy—a cunning, calculated raid on the USD/CHF market. This plan fuses razor-sharp technicals with real-time fundamentals to snatch profits from Swissy’s wild swings.
Let’s move like shadows, strike fast, and vanish with the gains! 🌑📈
📜 The Swissy Snatch Blueprint
Entry Triggers 🔑:
🔼 Bullish Ambush: Enter long on a breakout above ~0.86500 (key resistance/EMA level), signaling a potential rally.
🔼 Pullback Ambush: Buy at ~0.85800 (Institutional Trap zone for a dip-buy).
💡 Pro Tip: Set price alerts at these levels to trade without staring at charts! 🔔
Stop Loss (SL) 🛡️:
🟢 Bullish Trade: Place SL below the recent 4H swing low (~0.85300 for breakout trades) to cushion against wicks.
📉 Stay Flexible: Adjust SL based on risk tolerance, lot size, and volatility (ATR ~60 pips daily). This is your safety net!
Take Profit (TP) 💰:
🚀 Bullish Raiders: Target ~0.86900 (Fibonacci 61.8% retracement from 0.9000–0.8200) or exit on fading volume.
🚪 Escape Tactic: Watch RSI for overbought (>70) signals to dodge reversals. Consider partial profits at ~0.86000 (1:1 risk-reward).
🌐 Why Trade USD/CHF Now?
USD/CHF is a volatility goldmine, driven by:
💵 USD Strength: Hawkish Fed signals (e.g., Powell’s May 2025 comments on sustained 4% rates) and robust Q1 2025 GDP (2.8% annualized) fuel USD bullishness, pushing USD/CHF higher.
🇨🇭 CHF Weakness: Swiss National Bank (SNB) holds rates steady at 1.25% (Q4 2024 decision), with low safe-haven demand for CHF due to easing geopolitical tensions (e.g., US-China trade talk progress).
📈 Yield Differentials: US 10-year Treasury yields at 4.2% (May 19, 2025) attract capital to USD, supporting USD/CHF uptrends.
📊 Technical Edge: RSI (14-day) at 52 signals neutral momentum with room for a bullish push. Fibonacci retracement levels highlight resistance at 0.86900 and support at 0.85500.
🎢 Volatility: USD/CHF’s daily ranges of 0.8–1.2% (80–120 pips) offer quick profit potential for agile traders.
Current price (May 19, 2025): ~0.8620, testing resistance at 0.86500.
📊 Real-Time Sentiment Snapshot (May 19, 2025)
Retail Traders:
📈 Bullish: 40% 🌟 (Betting on USD strength).
📉 Bearish: 45% ⚡ (Cautious on CHF safe-haven spikes).
⚖️ Neutral: 15% 🧭 (Awaiting US data clarity).
Institutional Traders:
🏦 Bullish: 60% 🏦 (Favoring USD on yield spreads).
📉 Bearish: 30% 📉 (Hedging for CHF strength).
⚖️ Neutral: 10% ⚖️ (Monitoring Fed/SNB cues).
⚠️ Key Risks:
US CPI: A hotter-than-expected print could spike USD/CHF to 0.8700. A miss may test 0.85500.
SNB: Dovish SNB comments could weaken CHF further, boosting your bullish setup.
Geopolitics: Sudden US-China trade escalations may strengthen CHF, invalidating longs.
Technical Validation (May 19, 2025)
Price Action: USD/CHF at ~0.8620, eyeing resistance at 0.86500–0.8700, with support at 0.85500–0.85800 (4H chart).
EMA: 50-EMA (~0.8600) acts as dynamic support. A breakout above 0.86500 confirms bullish momentum.
Fibonacci: From March 2025 high (0.9000) to April low (0.8200), 61.8% retracement (~0.8680) matches your TP of 0.86900.
RSI (14-day): At 52, room for upside if US data supports USD.
Volume: Rising on recent upticks, supporting breakout potential.
ATR (14-day): 60 pips, guiding SL (50–60 pips) and TP (~100–120 pips).
Strategy Enhancements
To make the Swissy Snatch even deadlier:
Refined Entries: Confirm 0.86500 breakout with volume spike or 0.85800 pullback with RSI >40.
Timeframe Clarity: Use 1H or 4H for entries, 4H for swing lows (SL).
Bearish Contingency: Short below 0.85500 (support break) if CPI disappoints, targeting 0.85000.
ATR Scaling: Adjust SL/TP to ATR (e.g., SL at 1x ATR, TP at 2x ATR) for volatility-adapted trades.
Chart Visuals: For TradingView, annotate EMA, Fib levels, and RSI to boost engagement.
Join the Swissy Snatch Squad!
👉 Smash that Boost button to make this strategy a TradingView legend! 🚀
Every like and share fuels more high-octane trade plans.
Let’s conquer USD/CHF together! 🤜🤛
Keep charts locked, alerts primed, and trading spirit electric.
See you in the profit zone, ninjas! 🏴☠️📈

BITCOIN CORRECTION AHEAD|SHORT|
✅BITCOIN keeps growing in a
Strong uptrend in a narrowing
Bearish wedge pattern and the
Coin has reached a horizontal
Resistance level of 108000$
So IF we see a breakout from
The wedge a local bearish
Correction is to be expected
SHORT🔥
✅Like and subscribe to never miss a new idea!✅
Disclosure: I am part of Trade Nation's Influencer program and receive a monthly fee for using their TradingView charts in my analysis.
