XAGUSD - Short SetupMy main trading principle is that the price always moves from swept liquidity levels to untouched liquidity levels.
In particular case we clearly can see the following context: price swept 1D key liquidity level and left untouched level lower.
But to take more statistically more probable trades we should wait for some time of lower timeframe confirmation. For me the best way to confirm higher timeframe context is structure.
We can notice the break of market structure (sign of weakness) on key liquidity level, so there is a higher probability to see price lower at least on opposite level (marked lower).
Your success is determined solely by your ability to consistently follow the same principles.
Forex-trading

XAUUSD - Short SetupMy main trading principle is that the price always moves from swept liquidity levels to untouched liquidity levels.
In particular case we clearly can see the following context: price swept 1D key liquidity level and left untouched level lower.
But to take more statistically more probable trades we should wait for some time of lower timeframe confirmation. For me the best way to confirm higher timeframe context is structure.
We can notice the break of market structure (sign of weakness) on key liquidity level, so there is a higher probability to see price lower at least on opposite level (marked lower).
Your success is determined solely by your ability to consistently follow the same principles.

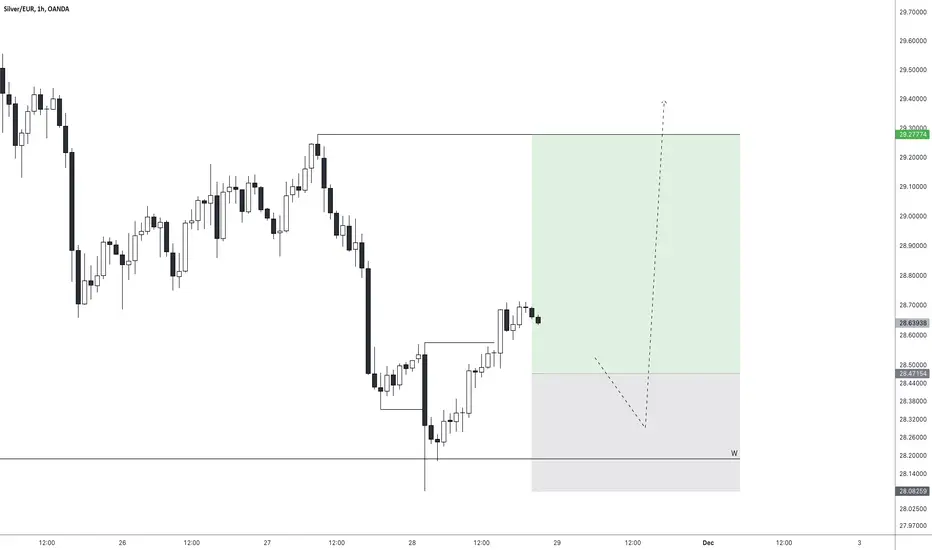
XAGEUR - Long SetupMy main trading principle is that the price always moves from swept liquidity levels to untouched liquidity levels.
In particular case we clearly can see the following context: price swept 1D key liquidity level and left untouched level higher. Also price swept 1W key liquidity, so the probability for some bullish move higher.
But to take more statistically more probable trades we should wait for some time of lower timeframe confirmation. For me the best way to confirm higher timeframe context is structure.
We can notice the break of market structure (sign of strength) on key liquidity level with GAP, so there is a higher probability to see price higher at least on opposite level (marked higher).
Your success is determined solely by your ability to consistently follow the same principles.
USD/JPY faces critical next few weeks as it tests 150 handleThe USD/JPY has rebounded after testing a multi-week low near the 149.00 handle on Monday on the on the back of dovish comments from Fed’s Waller, who said he’s inclined to cut rates in December.
However, with the yen being the biggest performer last week, underscoring expectations about a potential rate hike from the Bank of Japan, just as the world’s other central banks are now on the easing path, there is a good chance the USD/JPY could resume lower.
At the time of writing, it was testing a key pivotal area of around 150.00 ahead of critical US economic releases this week. With a jam-packed calendar including the closely watched JOLTS Job Openings report (today), ISM Services PMI, and the monthly Non-Farm Payrolls report to come, traders are bracing for volatility. These data points are expected to influence the USD/JPY, especially with both the Fed and BoJ policy decisions looming in December.
Should the 149.00-149.10 support area give way, the USD/JPY could drop to the next potential support at 147.20, possibly reaching 144.53 thereafter. The bulls will be eyeing a close above the 151.30 resistance level to nullify the bearish bias. While it is trading around the 150.00 area, it is in no-man's land, with a slight bearish tilt.
By Fawad Razaqzada, market analyst with FOREX.com

AUDNZD: Bullish Move From Support Explained 🇦🇺🇳🇿
AUDNZD may continue growing after a test of key intraday/daily horizontal support.
As a confirmation, I see an inverted head and shoulders pattern on an hourly.
Goal - 1.1022
❤️Please, support my work with like, thank you!❤️

EUR/USD Under Pressure Amid Key Economic EventsThe EUR/USD pair began the week with notable selling pressure, trading near the 1.0500 level at the time of writing. The Asian session opened with a bearish gap that remains uncovered, with the pair declining by nearly 75 pips so far. Market participants are closely watching upcoming events, including a speech by European Central Bank (ECB) President Christine Lagarde and the release of the US ISM Manufacturing Purchasing Managers' Index (PMI) later today.
Technical Outlook
From a technical perspective, the pair’s downward momentum aligns with earlier forecasts, suggesting a potential move toward the next demand zone around 1.0100 in the coming sessions.
Commitment of Traders (COT) Analysis
Recent COT reports reveal that retail traders have increased long positions in the pair, while non-commercial entities remain bearish. This divergence highlights contrasting market expectations. A strong ISM Manufacturing PMI reading could amplify the pair’s downward trajectory, further pressuring the euro.
As the market digests these developments, traders should remain cautious and adapt strategies based on upcoming economic data and central bank commentary.
✅ Please share your thoughts about EUR/USD in the comments section below and HIT LIKE if you appreciate my analysis. Don't forget to FOLLOW ME; you will help us a lot with this small contribution.

Traps Of Technical Analysis: Navigating The Pitfalls For SuccessTechnical and fundamental analyses are cornerstones for understanding how financial markets operate. While technical analysis focuses heavily on graphical representations and past price data, it can lead to significant pitfalls—especially when employed thoughtlessly. This post explores common traps that novice traders often fall into.
1. Indicator Overload
One of the most prevalent mistakes among beginning traders is the overwhelming reliance on too many indicators. The assumption that a greater number of indicators equates to improved accuracy is misguided. In fact, indicators can produce conflicting signals, creating confusion rather than clarity.
Many indicators are designed to promote services or websites rather than provide genuine analytical insights. While a handful of fundamental tools can effectively cover most statistical needs, attempting to integrate 20 different indicators into a single chart is unnecessary and counterproductive. Instead, combining a varied set—such as moving averages, oscillators, support and resistance levels, and chart patterns—can yield more meaningful results.
2. Overlooking Fundamental Analysis
Ignoring fundamental analysis can skew a trader's understanding of market dynamics. Historical signals based on technical indicators may have been influenced by news events, leading to potentially misleading conclusions.
To establish a clear picture, traders should focus on less turbulent timeframes, like the H1, and select periods of low market activity to minimize external influences. Understanding the impact of macroeconomic factors and market makers can significantly enhance the reliability of technical analysis.
3. Misinterpreting Historical Data
Traders often rely on backtesting strategies against historical data, but this approach can be risky. Past performance does not guarantee future results, especially in real trading environments.
While testing strategies is essential, time-consuming optimization can be a poor use of resources. Due to varying quote suppliers among brokers, discrepancies of just a few points can drastically alter outcomes. Many experts suggest improving trader’s instincts by practicing on demo accounts as a more productive alternative to exhaustive backtesting.
4. False Breakouts
False breakouts frequently occur in strategies that depend on channel trading or trend line breakouts. These incidences often arise when market participants react counter to the prevailing trend.
For instance, a price surge that surpasses a resistance level may provoke profit-taking from certain traders, potentially reversing the trend. A nuanced understanding of the market's fundamental basis—such as in crypto markets, where large fund involvement can bolster price movements—can help traders evade premature entries. It’s advisable to remain cautious and wait for confirmation through additional price action before acting on a breakout signal.
5. Ignoring Instrument-Specific Characteristics
Each trading instrument has unique characteristics that influence its behavior, such as volatility and trading volume. Conducting analyses without accounting for these differences can lead to misguided strategies.
For example, cryptocurrencies often exhibit daily fluctuations of 10%, while indices may show changes closer to 2%. Hence, applying identical settings across diverse assets is inappropriate. Understanding the contextual drivers—for example, industry legislation or technological advancements—can illuminate the vulnerabilities of trading strategies.
6. Psychological Traps
The mental aspect of trading is often underestimated, with traders falling prey to cognitive biases such as wishful thinking. A signal may appear strong due to emotional fatigue or the desire to recoup losses, yet that doesn’t validate its authenticity.
Traders must strive to remain objective and grounded, conducting thorough analyses and verifying signals against fundamental factors rather than succumbing to emotional impulses.
7. Neglecting Timeframe Analysis
Focusing solely on a single timeframe, such as H1, can result in missed opportunities and significant oversights. Many traders disregard other timeframes, such as daily and weekly charts, which can provide crucial context to ongoing trends.
An upward trend on the daily chart should ideally reflect in multiple candlesticks on the smaller H4 timeframe. A comprehensive analysis of various timeframes can offer a more rounded view and aid in making informed trading decisions.
📍 Conclusion
Despite meticulous efforts to master technical analysis, errors and pitfalls are inevitable. Acknowledging these traps and actively mitigating their impact is critical in successful trading. Furthermore, incorporating robust risk management techniques and fostering emotional resilience will enhance a trader's journey. Each mistake serves as a valuable learning opportunity, paving the way for continuous growth and adaptation in trading financial markets.
Traders, If you liked this educational post🎓, give it a boost 🚀 and drop a comment 📣

GBP_JPY LONG FROM SUPPORT|
✅GBP_JPY is going down now
But a strong support level is ahead at 189.608
Thus I am expecting a rebound
And a move up towards the target at 191.159
LONG🚀
✅Like and subscribe to never miss a new idea!✅

Are You Trading the Right Zones?Understanding key areas like demand zones, liquidity grabs, and volume profile levels is crucial for consistent success in trading.
Here's how I approach them:
1️⃣ Liquidity Grabs: I wait for the market to grab liquidity from obvious levels. Why? It’s often a signal of institutional players stepping in.
2️⃣ Demand and Supply Zones: These zones are where price historically reverses. Identifying them helps me anticipate high-probability setups.
3️⃣ Volume Profile Insights: Volume tells a story! Zones with strong volume usually act as magnets, drawing price back for a reaction.
🔑 Pro Tip: Patience is key. Wait for confirmation at these levels instead of rushing into a trade.
💬 Let me know—what tools do you use to identify your trade zones?

EUR/USD: A Day of Stagnation Amid Awaited Data ReleasesOn Tuesday, the EUR/USD currency pair showed a lack of direction, closing nearly unchanged and just below the 1.0500 level. As traders navigate the tight range, the pair continues to move sideways early Wednesday. Market participants are particularly focused on upcoming macroeconomic data from the United States, which could influence the USD's trajectory.
In the American trading session on Tuesday, EUR/USD experienced a slight dip, falling below 1.0450, but managed to regain lost ground as investors reacted to mixed economic reports from the US. This volatility in the dollar's strength was further compounded by a subtle improvement in risk appetite among investors, which restricted demand for the USD.
From a technical analysis perspective, there have been no significant changes since the previous day. Currently, the EUR/USD is trading around 1.05150. As we approach the Thanksgiving holiday, the economic calendar for the US is set to release various pivotal data points. One of the key reports expected today is the weekly Initial Jobless Claims from the US Department of Labor, alongside the Durable Goods Orders figures for October, released by the US Census Bureau.
With the euro showing signs of gaining momentum, it raises the likelihood of a potential bearish correction. Traders are advised to approach today's market with caution, as the interplay between new economic data and market sentiment could have immediate implications for the currency pair.
As investor focus shifts to how these forthcoming data releases will affect the valuation of the USD, it remains critical to monitor both macroeconomic indicators and overall market sentiment for trading opportunities in the EUR/USD pair.
✅ Please share your thoughts about EUR/USD in the comments section below and HIT LIKE if you appreciate my analysis. Don't forget to FOLLOW ME; you will help us a lot with this small contribution.

USD/JPY:Yen Recovers as Interventions and Geopolitical Tensions The Japanese Yen has gained some ground against the U.S. Dollar, leading the USD/JPY pair to settle at 154.30 on Friday. This recovery is fueled by speculation that Japanese authorities may intervene in the foreign exchange market to support the domestic currency. Additionally, rising geopolitical tensions are providing further backing for the safe-haven JPY.
Though the Yen is finding support, a slight decline in the U.S. Dollar is also helping to limit the upward movement of the currency pair. As noted in our previous discussion, the Dollar Index (DXY) appeared poised for a retracement. However, at the time of writing, the USD has managed to regain some strength against the JPY, trading around 154.72.
Analysis from the Commitment of Traders (COT) report suggests a potential reversal in the market's direction. Furthermore, historical seasonality trends indicate a possible shift toward bearish conditions, reflecting patterns observed over the last decade. This raises the possibility of continued bearish momentum for the USD/JPY pair moving forward.
✅ Please share your thoughts about USD/JPY in the comments section below and HIT LIKE if you appreciate my analysis. Don't forget to FOLLOW ME; you will help us a lot with this small contribution.

AUD/CAD 30m Trade Setup Looking at the 30-minute chart, we see a clear IMB (Imbalance) that price seems to be targeting, coupled with liquidity resting above ($$$).
Game plan:
If the price continues its upward move, it may tap into the liquidity zone, filling the imbalance before a potential retracement.
Watching closely for reactions at the 0.91500–0.91666 zone, where confluence is strongest.
Bias:
Bearish pullback expected after liquidity is grabbed. Waiting for confirmations before entering short.
What’s your take on this setup? Are you looking to trade the bounce or the breakout? Let me know your strategy below!👇

GBP/USD: Analysis , Can the Pound Find Support at 1.2400?The Pound Sterling is experiencing a sustained bearish trend, remaining under significant pressure following President-elect Donald Trump's recent announcement of a proposed 25% tariff on imports from Mexico and Canada, alongside a 10% increase on all imports from China to the United States. These developments are likely to strengthen the U.S. Dollar further, potentially driving the Pound and other currencies into another bearish phase against the Dollar.
As the market digests these tariff implications, investors are wary of the potential economic repercussions, especially as they pertain to trade relationships. The insistence on higher tariffs could lead to retaliatory measures from affected countries, creating uncertainty that weighs heavily on the Pound.
Looking ahead, analysts are closely watching the 1.2400 mark, which is recognized as a potential demand zone for the Pound. If the currency falls to this level, it may attract buying interest from traders looking to capitalize on a rebound. However, the overall sentiment appears to favor further bearish movement unless there are significant changes in the economic landscape or policy shifts.
In this volatile environment, market participants are advised to remain vigilant, as the unfolding situation may present both risks and opportunities.
✅ Please share your thoughts about GBP/USD in the comments section below and HIT LIKE if you appreciate my analysis. Don't forget to FOLLOW ME; you will help us a lot with this small contribution.

EUR/USD Still Under Pressure: Understanding Market DynamicsEUR/USD has recouped some of its daily losses, hovering around 1.0510 during the London trading session. Initially, the currency pair experienced a decline in response to deteriorating market sentiment triggered by President-elect Donald Trump's announcement of a proposed 25% tariff on imports from Mexico and Canada, as well as a 10% increase on all Chinese imports entering the United States. While the pair has made some recovery during the London session, a bearish outlook persists.
The currency pair has suffered a substantial decline from the 1.0900 mark and faced resistance at the 1.0400 level, which serves as a key demand zone. There is potential for further downward movement, with the next significant demand area identified at 1.0100.
Federal Reserve Bank of Chicago President Austan Goolsbee has indicated that the Federal Reserve is likely to pursue a strategy of lowering interest rates towards a neutral stance, one that neither stimulates nor restricts economic growth.
Meanwhile, market expectations have fully incorporated a 25 basis point cut by the European Central Bank (ECB) in December. Moreover, the probability of a more significant 50 basis point reduction has surged to 58%, reflecting growing market concerns about the economic outlook in the region.
From our perspective, further declines in the currency pair could be anticipated.
✅ Please share your thoughts about EUR/USD in the comments section below and HIT LIKE if you appreciate my analysis. Don't forget to FOLLOW ME; you will help us a lot with this small contribution.

Trader Health: Preventing Common IssuesThe life of a trader, while exhilarating and financially rewarding, can also be fraught with unique health challenges that often go unrecognized until it’s too late. Unlike traditional jobs that offer the flexibility of sick leave and ensure a steady income during times of illness, traders operate within a high-stakes environment that demands their constant attention and decision-making. This reality places the responsibility of health maintenance squarely on the shoulders of the individual. In this post, we will explore some of the most prevalent health issues faced by traders and offer practical steps for prevention and management.
THE VITAL IMPORTANCE OF HEALTH FOR TRADERS
📍 Eye Strain and Visual Fatigue
One of the most frequent complaints among traders is eye strain, resulting from prolonged hours spent gazing at computer screens. The desire to capitalize on market opportunities often leads to extended periods of focus, which can take a toll on one's vision. To combat this common issue, traders are encouraged to:
🔹 Take Regular Breaks: Step away from the computer every two hours for at least 15 minutes to give your eyes a rest.
🔹 Utilize Diverse Strategies: Employ trading strategies that require varying levels of focus, such as alternating between short- and long-term trades. Utilizing indicators that visualize data with color-coded areas can also help reduce mental fatigue.
🔹 Practice Eye Exercises: Remember to blink frequently and shift your gaze to distant objects to alleviate strain.
🔹 Seek Medical Advice: At the first sign of visual discomfort, it’s wise to consult a healthcare professional and consider taking a break from trading.
📍 Musculoskeletal Disorders
Another significant health concern for traders is the risk of musculoskeletal disorders, including back pain and arthritis, often resulting from poor posture and extended sedentary behavior. To mitigate these risks, consider the following recommendations:
🔸 Maintain Proper Posture: Sit upright with a supportive chair and keep your screen at eye level to reduce neck strain.
🔸 Strengthen Core Muscles: Engage in regular exercises to strengthen back muscles and improve overall posture.
🔸 Change Positions Frequently: Avoid staying in one position for too long; adjust your seating arrangement or take short walks to foster movement.
📍 Psychological Well-being
Traders are also susceptible to psychological challenges, including anxiety, sleep disturbances, and addictive behaviors. The pressure to perform can create a vicious cycle of overwork and emotional strain. Address this by:
⚫️ Recognizing Signs of Stress: Be aware of the symptoms of burnout and take proactive steps to manage your workload and emotional well-being.
⚫️ Diversifying Activities: Engage in hobbies unrelated to trading to provide mental relief and prevent burnout.
⚫️ Building a Support Network: Establish connections with fellow traders or mentors to share experiences and cultivate a positive outlook on trading.
📍 Combating Harmful Habit
In an effort to cope with the stresses of trading, some may turn to alcohol or excessive caffeine. While these substances may offer temporary relief, they can lead to detrimental health effects. Instead, opt for healthier leisure activities that promote relaxation and physical health, such as:
▶️ Physical Exercise: Incorporate regular physical activity into your routine, whether through swimming, cycling, or even visiting a shooting range.
▶️ Mindfulness and Relaxation Techniques: Engage in practices such as yoga or meditation to enhance mental clarity and resilience.
📍 The Importance of Physical Activity
Prolonged periods of inactivity can lead to various health problems, including cardiovascular issues, obesity, and muscle atrophy. To counteract these effects, traders should aim to:
🔔 Break Up Sitting Time: Set a timer to remind yourself to stand and stretch or walk around every hour.
🔔 Engage in Regular Exercise: Incorporate both cardiovascular and strength-training workouts into your weekly schedule to maintain overall health.
📍 Conclusion
In the dynamic world of trading, safeguarding your health is paramount for sustained success and well-being. The rigors of this profession present unique physical and psychological challenges that, if left unaddressed, can lead to serious health implications. Ultimately, recognizing the signs of stress and prioritizing self-care is essential for achieving a balanced and productive trading career. As we navigate the complexities of the financial markets, let us also commit to prioritizing our health. The journey of a trader should not only be measured in financial gains but also in the quality of life lived.
Traders, If you liked this educational post🎓, give it a boost 🚀 and drop a comment 📣

Is GBP/USD Set for a Further Rally? Let's have a look.The GBP/USD pair made a robust recovery at the beginning of the week, showcasing strength against its major competitors. This bounce-back comes after a notable decline on Friday, triggered by disappointing economic data. Specifically, the UK Retail Sales contracted at a faster-than-anticipated rate in October, and the flash S&P Global/CIPS Composite Purchasing Managers’ Index (PMI) for November fell below the critical 50.0 mark for the first time since October 2023.
The primary factor contributing to the Pound Sterling's resurgence appears to be strong market sentiment regarding the Bank of England's (BoE) potential for a more measured approach to policy easing compared to other Western central banks. Notably, the currency is trading within a demand zone, suggesting the potential for upward movement. Additionally, the Commitment of Traders (COT) report indicates that retail sentiment is leaning bearish; however, similar to the EUR/USD, the opening gap might be filled, which could lead to a further decline in prices.
A decline towards the 1.2400 level could present an attractive buying opportunity for those looking to acquire the Pound at a discount. Historical seasonality trends also indicate a likelihood for the GBP to appreciate in the near term. Nevertheless, I recommend waiting until Wednesday, following the release of the USD unemployment data, before making any trading decisions. Currently, my outlook remains bearish on the GBP/USD.
GBP/USD GAP
✅ Please share your thoughts about GBP/USD in the comments section below and HIT LIKE if you appreciate my analysis. Don't forget to FOLLOW ME; you will help us a lot with this small contribution.

EUR/USD Outlook: Strong Demand and Uncertain Economic SignalsThe EUR/USD pair has experienced a notable rebound, aligning with our previous outlook as it approached a robust weekly demand zone at the onset of the new weekly candle, marked by a bullish gap. Recent data from Germany indicates a decline in the IFO Current Assessment Index, dropping to 84.3 in November from 85.7. Meanwhile, the Expectations Index decreased slightly from 87.3 to 87.2. Despite these figures, the euro appears resilient, seemingly brushing off the negative data.
On the other hand, downward pressure on the US dollar remains limited, fueled by recent economic indicators that suggest the Federal Reserve might be inclined to scale back the pace of interest rate cuts. This week’s unemployment claims data, set to be released on Wednesday, has the potential to move the markets significantly, especially if the figures come in more favorable than the forecast, which anticipates an uptick in unemployment.
Interestingly, there is the possibility of an upward thrust in the weekly DXY chart, although it has yet to be confirmed by trading volumes.
Given the current market dynamics, it may be prudent to hold off on making any moves until Wednesday. This will allow traders to assess potential retracement opportunities as the market may look to recover the gap created during the Asian session.
EUR/USD Gap
✅ Please share your thoughts about EUR/USD in the comments section below and HIT LIKE if you appreciate my analysis. Don't forget to FOLLOW ME; you will help us a lot with this small contribution.

Understanding Leverage in Forex: Steep Risks and Big RewardsLeverage is the not-so-secret sauce to accelerate your gains at breakneck speed or blow up the entire operation if you don’t know what you’re doing (or you just want too much.) It’s a simple concept with profound implications—a multiplier that lets traders control positions far larger than the capital they actually have. Sounds like a dream, right? But in forex , dreams can turn into nightmares faster than you can say “margin call.”
Let’s unravel this seductive, high-stakes game changer.
❔ What Is Leverage?
“We were always leveraged to the hilt when we bought something and ran out of money, we would look at the portfolio and push out whatever appeared to be the least attractive item at that point,” explains Jim Rogers, George Soros’s partner, in Jack D. Schwager’s book “Market Wizards: Interviews with Top Traders.”
At its core, leverage is borrowed capital. When you trade with leverage, you’re essentially using your broker’s money to amplify the size of your position. Let’s say you want to invest $1,000 and use a leverage ratio of 100:1. This means you can control a position worth $100,000. A small 1% movement in your favor equals $1,000 in profit—doubling your initial investment in a single move. Sounds good, doesn’t it?
But here’s the catch: leverage works both ways. A 1% move against you wipes out your entire $1,000. It’s the double-edged sword that can turn modest accounts into heavyweights—or into dust.
🧲 The Allure of Amplified Gains
Forex traders are drawn to leverage like moths to a flame, and for good reason. The ability to turn small price movements into significant profits is exhilarating and means you don’t have to chip in gargantuan amounts of cash to make bank.
In a market where currency pairs often move fractions of a percentage daily, leverage is what makes those movements meaningful. Without it, most traders would struggle to eke out gains worth their time.
Consider a scenario where you’re trading a major currency pair like the EUR/USD . The price moves 50 pips in your favor, and each pip is worth $10 on a standard lot. Without leverage, you might only afford a micro lot, making your profit $5—not exactly a game changer. But with 100:1 leverage, you control a full lot, turning that $5 into $500. Suddenly, your modest deposit has real firepower.
This potential for outsized returns is intoxicating, especially for new traders. But like any powerful tool, misuse can be catastrophic.
💣 The Flip Side: Risks That Loom Large
If leverage is the hero of ever-moving forex trading space , it’s also the villain. For every dollar it helps you earn, it can take away just as quickly. While a 50-pip move in your favor feels like striking gold, the same move against you might be a financial disaster.
Even seasoned traders aren’t immune to the dangers of leverage. The forex market is inherently volatile, with prices influenced by everything from central bank policies to geopolitical tensions. Leverage amplifies these fluctuations, turning minor market noise into account-draining chaos if you’re not prepared.
Here’s the brutal truth: most traders underestimate the risks of leverage. Maybe because it’s so common they’ve gotten used to it. Overleveraging—taking on more risk than your account can handle—is the silent account killer. And it doesn’t take a market meltdown to wreck your balance. A sudden spike caused by unexpected news or a tweet can trigger a margin call, leaving you with nothing but a hard lesson.
🤙 Margin Calls: The Grim Reality
Let’s talk about margin calls, the dreaded phone call (once upon a time) no trader wants to receive—except it’s not a phone call anymore. It’s an automated popup notification from your broker informing you that your account equity has fallen below the required margin. Essentially, you’ve run out of money to sustain your positions and the broker is stepping in to close them before you owe more than your account balance.
This is where overleveraged and undercapitalized traders often meet their doom. A market move that would’ve been a minor setback on a properly sized position becomes a catastrophic loss when leverage is maxed out and equity is dried up. The lesson? Never let your enthusiasm for big trades overshadow your need for risk management.
🎯 Mastering Leverage: The Balanced Approach
Leverage isn’t inherently bad—it’s neutral. Like any tool, its impact depends on how it’s used. Successful traders respect leverage. They don’t treat it as a shortcut to riches but as a calculated risk multiplier.
Risk management is the cornerstone of surviving—and thriving—in a leveraged environment. This includes using stop-loss orders to limit potential losses, never risking more than an acceptable percentage of your account on a single trade and maintaining sufficient margin to weather market fluctuations.
And let’s not forget the importance of choosing the right leverage ratio. Many brokers offer leverage as high as 500:1, but that doesn’t mean you should take it. A lower ratio, like 10:1 or 20:1, gives you more breathing room and reduces the chances of wiping out your account. And if you decide to go for the upper echelons of leverage, say 100:1, then you should consider scaling down your positions to get that same breathing room.
🤔 The Psychology of Leverage
Leverage does more than magnify financial outcomes; it amplifies emotions too. The thrill of quick profits can lead to overconfidence, while the fear of losses can paralyze decision-making. Understanding your psychological tendencies is crucial when trading with leverage.
Patience and discipline are your best allies. Stick to your trading plan, avoid impulsive decisions, and don’t let the lure of high leverage cloud your judgment. The goal here isn’t just to make money once or twice—it’s to stay in the game for as long as possible.
So, how do you handle leverage? Are you the as-good-as-your-last-trade trader or you’re the more cautious, risk-averse type? Comment below and let’s spin up the discussion!

Gold confirm buy here is opportunity read the caption he USD rallied hard on Wednesday, tracking the sharp gains in the US bond yields as traders reinforced the Trump trades optimism, digesting hawkish Fed commentary and poor 20-year bond auction results.
Most of the Fed officials who spoke on Wednesday sound a bit hawkish, prompting markets scale back their expectations of a 25 basis points (bps) interest rate cut in December

NZD/USD: Demand Zone Fuels Upward MomentumDespite today’s slight retracement of the New Zealand Dollar, the currency pair has demonstrated significant resilience, gaining ground from a recent low of 0.5835. This price point coincided with a notable rebound in a crucial demand zone, indicating that buyers are actively stepping in to support the currency. As the market dynamics unfold, it’s evident that buyers have made further progress, successfully pushing back against sellers' attempts to gain control. Technical indicators reveal that the market is still in recovery mode, suggesting a continuation of this upward momentum.
From a technical analysis perspective, the sustained presence above the demand area bodes well for a longer bullish trend. This aligns with the current market narrative where the Commitment of Traders (COT) report signals that retail traders remain predominantly bearish. Such positioning can be advantageous for bullish traders; if the broader market sentiment shifts, a sudden price surge may occur as bearish positions are unwound.
Furthermore, the interplay of support and resistance levels in the market reinforces the potential for further upward movement. The established demand zone acts as a crucial floor, providing a solid foundation for future price increases. As buyers continue to assert themselves, we may witness a re-accumulation phase that sets the stage for a break above significant resistance points.
In light of these factors, we are closely monitoring the market for signs of a price resurgence in a long setup. The combination of technical indicators suggesting recovery, the presence of strong demand, and the positioning of retail traders creates a favorable environment for bullish plays. Thus, we anticipate that the New Zealand Dollar may poised to climb higher, presenting potential opportunities for traders looking to capitalize on the resurgent momentum in this currency pair. As the situation develops, all eyes will be on how buyers respond to any forthcoming market signals.
✅ Please share your thoughts about NZD/USD in the comments section below and HIT LIKE if you appreciate my analysis. Don't forget to FOLLOW ME; you will help us a lot with this small contribution.

AUD/USD: Bullish Momentum Amid RBA SupportThe AUD/USD currency pair has showcased a notable bullish momentum over the past three days, reflecting a growing confidence among traders in the Australian Dollar's strength. However, as the London session commenced today, the pair has experienced a slight retracement, drawing attention to its position within a significant demand zone. This area is not only crucial for potential price reversals but also indicates that traders are actively watching for signs of a possible trend continuation.
Central to the pair's performance is the Reserve Bank of Australia's (RBA) hawkish monetary policy stance. Recent developments from the RBA have painted a picture of cautious optimism regarding the Australian economy. Specifically, the minutes released from the RBA's November meeting on Tuesday underscored the board's alertness to the risks of rising inflation. The minutes affirmed the RBA's belief that monetary policy must remain firmly restrictive to combat these inflationary pressures, which has significant implications for the AUD/USD pair.
This hawkish outlook from the RBA may serve to bolster the Australian Dollar, as it implies that interest rates could remain elevated or potentially rise further. Such a stance tends to attract investors seeking higher returns, which can lead to increased demand for the AUD. Consequently, this may deter traders from making aggressive bearish bets against the Australian Dollar, providing a supportive environment for the currency pair.
In terms of technical analysis, we are observing key indicators that suggest a potential price surge. Historical price patterns, combined with recent market movements, indicate that the pair could be poised for a rebound. Additionally, the latest Commitments of Traders (COT) report supports this outlook, as it reveals positioning trends among institutional traders that align with our bullish expectations.
Overall, the combination of a supportive fundamental backdrop, characterized by the RBA's vigilant stance on inflation, alongside favorable technical signals, suggests that the AUD/USD pair is likely to regain upward momentum in the near term. Traders will want to keep a close watch on upcoming economic data and central bank communications, as they could further influence market sentiment and the direction of the pair in the coming days.
✅ Please share your thoughts about AUD/USD in the comments section below and HIT LIKE if you appreciate my analysis. Don't forget to FOLLOW ME; you will help us a lot with this small contribution.

GBP/USD: Pound Soars Following Surprising CPI ReportOn Wednesday, the Pound Sterling (GBP) saw a significant surge against most currencies following the release of unexpected inflation data from the UK's Office for National Statistics (ONS). The Consumer Price Index (CPI) revealed that annual inflation rose to 2.3% in October, surpassing analysts' forecasts of 2.2% and a notable increase from September's 1.7%.
Month-over-month, the headline inflation climbed by 0.6%, outpacing the anticipated 0.5% and recovering from a stagnant September.
In addition, the core CPI, which excludes fluctuating components such as food, energy, and tobacco, registered a growth of 3.3%. This figure exceeds the previous month's reading of 3.2% and defies economists' predictions of a decline to 3.1%.
Services inflation—a key metric monitored by Bank of England (BoE) policymakers—also picked up, rising to 5% from the earlier figure of 4.9%. This uptick in price pressures may prompt traders to rethink their expectations regarding interest rate cuts in the upcoming BoE meeting scheduled for December.
From a technical analysis perspective, the price action remains within a bullish demand zone, suggesting a strong likelihood of further appreciation in the value of the Pound.
Overall, indications point towards a potential increase in the Pound Sterling's value moving forward.
✅ Please share your thoughts about GBP/USD in the comments section below and HIT LIKE if you appreciate my analysis. Don't forget to FOLLOW ME; you will help us a lot with this small contribution.

Gold wants to hit resistance read the caption Gold’s negative correlation with the USD seems to be in full swing over the past week, as gold’s price practically retreat until Friday, while as the current week started gold’s price seems to have regained its confidence to climb higher. On the flip side USD bulls dominated the greenback’s direction over the past week, while they took a break as the week begun allowing for gold’s price to rise. Overall we see the case for the negative correlation
