EUR_USD BEARISH BREAKOUT|SHORT|
✅EUR_USD was trading along
The rising support line but
Now we are seeing a strong bearish
Breakout and the breakout is
Confirmed so we are bearish
Biased and we will be expecting
A further bearish move down
After the potential pullback
SHORT🔥
✅Like and subscribe to never miss a new idea!✅
Disclosure: I am part of Trade Nation's Influencer program and receive a monthly fee for using their TradingView charts in my analysis.
Forex-trading

CAD-JPY Strong Bullish Breakout! Buy!
Hello,Traders!
CAD-JPY keeps trading in a
Strong uptrend and the pair
Made a strong bullish breakout
Of the key horizontal level
Of 108.299 so we are bullish
Biased and we will be expecting
A further bullish move up
Buy!
Comment and subscribe to help us grow!
Check out other forecasts below too!
Disclosure: I am part of Trade Nation's Influencer program and receive a monthly fee for using their TradingView charts in my analysis.

EUR/USD drops post US CPI reportAfter gaining ground last week, the US dollar initially came under slight pressure earlier today. However, it regained momentum in the aftermath of a mixed US inflation report. Despite the nuanced inflation print, market expectations around interest rate policy remained largely unchanged. Investors continue to anticipate a slower pace of rate reductions, a sentiment that could further weigh on the EUR/USD pair—provided confidence in the Federal Reserve’s monetary approach remains intact.
Mixed Signals from US Inflation Data
The consumer price index for June presented a mixed picture. Headline CPI increased by 0.3% month-over-month and 2.7% year-over-year, surpassing both the previous 2.4% figure and the 2.6% forecast. However, core CPI (which excludes food and energy) showed a slightly softer reading, rising by only 0.2% month-on-month—below the expected 0.3%. The annual core rate stood at 2.9%, in line with expectations.
This mixed data has not allayed fears that inflation could remain sticky for longer. As a result, the Fed may hold off on aggressive rate cuts, although a possible move in September remains on the table.
Adding to the dollar’s bullish case, President Trump has proposed aggressive tariffs—35% on select Canadian goods and up to 30% on imports from Mexico and the EU—if no agreements are reached by August 1. These protectionist threats, combined with his expansive fiscal agenda, could drive inflation higher and bolster the dollar if market faith in US policy stays strong.
Euro Zone Data Shows Resilience, But the Euro Falters
Despite some encouraging macroeconomic indicators from the Eurozone, the euro slipped. Germany’s ZEW economic sentiment index rose to 52.7, outperforming both expectations (50.8) and the previous reading (47.5). Additionally, industrial production climbed 1.7% month-on-month, beating forecasts.
While these positive data points reflect a degree of resilience in the euro area, trade tensions are looming. The European Union has said it will retaliate on US products—ranging from aircraft to alcohol—should trade talks collapse or fail to yield agreements by the August 1 deadline.
Technical Outlook
Technically, EUR/USD breached the bullish trendline established since Q1, a development that bears are watching as the session wears on. Currently, the pair is testing a key support zone between 1.1570 and 1.1630—an area that served as resistance in both April and mid-June before the rally that followed.
Should prices fall decisively below this support today or in the coming days, the technical bias could shift bearish. On the upside, resistance lies at 1.1700 and 1.1750. A break above these levels would clear the way for bulls to target a fresh 2025 high above 1.1830.
By Fawad Razaqzada, market analyst with FOREX.com

Falling Wedge Formation Ive been bullish on GBPJPY for a couple weeks now and I still believe that it has more upside potential. Here we have a Falling Wedge Formation. we have 4 touches on our pattern already and just waiting for a break and retest to enter again. I am currently in a position based of the retest price gave of the previous resistance (circled on chart). Lets see how it goes.

GBP_CHF SWING LONG|
✅GBP_CHF is set to retest a
Strong support level below at 1.0650
After trading in a strong downtrend for some time
Which makes a bullish rebound a likely scenario
With the target being a local resistance above at 1.0750
LONG🚀
✅Like and subscribe to never miss a new idea!✅
Disclosure: I am part of Trade Nation's Influencer program and receive a monthly fee for using their TradingView charts in my analysis.

GBP-CAD Support Ahead! Buy!
Hello,Traders!
GBP-CAD keeps falling down
But a strong horizontal support
Level of 1.8322 is ahead so after
The retest we will be expecting
A local bullish rebound
Buy!
Comment and subscribe to help us grow!
Check out other forecasts below too!
Disclosure: I am part of Trade Nation's Influencer program and receive a monthly fee for using their TradingView charts in my analysis.

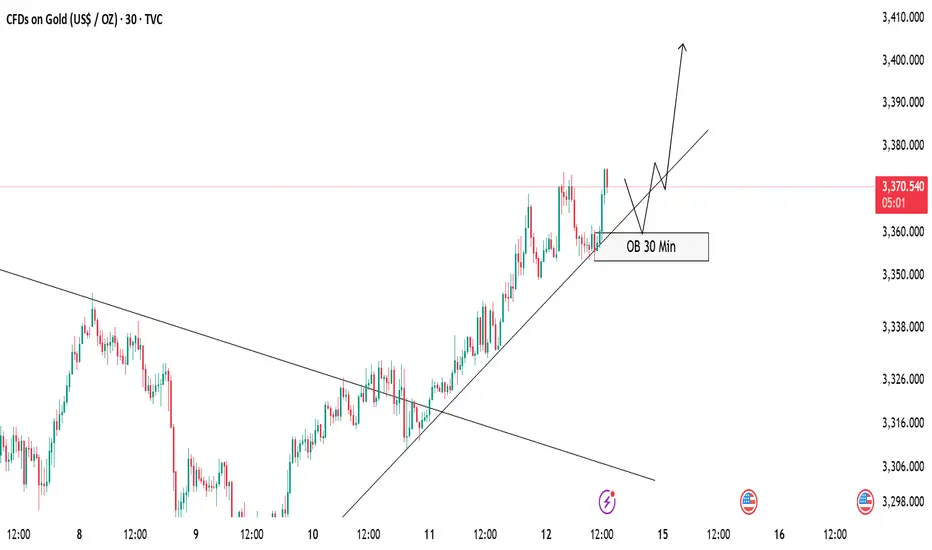
GOLD Buy Setup – OB Zone in FocusCurrently, gold is respecting the ascending trendline and maintaining a bullish structure 🟢. Price hasn’t tapped into the 30 Min Order Block (OB) yet, but we are expecting a potential pullback into this OB zone 📍.
✅ Our Plan:
We will wait patiently for price to mitigate the OB.
After the tap, we will look for bullish confirmation (rejection wick, bullish engulfing, or break of minor structure) before entering a buy position 🚀.
As long as the trendline holds, we remain bullish on gold.
📝 Invalidation:
If price breaks and closes below the trendline and OB zone, we will stay out or re-evaluate the setup ❌.
Stay disciplined and follow the plan! 💪
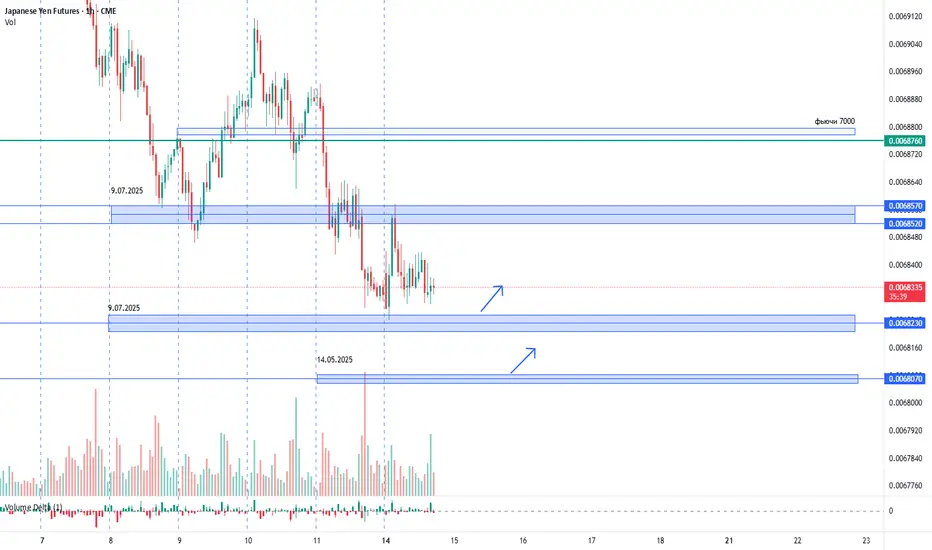
USDJPY. 14.07.2025. The plan for the next few days.The nearest interesting resistance zones have already been worked out at night and have given a good reaction. Let's mark the others where we can expect a reaction. It's not certain that there will be a major reversal, but I believe we will see a correction that can be monetized. We are waiting for a reaction and looking for an entry point.
The post will be adjusted based on changes.
Don't forget to click on the Rocket! =)
GBP_USD RISING SUPPORT AHEAD|LONG|
✅GBP_USD is going down now
But a strong rising support level is ahead
Thus I am expecting a rebound
And a move up towards the target of 1.3600
LONG🚀
✅Like and subscribe to never miss a new idea!✅
Disclosure: I am part of Trade Nation's Influencer program and receive a monthly fee for using their TradingView charts in my analysis.

EUR-CHF Local Long! Buy!
Hello,Traders!
EUR-CHF is about to retest
The strong horizontal support
Of 0.9298 and as the pair
Is locally oversold we will be
Expecting a local bullish
Rebound and a move up
Buy!
Comment and subscribe to help us grow!
Check out other forecasts below too!
Disclosure: I am part of Trade Nation's Influencer program and receive a monthly fee for using their TradingView charts in my analysis.

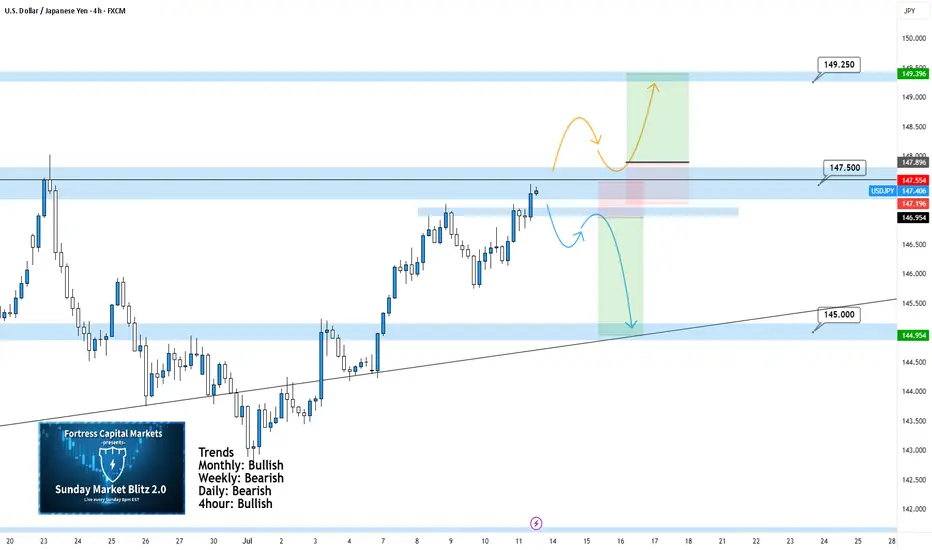
USDJPY 4Hour TF - July 13th, 2025USDJPY 7/13/2025
USDJPY 4Hour Neutral Idea
Monthly - Bullish
Weekly - Bearish
Daily - Bearish
4Hour - Bullish
Finally UJ is looking more clear. We’re now able to drop to the 4Hour instead of the Daily TF due to price action reaching a major zone of anticipated reactions.
As always we’re looking at two trade scenarios going into the week ahead:
Bullish Continuation - UJ is currently sitting at 147.500 resistance and closed there last week. Going into this week we could see the bullish trend continue but we would need to see a clear break of 147.500 resistance to gain confidence. Look for a higher low confirmed above 147.500 followed by strong bullish setups to enter long on. Look to target higher toward major resistance levels like 149.250 area.
Bearish Reversal: Despite the strong bullish momentum we saw from last week, a reversal is still possible as price action is near our 147.250 zone. In order to consider bearish setups we would need to see strong rejection from the current level of resistance. Look to target lower toward 145.000 support.
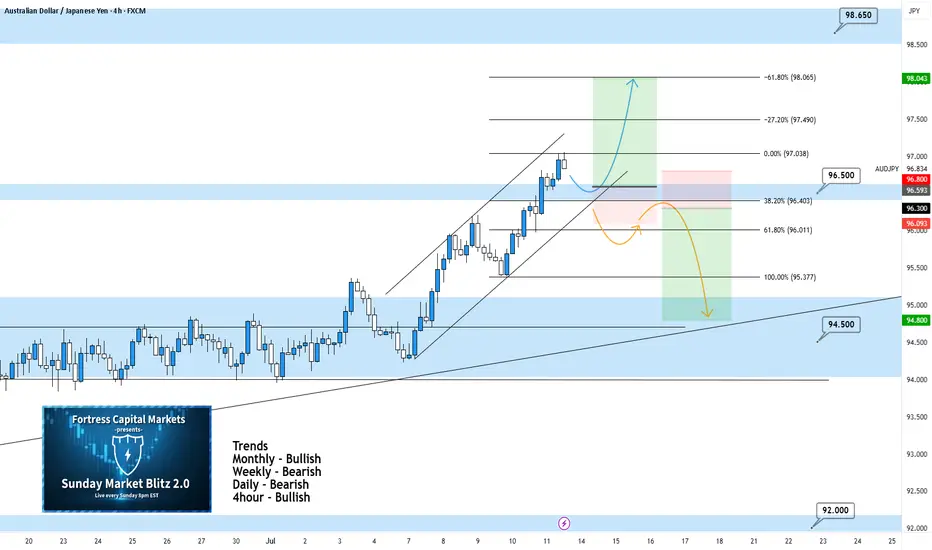
AUDJPY 4Hour TF - July 13th, 2025AUDJPY 7/13/2025
AUDJPY 4hour Bullish Idea
Monthly - Bullish
Weekly - Bearish
Dailly - Bearish
4hour - Bullish
Looking good on AJ! Last week’s analysis played out perfectly and we can see going into this week we have a similar scenario.
Here are the two potential trade paths for the week ahead:
Bullish Continuation - This is the most likely scenario going into this week as we just broke our 96.500 resistance and are now testing it as support. If we can confirm a higher low with strong bullish conviction we can look to enter long and target higher toward major resistance levels.
Bearish Reversal - For us to consider AJ bearish we would first need to see a break back below 96.500. If we can spot a clear trend change and some lower highs below 96.500 we can begin looking short. Target lower toward major support levels if this happens.
GBP-AUD Risky Long! Buy!
Hello,Traders!
GBP-AUD keeps falling and
The pair is locally oversold
So as the pair is retesting
The horizontal support
Of 2.0480 we will be expecting
A local bullish correction
On Monday
Buy!
Comment and subscribe to help us grow!
Check out other forecasts below too!
Disclosure: I am part of Trade Nation's Influencer program and receive a monthly fee for using their TradingView charts in my analysis.

EUR-USD Will Keep Growing! Buy!
Hello,Traders!
EUR-USD keep trading in
An uptrend along the rising support
So as the pair is approaching
A the support we will be
Expecting a bullish rebound
And a move up on Monday
Buy!
Comment and subscribe to help us grow!
Check out other forecasts below too!
Disclosure: I am part of Trade Nation's Influencer program and receive a monthly fee for using their TradingView charts in my analysis.

EUR_AUD WILL GO UP|LONG|
✅EUR_AUD is trading in an uptrend
And the bullish bias is confirmed
By the rebound we are seeing
After the pair retested the support
So I think the growth will continue
LONG🚀
✅Like and subscribe to never miss a new idea!✅
Disclosure: I am part of Trade Nation's Influencer program and receive a monthly fee for using their TradingView charts in my analysis.

AUD_JPY IS OVERBOUGHT|SHORT|
✅AUD_JPY is trading in a strong
Uptrend but the pair is now
Locally overbought so after the
Pair hits the horizontal resistance
Level of 97.350 we will be expecting
A pullback and a bearish correction
On Monday!
SHORT🔥
✅Like and subscribe to never miss a new idea!✅
Disclosure: I am part of Trade Nation's Influencer program and receive a monthly fee for using their TradingView charts in my analysis.

GBP-CHF Bearish Breakout! Sell!
Hello,Traders!
GBP-CHF is trading in a strong
Downtrend and the pair
Broke the key horizontal
Level around 1.0780 which
Reinforces our bearish
Bias and we will be
Expecting a further
Bearish move down
On Monday!
Sell!
Comment and subscribe to help us grow!
Check out other forecasts below too!
Disclosure: I am part of Trade Nation's Influencer program and receive a monthly fee for using their TradingView charts in my analysis.

EUR_CAD GROWTH AHEAD|LONG|
✅EUR_CAD went down to retest
A horizontal support of 1.5964
Which makes me locally bullish biased
And I think that a move up
From the level is to be expected
Towards the target above at 1.6040
LONG🚀
✅Like and subscribe to never miss a new idea!✅
Disclosure: I am part of Trade Nation's Influencer program and receive a monthly fee for using their TradingView charts in my analysis.

EUR-AUD Bullish Bias! Buy!
Hello,Traders!
EUR-AUD went down but
A strong horizontal support
Level is below around 1.7690
And as the pair is trading in
An uptrend we will be expecting
A round and a move up
On Monday!
Buy!
Comment and subscribe to help us grow!
Check out other forecasts below too!
Disclosure: I am part of Trade Nation's Influencer program and receive a monthly fee for using their TradingView charts in my analysis.

EUR_NZD RESISTANCE AHEAD|SHORT|
✅EUR_NZD has been growing recently
And the pair seems locally overbought
So as the pair is approaching a horizontal resistance of 1.9500
Price decline is to be expected
SHORT🔥
✅Like and subscribe to never miss a new idea!✅
Disclosure: I am part of Trade Nation's Influencer program and receive a monthly fee for using their TradingView charts in my analysis.

USD-JPY Short From Resistance! Sell!
Hello,Traders!
USD-JPY keeps growing but
A strong horizontal resistance
Is ahead around 148.500
So after the retest we will
Be expecting a local
Bearish correction on Monday!
Sell!
Comment and subscribe to help us grow!
Check out other forecasts below too!
Disclosure: I am part of Trade Nation's Influencer program and receive a monthly fee for using their TradingView charts in my analysis.

GBP-USD Swing Long! Buy!
Hello,Traders!
GBP-USD is trading in a
Long-term uptrend along
The rising support support
Line and the pair will soon
Hit it and from there we will
Be expecting a bullish
Rebound on Monday
Buy!
Comment and subscribe to help us grow!
Check out other forecasts below too!
Disclosure: I am part of Trade Nation's Influencer program and receive a monthly fee for using their TradingView charts in my analysis.

EUR_USD STRONG UPTREND|LONG|
✅EUR_USD is trading in an uptrend
With the pair set to retest
The rising support line
From where I think the growth will continue
LONG🚀
✅Like and subscribe to never miss a new idea!✅
Disclosure: I am part of Trade Nation's Influencer program and receive a monthly fee for using their TradingView charts in my analysis.
