DXY 4Hour TF - August 3rd,2025🟦 DXY 4H Analysis Neutral idea
📅 August 3, 2025
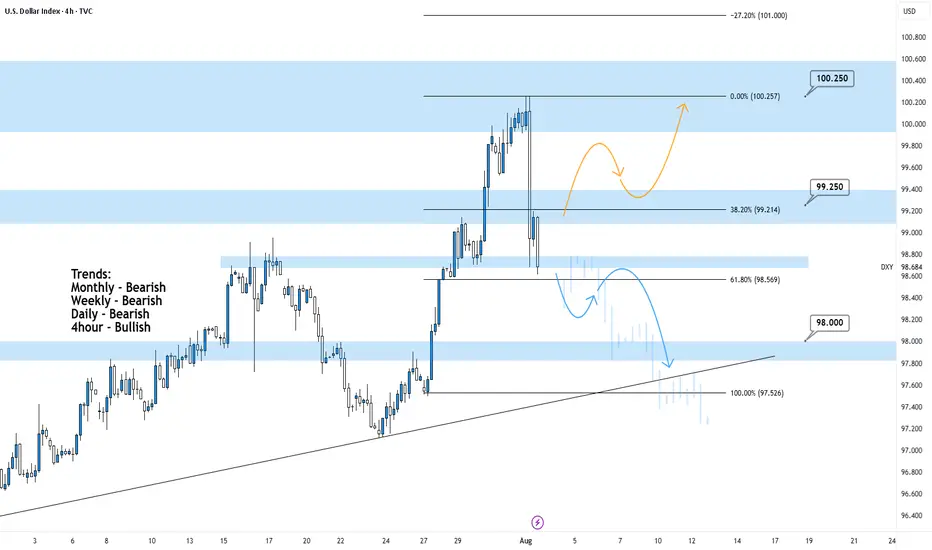
🔹 Top-Down Trend Bias:
• Monthly – Bearish
• Weekly – Bearish
• Daily – Bearish
• 4H – Bullish
The dollar index is in a larger bearish cycle but just bounced from near-term resistance around 100.250. While the 4H shows temporary strength, we’re trading into major resistance and we may see it short lived.
🔍 Key Levels to Watch
• Support: 98.00
• Resistance Zones: 99.25 and 100.25
• 61.8% Fib: 98.57
Price is currently testing structure after rejecting from the 100.25 resistance zone. This area remains a strong ceiling unless the higher timeframe structure shifts.
✅ Scenario A: Bearish Continuation (Blue Path)
1. Bearish Structure confirmation below the current zone
2.If bearish rejection confirms, expect price to continue toward 98.00, possibly 97.50
3.Clean confluence with the higher timeframe trend
⚠️ Scenario B: Bullish Extension (Orange Path)
1.If price breaks and holds above 99.25, we may see a continuation toward 100.25
2.Short-term bullish strength, but against HTF bias
3.Must treat as a counter-trend idea unless confirmed with HTF structure shift
🧠 Final Notes
• 98.50 is the key decision zone, watch reaction closely
• Trend remains bearish on all major timeframes
• Don’t force the long, lean bearish unless structure proves otherwise
Forex
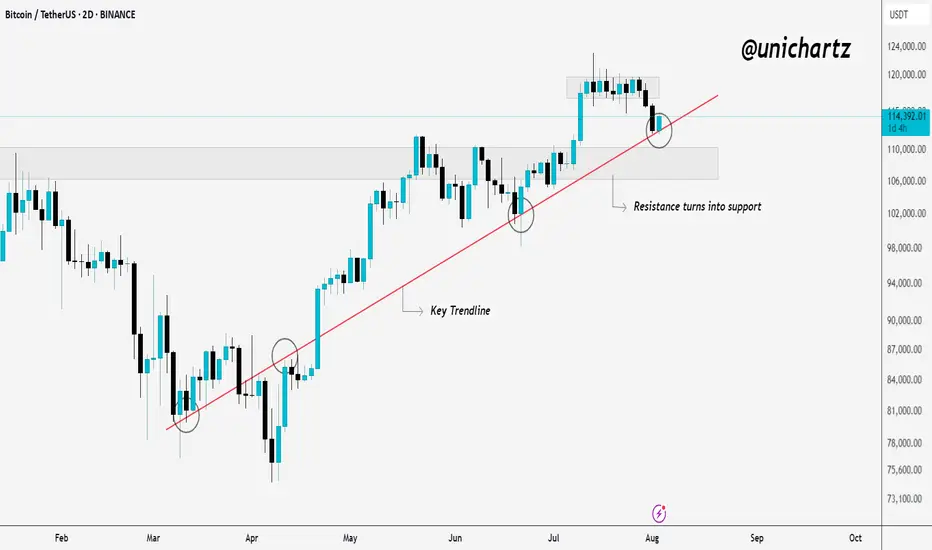
Smart Money Watching This Line — Are You?Bitcoin is holding strong above a key trendline that has acted as dynamic support since March. Every time price touched this line, buyers stepped in, and once again, it’s doing its job.
What was once resistance has now flipped into solid support. The recent pullback seems healthy, and the price is trying to bounce from the trendline area again.
As long as CRYPTOCAP:BTC respects this structure, the bullish momentum remains intact. If it holds, we could see another leg up from here.
DYOR, NFA
Thanks for reading!
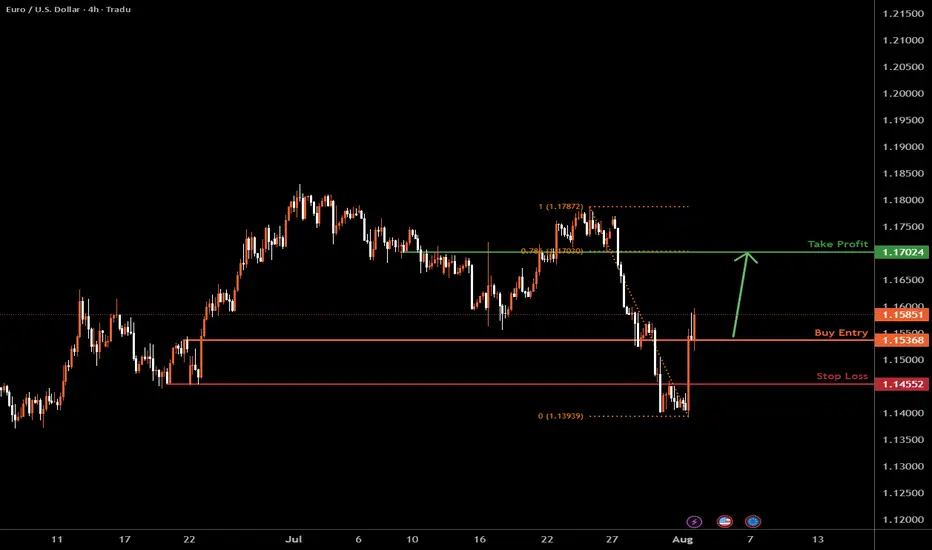
The Fiber H4 | Bullish riseEUR/USD has bounced off the support level, which serves as a pullback support and could potentially rise from this level to our take-profit target.
Buy entry is at 1.1585, which is a pullback support.
Stop loss is at 1.1455, which is a pullback support.
Take profit is at 1.1702, which is a pullback resistance that aligns with the 78.6% Fibonacci retracement.
High Risk Investment Warning
Trading Forex/CFDs on margin carries a high level of risk and may not be suitable for all investors. Leverage can work against you.
Stratos Markets Limited (tradu.com ):
CFDs are complex instruments and come with a high risk of losing money rapidly due to leverage. 65% of retail investor accounts lose money when trading CFDs with this provider. You should consider whether you understand how CFDs work and whether you can afford to take the high risk of losing your money.
Stratos Europe Ltd (tradu.com ):
CFDs are complex instruments and come with a high risk of losing money rapidly due to leverage. 66% of retail investor accounts lose money when trading CFDs with this provider. You should consider whether you understand how CFDs work and whether you can afford to take the high risk of losing your money.
Stratos Global LLC (tradu.com):
Losses can exceed deposits.
Please be advised that the information presented on TradingView is provided to Tradu (‘Company’, ‘we’) by a third-party provider (‘TFA Global Pte Ltd’). Please be reminded that you are solely responsible for the trading decisions on your account. There is a very high degree of risk involved in trading. Any information and/or content is intended entirely for research, educational and informational purposes only and does not constitute investment or consultation advice or investment strategy. The information is not tailored to the investment needs of any specific person and therefore does not involve a consideration of any of the investment objectives, financial situation or needs of any viewer that may receive it. Kindly also note that past performance is not a reliable indicator of future results. Actual results may differ materially from those anticipated in forward-looking or past performance statements. We assume no liability as to the accuracy or completeness of any of the information and/or content provided herein and the Company cannot be held responsible for any omission, mistake nor for any loss or damage including without limitation to any loss of profit which may arise from reliance on any information supplied by TFA Global Pte Ltd.
The speaker(s) is neither an employee, agent nor representative of Tradu and is therefore acting independently. The opinions given are their own, constitute general market commentary, and do not constitute the opinion or advice of Tradu or any form of personal or investment advice. Tradu neither endorses nor guarantees offerings of third-party speakers, nor is Tradu responsible for the content, veracity or opinions of third-party speakers, presenters or participants.
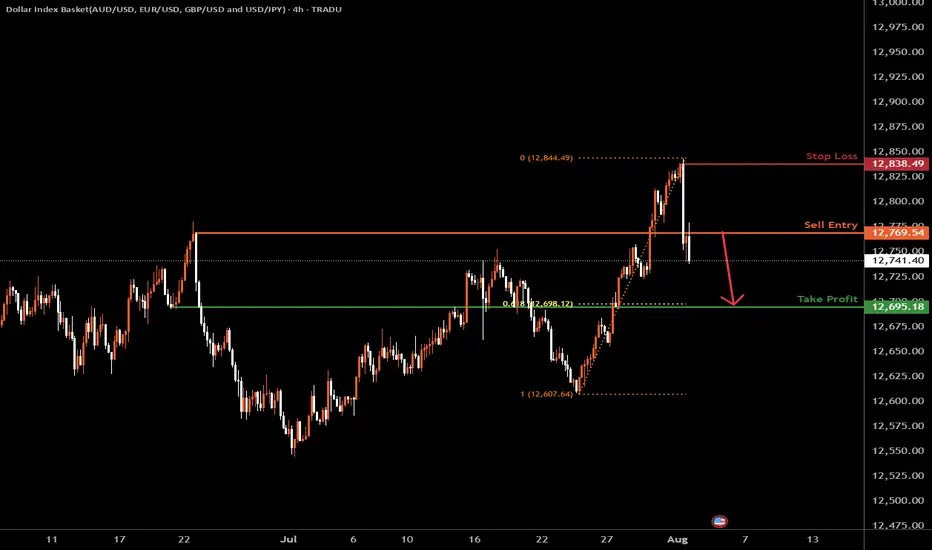
USDOLLAR H4 | Bearish dropBased on the H4 chart analysis, we could see the price drop lower from the sell entry, which is a pullback resistance and could drop to the downside.
Sell entry is at 12,769.54, which is a pullback resistance.
Stop loss is at 12,834.49, which is at 12,695.18, which is a pullback resistance.
Take profit is at 12,695.18, which is a pullback support that aligns with the 61.8% Fibonacci retracement.
High Risk Investment Warning
Trading Forex/CFDs on margin carries a high level of risk and may not be suitable for all investors. Leverage can work against you.
Stratos Markets Limited (tradu.com ):
CFDs are complex instruments and come with a high risk of losing money rapidly due to leverage. 65% of retail investor accounts lose money when trading CFDs with this provider. You should consider whether you understand how CFDs work and whether you can afford to take the high risk of losing your money.
Stratos Europe Ltd (tradu.com ):
CFDs are complex instruments and come with a high risk of losing money rapidly due to leverage. 66% of retail investor accounts lose money when trading CFDs with this provider. You should consider whether you understand how CFDs work and whether you can afford to take the high risk of losing your money.
Stratos Global LLC (tradu.com ):
Losses can exceed deposits.
Please be advised that the information presented on TradingView is provided to Tradu (‘Company’, ‘we’) by a third-party provider (‘TFA Global Pte Ltd’). Please be reminded that you are solely responsible for the trading decisions on your account. There is a very high degree of risk involved in trading. Any information and/or content is intended entirely for research, educational and informational purposes only and does not constitute investment or consultation advice or investment strategy. The information is not tailored to the investment needs of any specific person and therefore does not involve a consideration of any of the investment objectives, financial situation or needs of any viewer that may receive it. Kindly also note that past performance is not a reliable indicator of future results. Actual results may differ materially from those anticipated in forward-looking or past performance statements. We assume no liability as to the accuracy or completeness of any of the information and/or content provided herein and the Company cannot be held responsible for any omission, mistake nor for any loss or damage including without limitation to any loss of profit which may arise from reliance on any information supplied by TFA Global Pte Ltd.
The speaker(s) is neither an employee, agent nor representative of Tradu and is therefore acting independently. The opinions given are their own, constitute general market commentary, and do not constitute the opinion or advice of Tradu or any form of personal or investment advice. Tradu neither endorses nor guarantees offerings of third-party speakers, nor is Tradu responsible for the content, veracity or opinions of third-party speakers, presenters or participants.
USDJPY - Now or Never!Hello TradingView Family / Fellow Traders. This is Richard, also known as theSignalyst.
📈USDJPY has been overall bullish trading within the rising channel marked in blue and it is currently retesting the upper bound of the channel acting as an over-bought zone.
Moreover, the green zone is a strong weekly resistance.
📚 As per my trading style:
As #USDJPY is around the red circle zone, I will be looking for bearish reversal setups (like a double top pattern, trendline break , and so on...)
📚 Always follow your trading plan regarding entry, risk management, and trade management.
Good luck!
All Strategies Are Good; If Managed Properly!
~Rich
Disclosure: I am part of Trade Nation's Influencer program and receive a monthly fee for using their TradingView charts in my analysis.

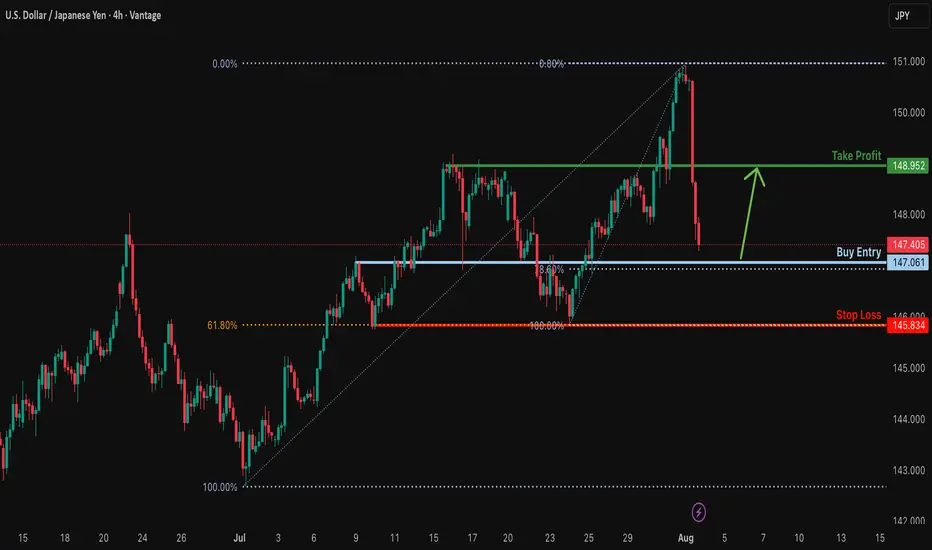
Falling towards 78.6% Fibonacci support?USD/JPY is falling towards the support level, which is an overlap support that aligns with the 78.6% Fibonacci retracement and could bounce from this level to our take profit.
Entry: 147.06
Why we like it:
There is an overlap support that aligns with the 78.6% Fibonacci retracement.
Stop loss: 145.83
Why we like it:
There is a multi-swing low support that aligns with the 61.8% Fibonacci retracement.
Take profit: 148.95
Why we like it:
There is a pullback resistance.
Enjoying your TradingView experience? Review us!
Please be advised that the information presented on TradingView is provided to Vantage (‘Vantage Global Limited’, ‘we’) by a third-party provider (‘Everest Fortune Group’). Please be reminded that you are solely responsible for the trading decisions on your account. There is a very high degree of risk involved in trading. Any information and/or content is intended entirely for research, educational and informational purposes only and does not constitute investment or consultation advice or investment strategy. The information is not tailored to the investment needs of any specific person and therefore does not involve a consideration of any of the investment objectives, financial situation or needs of any viewer that may receive it. Kindly also note that past performance is not a reliable indicator of future results. Actual results may differ materially from those anticipated in forward-looking or past performance statements. We assume no liability as to the accuracy or completeness of any of the information and/or content provided herein and the Company cannot be held responsible for any omission, mistake nor for any loss or damage including without limitation to any loss of profit which may arise from reliance on any information supplied by Everest Fortune Group.
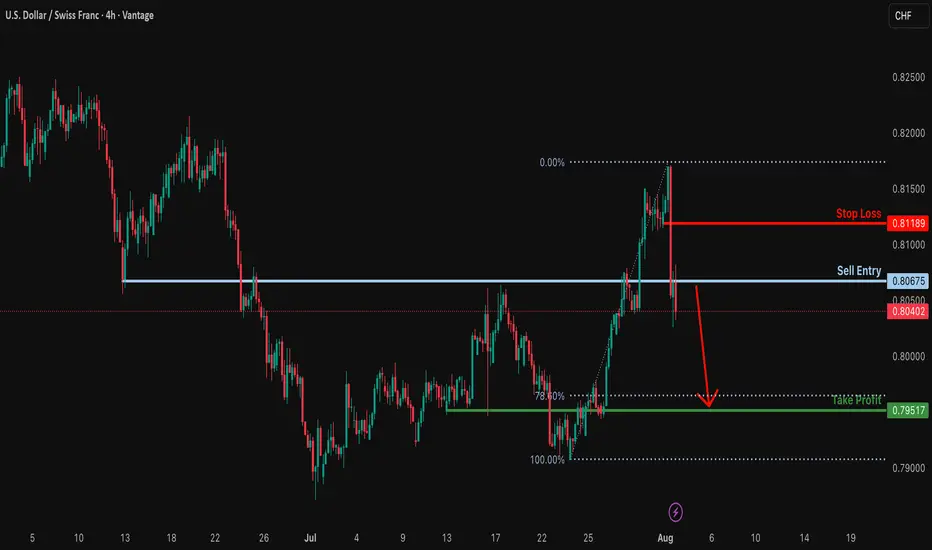
Potential bearish drop?USD/CHF has reacted off the sell entry, which is a pullback resistance, and could drop from this level to our take profit.
Entry: 0.8067
Why we like it:
There is a pullback resistance.
Stop loss: 0.8118
Why we like it:
There is a pullback resistance.
Take profit: 0.7951
Why we like it:
There is a pullback support level that is slightly below the 78.6% Fibonacci retracement.
Enjoying your TradingView experience? Review us!
Please be advised that the information presented on TradingView is provided to Vantage (‘Vantage Global Limited’, ‘we’) by a third-party provider (‘Everest Fortune Group’). Please be reminded that you are solely responsible for the trading decisions on your account. There is a very high degree of risk involved in trading. Any information and/or content is intended entirely for research, educational and informational purposes only and does not constitute investment or consultation advice or investment strategy. The information is not tailored to the investment needs of any specific person and therefore does not involve a consideration of any of the investment objectives, financial situation or needs of any viewer that may receive it. Kindly also note that past performance is not a reliable indicator of future results. Actual results may differ materially from those anticipated in forward-looking or past performance statements. We assume no liability as to the accuracy or completeness of any of the information and/or content provided herein and the Company cannot be held responsible for any omission, mistake nor for any loss or damage including without limitation to any loss of profit which may arise from reliance on any information supplied by Everest Fortune Group.
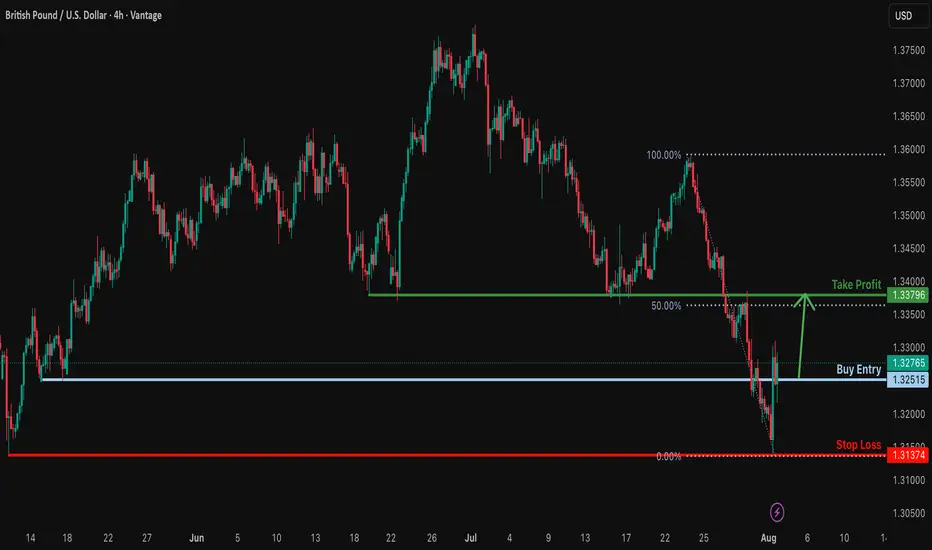
Could the Cable rise from here?The price is reacting off the support level and could rise from this level to our take profit.
Entry: 1.3251
Why we like it:
There is a pullback support.
Stop loss: 1.3137
Why we like it:
There is a multi swing low support.
Take profit: 1.3379
Why we like it:
There is an overlap resistance that is slightly above the 50% Fibonacci retracement.
Enjoying your TradingView experience? Review us!
Please be advised that the information presented on TradingView is provided to Vantage (‘Vantage Global Limited’, ‘we’) by a third-party provider (‘Everest Fortune Group’). Please be reminded that you are solely responsible for the trading decisions on your account. There is a very high degree of risk involved in trading. Any information and/or content is intended entirely for research, educational and informational purposes only and does not constitute investment or consultation advice or investment strategy. The information is not tailored to the investment needs of any specific person and therefore does not involve a consideration of any of the investment objectives, financial situation or needs of any viewer that may receive it. Kindly also note that past performance is not a reliable indicator of future results. Actual results may differ materially from those anticipated in forward-looking or past performance statements. We assume no liability as to the accuracy or completeness of any of the information and/or content provided herein and the Company cannot be held responsible for any omission, mistake nor for any loss or damage including without limitation to any loss of profit which may arise from reliance on any information supplied by Everest Fortune Group.
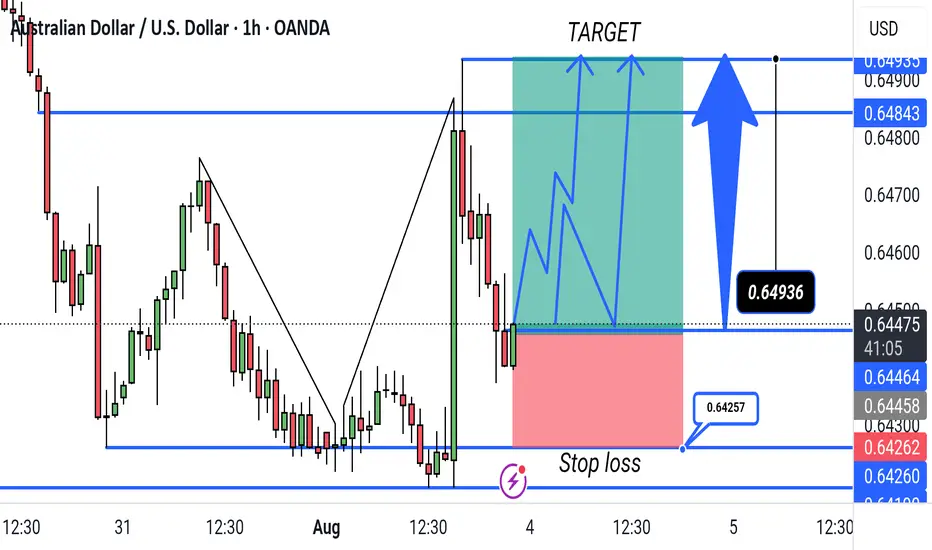
"AUD/USD Bullish Breakout Setup – 1H Timeframe. This chart shows a bullish trade setup for AUD/USD on the 1-hour timeframe. The entry is near 0.64464, with a target at 0.64843 and a stop loss at 0.64257. The trade aims to capitalize on a potential upward breakout following a support bounce.
Bullish rise?EUR/USD has reacted off the support level and could potentially rise from this level to our takeprofit.
Entry: 1.1535
Why we like it:
There is a pullback support.
Stop loss: 1.1405
Why we like it:
There is a swing low support.
Take profit: 1.1684
Why we like it:
There is a pullback resistance that is slightly below the 78.6% Fibonacci retracement.
Enjoying your TradingView experience? Review us!
Please be advised that the information presented on TradingView is provided to Vantage (‘Vantage Global Limited’, ‘we’) by a third-party provider (‘Everest Fortune Group’). Please be reminded that you are solely responsible for the trading decisions on your account. There is a very high degree of risk involved in trading. Any information and/or content is intended entirely for research, educational and informational purposes only and does not constitute investment or consultation advice or investment strategy. The information is not tailored to the investment needs of any specific person and therefore does not involve a consideration of any of the investment objectives, financial situation or needs of any viewer that may receive it. Kindly also note that past performance is not a reliable indicator of future results. Actual results may differ materially from those anticipated in forward-looking or past performance statements. We assume no liability as to the accuracy or completeness of any of the information and/or content provided herein and the Company cannot be held responsible for any omission, mistake nor for any loss or damage including without limitation to any loss of profit which may arise from reliance on any information supplied by Everest Fortune Group.

Week of 8/3/25: EURUSD AnalysisPrice was bearish all of last week until NFP, resulting in a shift in 4h and 1h market structure to be bullish.
Focus this week is being bullish and following 1h order flow until it reaches the extreme of the daily bearish structure to then be cautious and seeing where price wants to go from there.
Major News:
Tuesday: PMI
Thursday: Unemployment Claims

NG1! BULLISH BIAS RIGHT NOW| LONG
NG1! SIGNAL
Trade Direction: long
Entry Level: 3.086
Target Level: 3.599
Stop Loss: 2.744
RISK PROFILE
Risk level: medium
Suggested risk: 1%
Timeframe: 1D
Disclosure: I am part of Trade Nation's Influencer program and receive a monthly fee for using their TradingView charts in my analysis.
✅LIKE AND COMMENT MY IDEAS✅

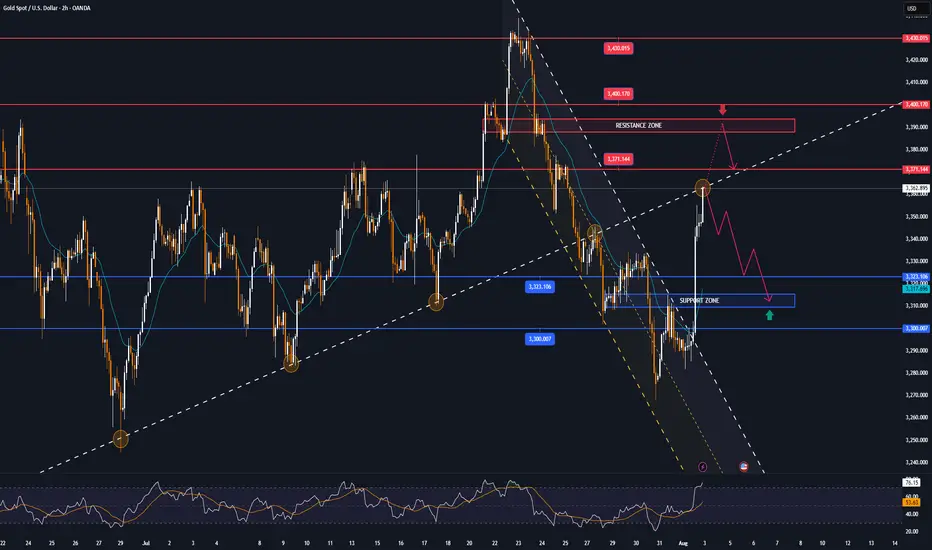
GOLD MARKET ANALYSIS AND COMMENTARY - [Aug 04 - Aug 08]This week, the price of OANDA:XAUUSD fell sharply from $3,345/oz to $3,268/oz after the FED Chairman said that the FED has no plans to cut interest rates at the upcoming September meeting. However, at the end of the week, the US Bureau of Labor Statistics announced that the number of non-farm jobs (NFP) in the US reached only 73,000 jobs in July, much lower than the forecast, and the unemployment rate increased higher, up to 4.2%. This pushed the price of gold up sharply from $3,281/oz to $3,363/oz.
The weak labor market has significantly changed expectations for the Fed's interest rate.
With a relatively light economic data calendar next week, investors will continue to monitor Friday's jobless claims report. Meanwhile, some analysts predict that the risk of global economic uncertainty after President Donald Trump announced new tariffs will continue to boost safe-haven demand for gold.
📌Technically, the resistance level for gold next week will be the round resistance of 3,400 USD/oz, followed by 3,440 USD/oz. Meanwhile, the support level is around 3,268 USD/oz.
Perspective on the H4 chart, gold is currently in a corrective recovery cycle testing the Trendline, it is likely that early next week there will be an increase around 3375 and then a correction decrease again.
Notable technical levels are listed below.
Support: 3,323 – 3,310 – 3,300USD
Resistance: 3,371 – 3,400 – 3,430USD
SELL XAUUSD PRICE 3394 - 3392⚡️
↠↠ Stop Loss 3398
BUY XAUUSD PRICE 3310 - 3312⚡️
↠↠ Stop Loss 3306
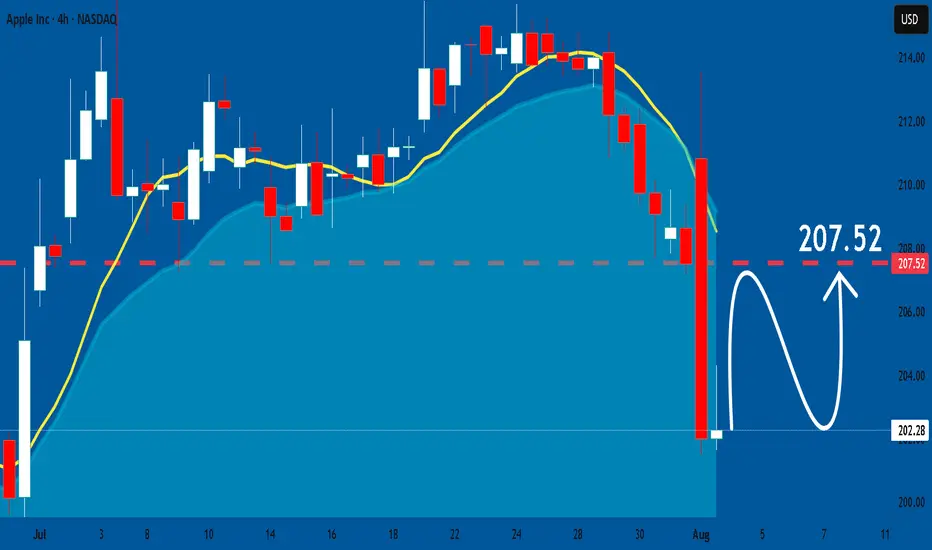
APPLE: Bullish Forecast & Bullish Scenario
The charts are full of distraction, disturbance and are a graveyard of fear and greed which shall not cloud our judgement on the current state of affairs in the APPLE pair price action which suggests a high likelihood of a coming move up.
Disclosure: I am part of Trade Nation's Influencer program and receive a monthly fee for using their TradingView charts in my analysis.
❤️ Please, support our work with like & comment! ❤️
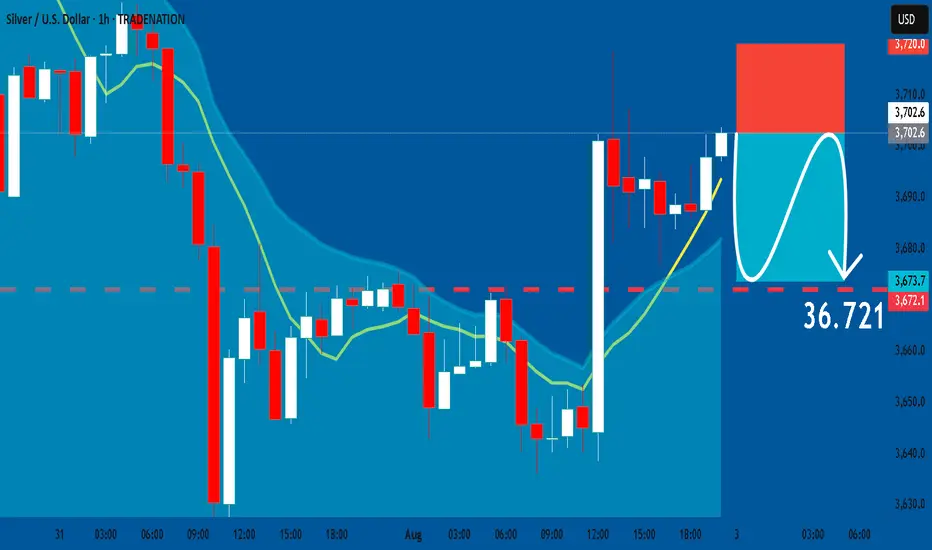
SILVER: Short Trade with Entry/SL/TP
SILVER
- Classic bearish formation
- Our team expects pullback
SUGGESTED TRADE:
Swing Trade
Short SILVER
Entry - 37.026
Sl - 37.200
Tp - 36.721
Our Risk - 1%
Start protection of your profits from lower levels
Disclosure: I am part of Trade Nation's Influencer program and receive a monthly fee for using their TradingView charts in my analysis.
❤️ Please, support our work with like & comment! ❤️
EURUSD Trading Opportunity! SELL!
My dear followers,
This is my opinion on the EURUSD next move:
The asset is approaching an important pivot point 1.1585
Bias - Bearish
Technical Indicators: Supper Trend generates a clear short signal while Pivot Point HL is currently determining the overall Bearish trend of the market.
Goal - 1.1497
About Used Indicators:
For more efficient signals, super-trend is used in combination with other indicators like Pivot Points.
Disclosure: I am part of Trade Nation's Influencer program and receive a monthly fee for using their TradingView charts in my analysis.
———————————
WISH YOU ALL LUCK

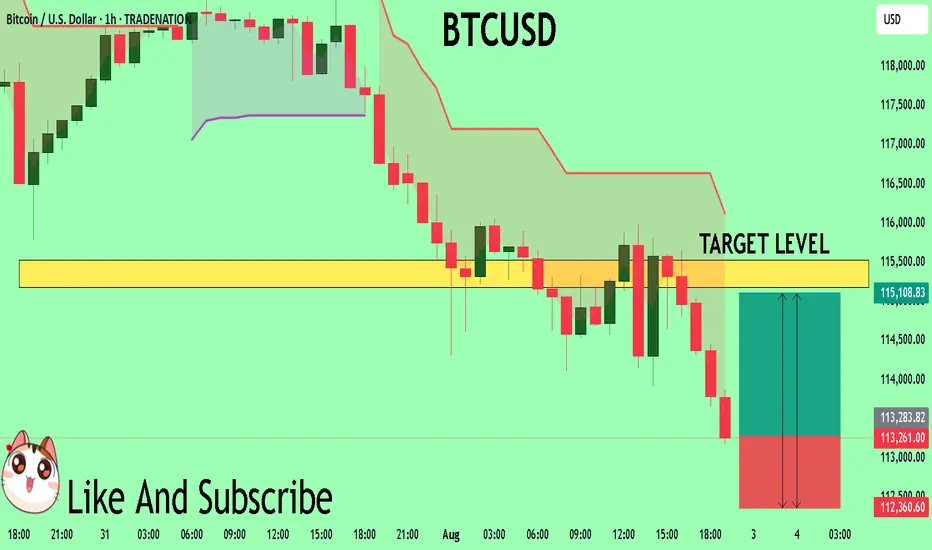
BTCUSD Will Explode! BUY!
My dear followers,
I analysed this chart on BTCUSD and concluded the following:
The market is trading on 11326 pivot level.
Bias - Bullish
Technical Indicators: Both Super Trend & Pivot HL indicate a highly probable Bullish continuation.
Target - 11517
Safe Stop Loss - 11236
About Used Indicators:
A super-trend indicator is plotted on either above or below the closing price to signal a buy or sell. The indicator changes color, based on whether or not you should be buying. If the super-trend indicator moves below the closing price, the indicator turns green, and it signals an entry point or points to buy.
Disclosure: I am part of Trade Nation's Influencer program and receive a monthly fee for using their TradingView charts in my analysis.
———————————
WISH YOU ALL LUCK
SPY: Growth & Bullish Forecast
The price of SPY will most likely increase soon enough, due to the demand beginning to exceed supply which we can see by looking at the chart of the pair.
Disclosure: I am part of Trade Nation's Influencer program and receive a monthly fee for using their TradingView charts in my analysis.
❤️ Please, support our work with like & comment! ❤️

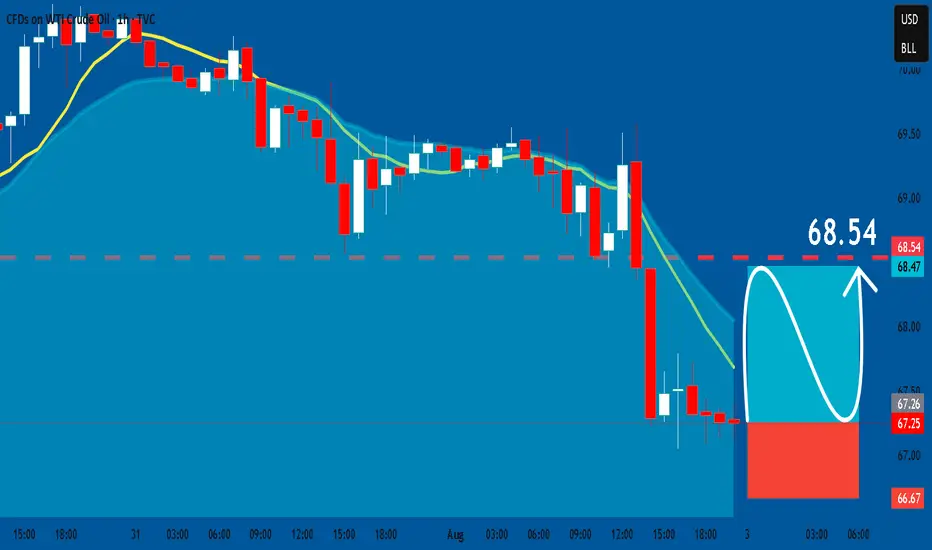
USOIL: Long Trade with Entry/SL/TP
USOIL
- Classic bullish pattern
- Our team expects retracement
SUGGESTED TRADE:
Swing Trade
Buy USOIL
Entry - 67.25
Stop - 66.67
Take - 68.53
Our Risk - 1%
Start protection of your profits from lower levels
Disclosure: I am part of Trade Nation's Influencer program and receive a monthly fee for using their TradingView charts in my analysis.
❤️ Please, support our work with like & comment! ❤️

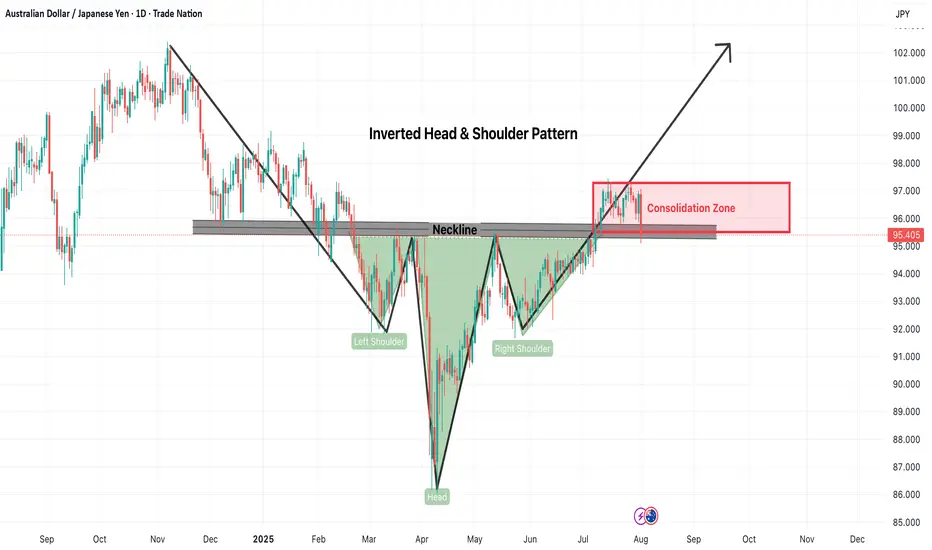
AUDJPY-Inverted Head & Shoulders Pattern at Reversal levelThe AUDJPY pair has formed a classic Inverted Head and Shoulders pattern, typically a strong bullish reversal signal. As seen on the daily chart, the left shoulder, head, and right shoulder have all developed with a clearly defined neckline near the 95.80–96.00 zone. Price action recently broke above this neckline but has since entered a consolidation phase between 95.00–97.00.
Bullish Scenario (Breakout Confirmation)
If AUDJPY decisively breaks above the 97.00 resistance with strong bullish momentum and volume, the inverted head and shoulders pattern will be fully confirmed. In this case, traders can expect an upward continuation toward:
Short-term Target: 99.00
Medium-term Target: 101.00
Measured Move Target: ~102.00 based on pattern height
Risk:
False breakout followed by quick pullback under neckline
Sudden JPY strength due to geopolitical or fundamental news
AUD weakness due to interest rate decisions or economic data
Sideways/Neutral Scenario (Extended Consolidation)
Another possibility is that AUDJPY continues to range between 95.00–97.00 for an extended period without a decisive breakout. This may happen if the market awaits more macroeconomic cues or central bank guidance.
Risk:
Whipsaws and fakeouts within the range
Frustration due to lack of clear direction
Risk Management Tips:
Wait for confirmation: Only trade post breakout or breakdown with candle close above 97.00 or below 95.00
Use tight stop-loss: Keep stops just below support or above resistance zones
Position sizing: Avoid overleveraging in rangebound conditions
Diversify exposure: Don’t put all capital into one trade setup
Conclusion:
AUDJPY is at a critical decision point. The inverted head and shoulders structure is bullish in nature, but the current consolidation adds uncertainty. Traders should stay alert for either a breakout for trend continuation or a breakdown invalidating the setup. Use proper risk management in all cases.
=================================================================
Disclosure: I am part of Trade Nation's Influencer program and receive a monthly fee for using their TradingView charts in my analysis.
=================================================================
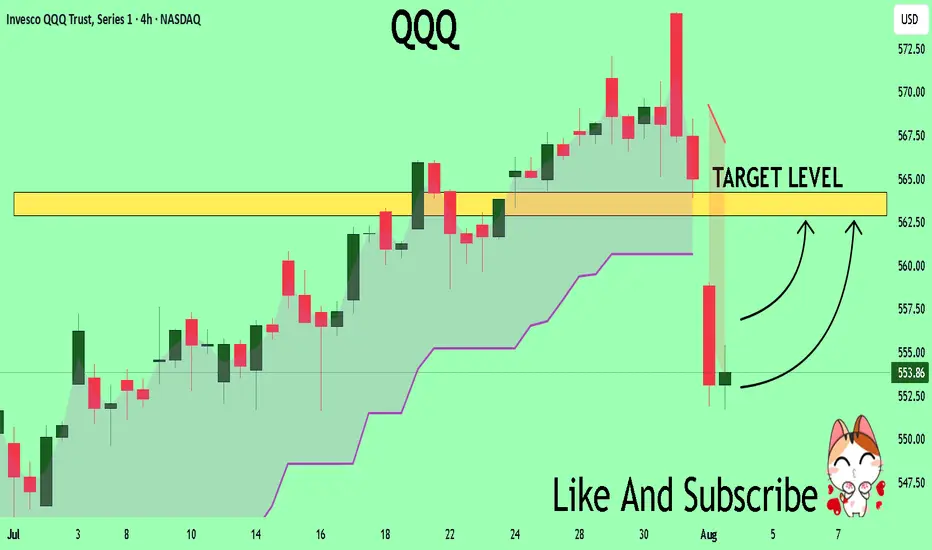
QQQ The Target Is UP! BUY!
My dear friends,
Please, find my technical outlook for QQQ below:
The instrument tests an important psychological level 553.86
Bias - Bullish
Technical Indicators: Supper Trend gives a precise Bullish signal, while Pivot Point HL predicts price changes and potential reversals in the market.
Target - 562.88
About Used Indicators:
Super-trend indicator is more useful in trending markets where there are clear uptrends and downtrends in price.
Disclosure: I am part of Trade Nation's Influencer program and receive a monthly fee for using their TradingView charts in my analysis.
———————————
WISH YOU ALL LUCK
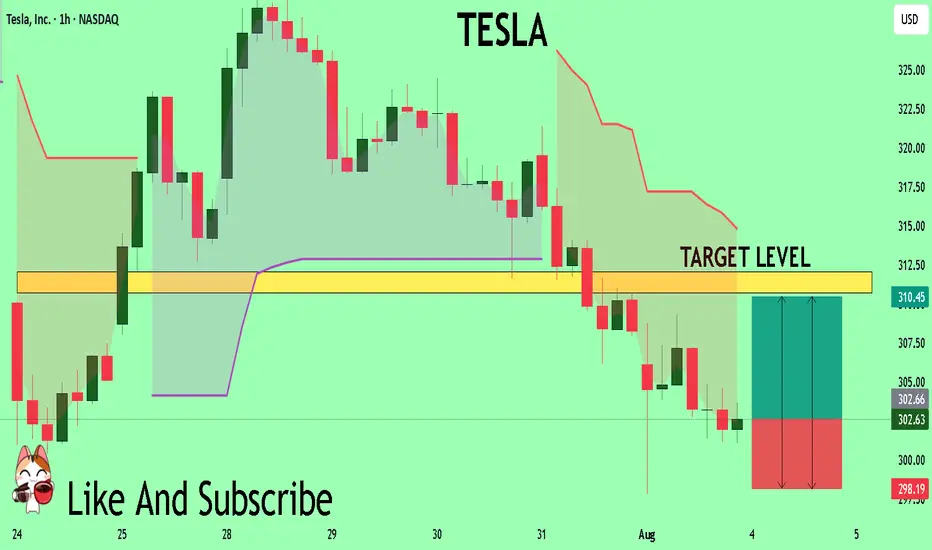
TESLA Sellers In Panic! BUY!
My dear friends,
TESLA looks like it will make a good move, and here are the details:
The market is trading on 302.63 pivot level.
Bias - Bullish
Technical Indicators: Supper Trend generates a clear long signal while Pivot Point HL is currently determining the overall Bullish trend of the market.
Goal - 310.73
Recommended Stop Loss - 298.19
About Used Indicators:
Pivot points are a great way to identify areas of support and resistance, but they work best when combined with other kinds of technical analysis
Disclosure: I am part of Trade Nation's Influencer program and receive a monthly fee for using their TradingView charts in my analysis.
———————————
WISH YOU ALL LUCK