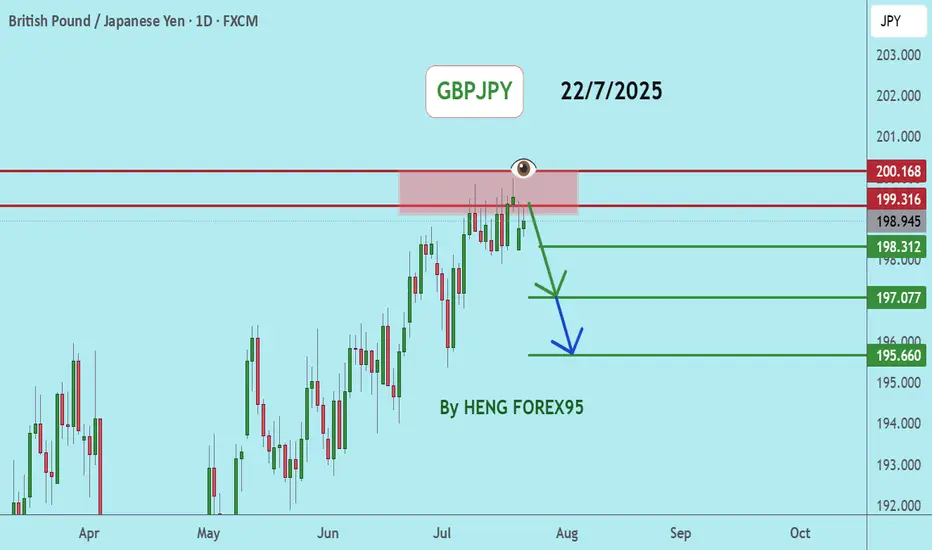
GBPJPYGBPJPY price is near the main resistance zone 200.168. If the price cannot break through the 200.186 level, it is expected that the price will go down. Consider selling the red zone.
🔥Trading futures, forex, CFDs and stocks carries a risk of loss.
Please consider carefully whether such trading is suitable for you.
>>GooD Luck 😊
❤️ Like and subscribe to never miss a new idea!
Forex
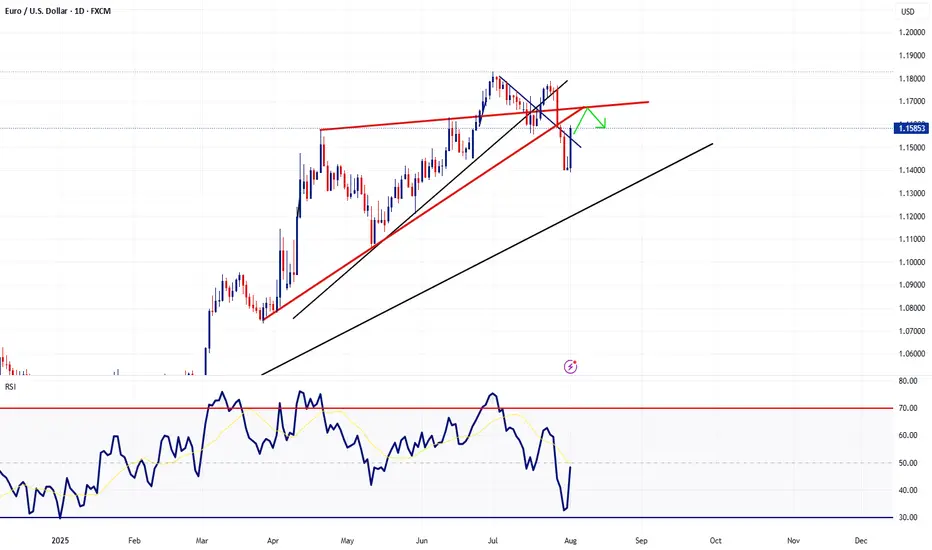
EURUSD - Scaling into Confluence ZoneTaking a look at EURUSD on the daily timeframe we had quite the rebound in EURUSD last Friday following the NFP report. However price action is now heading towards a cluster of resistance levels which is why I'm implement my scaling in technique using a specially designed and programmed EA that i use for MT5.
== TRADE PLAN ==
Scale-in with short positions and target a 0.5% growth on the account. In other words, once the basket arrives in profit by 0.5% CLOSE ALL.
Trade Safe - Trade Well
XAUUSDUpdate:
Gold Price Trend: As per our previous analysis on July 28, 2025, the price has now tested the support at 3,269. We expect that if the gold price can hold above 3,249, the gold price trend will remain bullish. We recommend considering buying in the red zone.
🔥Trading futures, forex, CFDs and stocks carries a risk of loss.
Please consider carefully whether such trading is suitable for you.
>>GooD Luck 😊
❤️ Like and subscribe to never miss a new idea!
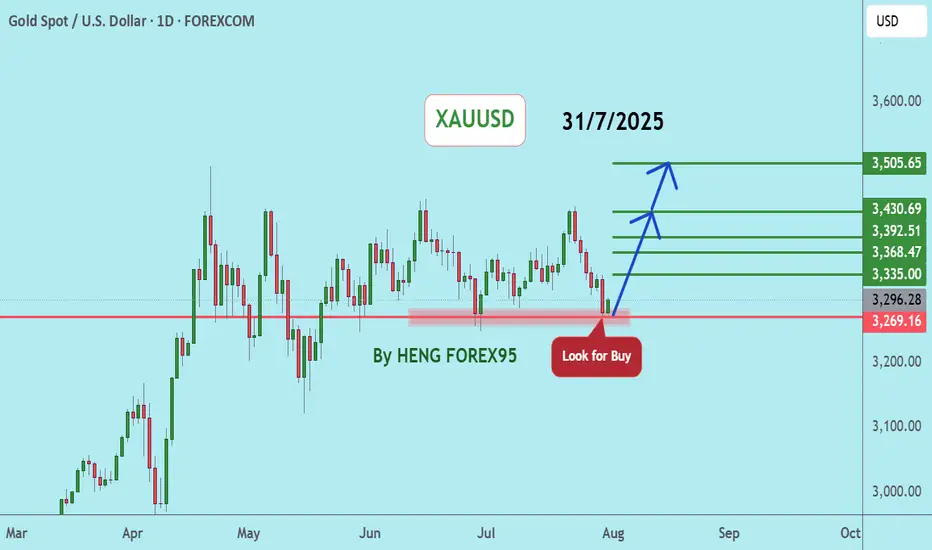
XAUUSDXAUUSD trend If the price can still stand above 3249, it is expected that there is a chance that the price will rebound. Consider buying the red zone.
🔥Trading futures, forex, CFDs and stocks carries a risk of loss.
Please consider carefully whether such trading is suitable for you.
>>GooD Luck 😊
❤️ Like and subscribe to never miss a new idea!

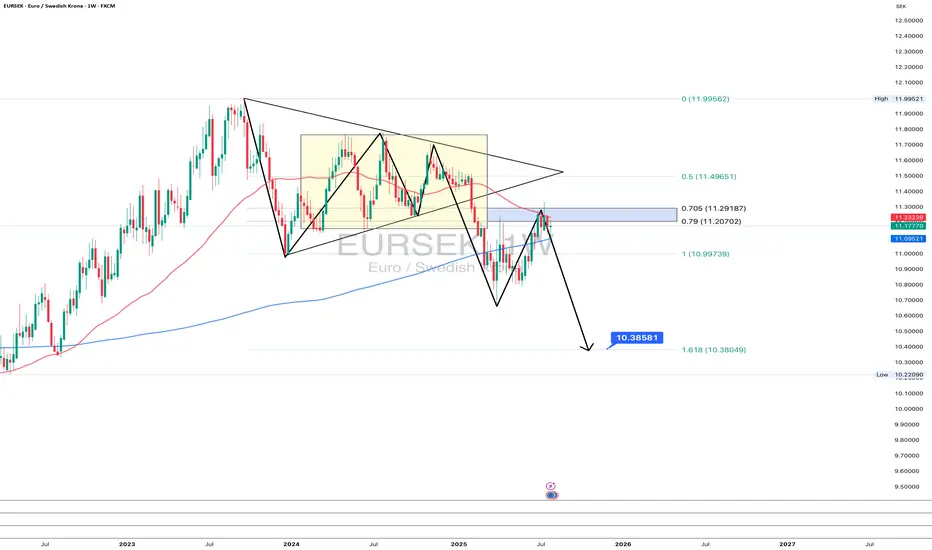
EURSEK 1W: triangle breakdown - bearish retest in playOn the weekly chart, EURSEK completed a symmetrical triangle pattern followed by a clean breakdown. The recent bullish move is now testing the 0.705–0.79 Fibo zone ($11.29–11.20), which aligns with the lower boundary of the former consolidation and 200 EMA resistance. So far, the price fails to break and hold above — suggesting a bearish continuation is likely.
Technical outlook:
Symmetrical triangle broke downward
Price is retesting Fibo zone 0.705–0.79
Strong resistance near 11.29
EMA200 adds overhead pressure
Next downside target: 1.618 Fibo at 10.38
From a macro perspective, the Swedish krona is holding better due to domestic rate expectations, while the euro may weaken further if the ECB pauses tightening. If the trend holds, EURSEK could break 11.00 and head toward 10.38 in the coming weeks.
When structure and fundamentals align - markets tend to follow.
EURUSD Will Go Lower! Sell!
Here is our detailed technical review for EURUSD.
Time Frame: 1h
Current Trend: Bearish
Sentiment: Overbought (based on 7-period RSI)
Forecast: Bearish
The market is on a crucial zone of supply 1.158.
The above-mentioned technicals clearly indicate the dominance of sellers on the market. I recommend shorting the instrument, aiming at 1.153 level.
P.S
Please, note that an oversold/overbought condition can last for a long time, and therefore being oversold/overbought doesn't mean a price rally will come soon, or at all.
Disclosure: I am part of Trade Nation's Influencer program and receive a monthly fee for using their TradingView charts in my analysis.
Like and subscribe and comment my ideas if you enjoy them!

USDCAD Will Go Down! Short!
Take a look at our analysis for USDCAD.
Time Frame: 1D
Current Trend: Bearish
Sentiment: Overbought (based on 7-period RSI)
Forecast: Bearish
The price is testing a key resistance 1.378.
Taking into consideration the current market trend & overbought RSI, chances will be high to see a bearish movement to the downside at least to 1.362 level.
P.S
The term oversold refers to a condition where an asset has traded lower in price and has the potential for a price bounce.
Overbought refers to market scenarios where the instrument is traded considerably higher than its fair value. Overvaluation is caused by market sentiments when there is positive news.
Disclosure: I am part of Trade Nation's Influencer program and receive a monthly fee for using their TradingView charts in my analysis.
Like and subscribe and comment my ideas if you enjoy them!

USDJPY Potential UpsidesHey Traders, in tomorrow's trading session we are monitoring USDJPY for a buying opportunity around 147.000 zone, USDJPY is trading in an uptrend and currently is in a correction phase in which it is approaching the trend at 147.000 support and resistance area.
Trade safe, Joe.

EURUSDHello Traders! 👋
What are your thoughts on EURUSD?
After last week's sharp decline, EUR/USD rebounded slightly on Friday, initiating a corrective move to the upside.
We anticipate this retracement to extend over the next few days, likely reaching the broken trendline and former support zone, which now acts as resistance.
As long as the pair remains below this resistance area, the bearish outlook remains valid.
Once the pullback is complete, we expect renewed downside pressure toward the next support levels.
💬 Is this just a corrective move before another leg down? Let us know your thoughts below! 👇
Don’t forget to like and share your thoughts in the comments! ❤️
GBPUSD extends to the downside. Wait for retest to sell✏️ OANDA:GBPUSD confirms the downtrend by breaking the trendline. The downtrend is still extending to lower areas because the GBPUSD bearish wave structure is very beautiful. Some selling momentum appears around the breakout zone of 1.339, which will form a bearish structure towards the support of 1.287 in the near future. Putting faith in the trendline at the moment is reliable.
📉 Key Levels
SELL zone 1.339-1.341
SELL DCA trigger: Break and trading bellow 1.317
Target 1.287
Leave your comments on the idea. I am happy to read your views.

Nonfarm Pay Attention Zone✏️ OANDA:XAUUSD is recovering and increasing towards the resistance zone of yesterday's US session. The 3315 zone is considered a strategic zone for Nonfarm today. A sweep up and then collapse to the liquidity zone of 3250 will be scenario 1 for Nonfarm today. If this important price zone is broken, we will not implement SELL strategies but wait for retests to BUY. It is very possible that when breaking 3315, it will create a DOW wave with the continuation of wave 3 when breaking the peak of wave 1.
📉 Key Levels
SELL trigger: Reject resistance 3315.
Target 3250
BUY Trigger: Break out and retest resistance 3315
Leave your comments on the idea. I am happy to read your views.

Gold establishes bullish wave. Wait for recovery point to BUY✏️ OANDA:XAUUSD Nonfarm announcement has shaped a new trend for gold price. completely broke the previous bearish wave structures and formed a new bullish trend with the break of wave 1 peak around 3315. Trading strategy next week only focuses on BUY signals. Maybe this bullish wave can make gold reach the all-time high.
📉 Key Levels
Support 3333-3315
Resistance 3373-3416
BUY zone: 3333 ; 3315 ( Strong support zone)
BUY DCA trigger Break resistance 3373
Target 3416
Leave your comments on the idea. I am happy to read your views.

EURUSD: Support & Resistance Analysis For Next Week 🇪🇺🇺🇸
Here is my latest structure analysis and important
supports & resistances for EURUSD for next week.
Consider these structures for pullback/breakout trading.
❤️Please, support my work with like, thank you!❤️
I am part of Trade Nation's Influencer program and receive a monthly fee for using their TradingView charts in my analysis.

USD/CAD Daily - Triple Bottom Breakout PatternUSD/CAD Daily – Triple Bottom Breakout
The USD/CAD pair on the 1D chart has formed a Triple Bottom pattern, a classic bullish reversal setup after a downtrend. This pattern suggests that sellers were unable to push the price below the established support zone on three separate occasions, signaling strong buying interest.
🔍 Chart Highlights:
Three distinct lows at a consistent support level
Strong bounce after each test of support, confirming bullish defense
Neckline (resistance line) successfully broken, indicating a breakout
Price target projected from the height of the pattern added to the breakout level
📈 Pattern: Triple Bottom
📍 Breakout Level (Neckline): Around 1.37800
🎯 Target: Approx. 1.42000
🛑 Invalidation: A daily close back below the neckline
This breakout may indicate the beginning of a bullish trend continuation, with momentum favoring the bulls as long as price holds above the neckline.

XAUUSD – the calm before the next breakout?Hello traders, what’s your take on the current trend in OANDA:XAUUSD ?
Looking back over the past 12 months, gold has delivered a truly impressive performance. From around $2,380 in August 2024, the precious metal surged to an all-time high of $3,432 by April this year — a gain of more than $1,000 in less than a year. But what’s more telling than the rise itself is how the market behaved afterward: instead of crashing, gold has maintained a high consolidation range, suggesting the uptrend is still very much alive.
This powerful rally didn’t happen in isolation. In a world marked by uncertainty, gold has once again asserted its role as a safe-haven asset. Inflation remains persistent across major economies, geopolitical tensions continue to stretch from Eastern Europe to the Middle East and Asia, and de-dollarization efforts by countries like China and Russia are reshaping global capital flows. None of these events alone could shake the markets, but together, they have laid the groundwork for gold’s sustained relevance.
From a technical standpoint, the long-term bullish structure remains intact. Following its peak at $3,432, gold has entered a modest correction phase — one that may well be a healthy consolidation before the next directional move.
Interestingly, while many investors remain cautious, the chart paints a different story: a market that isn’t afraid, but simply catching its breath. The real question is no longer “Can gold hold above $3,400?” but rather “Is the market gearing up for a fresh breakout — or a deeper correction?”
We may not be able to predict the future, but we can observe how price reacts at key levels. And sometimes, it’s in these seemingly quiet phases that the biggest turning points begin to form.
What do you think — is gold preparing for another leg up?
Drop your thoughts in the comments below! 👇

NZD_CAD REBOUND AHEAD|LONG|
✅NZD_CAD has been falling recently
And the pair seems locally oversold
So as the pair retested a horizontal support of 0.8125
And made a rebound
Price growth is to be expected
LONG🚀
✅Like and subscribe to never miss a new idea!✅

EUR-USD Will Fall! Sell!
Hello,Traders!
EUR-USD will hit the
Horizontal resistance of 1.1620
On Monday after making a
Powerful move up on Friday
And as the pair is locally
Overbought a local bearish
Correction is to be expected
Sell!
Comment and subscribe to help us grow!
Check out other forecasts below too!
Disclosure: I am part of Trade Nation's Influencer program and receive a monthly fee for using their TradingView charts in my analysis.

NZD-CHF Risky Long! Buy!
Hello,Traders!
NZD-CHF keeps falling and
Will hit the horizontal support
Of 0.4738 on Monday from
Where we will be expecting
A local rebound and a
Bullish move up
Buy!
Comment and subscribe to help us grow!
Check out other forecasts below too!
Disclosure: I am part of Trade Nation's Influencer program and receive a monthly fee for using their TradingView charts in my analysis.

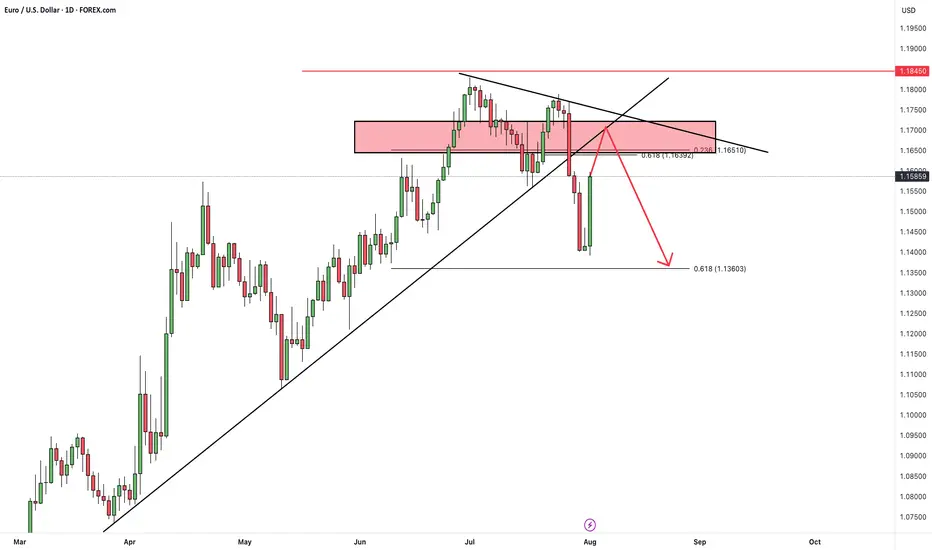
Fiber (EurUsd) Short Idea. Aug 4-8 This Idea wont be precise as my Last Euro Analysis, You can check that out on my Profile.
Now the what do i mean by it not being precise? it means that there is room for upside Movement But it should break that high (Fib high) and the target is Sell-Side Liquidity for this week Key Things in this charts are Liquidity gap, Breaker block IFVG weekly Inverse rejection block.

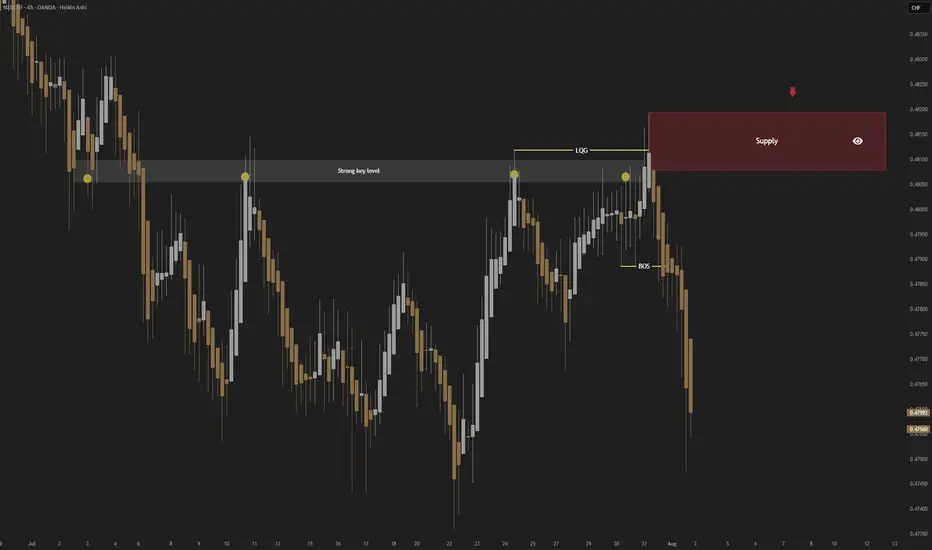
NZDCHF; Heikin Ashi Trade Idea📈 Hey Traders!
Here’s a fresh outlook from my trading desk. If you’ve been following me for a while, you already know my approach:
🧩 I trade Supply & Demand zones using Heikin Ashi chart on the 4H timeframe.
🧠 I keep it mechanical and clean — no messy charts, no guessing games.
❌ No trendlines, no fixed sessions, no patterns, no indicator overload.
❌ No overanalyzing market structure or imbalances.
❌ No scalping, and no need to be glued to the screen.
✅ I trade exclusively with limit orders, so it’s more of a set-and-forget style.
✅ This means more freedom, less screen time, and a focus on quality setups.
✅ Just a simplified, structured plan and a calm mindset.
💬 Let’s Talk:
💡 Do you trade supply & demand too ?
💡What’s your go-to timeframe ?
💡Ever tried Heikin Ashi ?
📩 Got questions about my strategy or setup? Drop them below — ask me anything, I’m here to share.
Let’s grow together and keep it simple. 👊
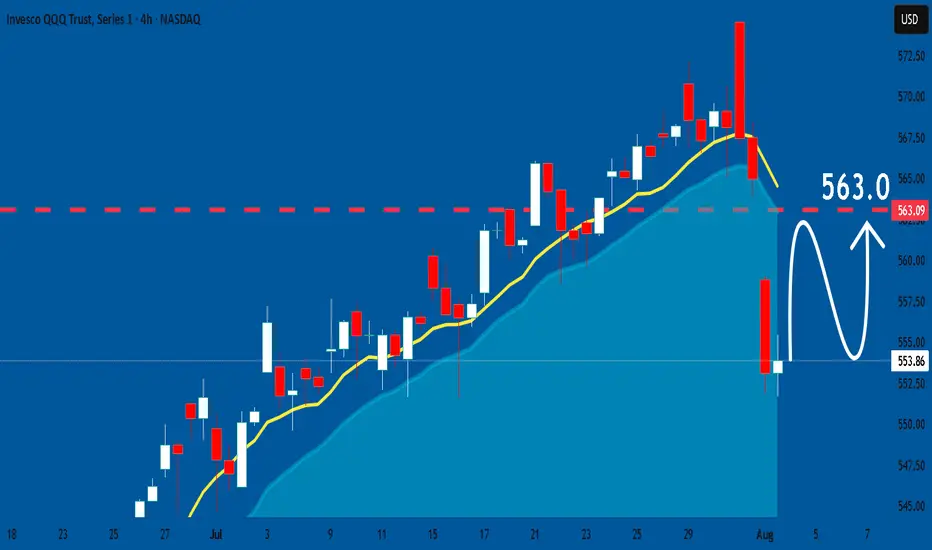
QQQ: Expecting Bullish Continuation! Here is Why:
Our strategy, polished by years of trial and error has helped us identify what seems to be a great trading opportunity and we are here to share it with you as the time is ripe for us to buy QQQ.
Disclosure: I am part of Trade Nation's Influencer program and receive a monthly fee for using their TradingView charts in my analysis.
❤️ Please, support our work with like & comment! ❤️
TESLA: Bullish Continuation & Long Trade
TESLA
- Classic bullish setup
- Our team expects bullish continuation
SUGGESTED TRADE:
Swing Trade
Long TESLA
Entry Point - 302.63
Stop Loss - 296.98
Take Profit - 312.87
Our Risk - 1%
Start protection of your profits from lower levels
Disclosure: I am part of Trade Nation's Influencer program and receive a monthly fee for using their TradingView charts in my analysis.
❤️ Please, support our work with like & comment! ❤️

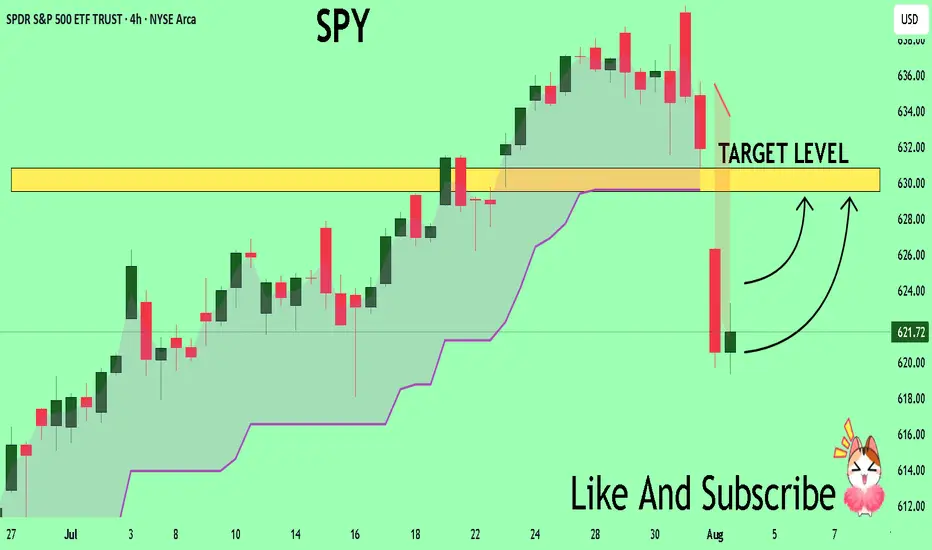
SPY Massive Long! BUY!
My dear subscribers,
My technical analysis for SPY is below:
The price is coiling around a solid key level - 621.72
Bias - Bullish
Technical Indicators: Pivot Points Low anticipates a potential price reversal.
Super trend shows a clear buy, giving a perfect indicators' convergence.
Goal - 629.55
About Used Indicators:
By the very nature of the supertrend indicator, it offers firm support and resistance levels for traders to enter and exit trades. Additionally, it also provides signals for setting stop losses
Disclosure: I am part of Trade Nation's Influencer program and receive a monthly fee for using their TradingView charts in my analysis.
———————————
WISH YOU ALL LUCK