EUR_CHF WILL KEEP FALLING|SHORT|
✅EUR_CHF broke the key
Structure level of 0.9295
While trading in an local downtrend
Which makes me bearish
And I think that after the retest of the
Broken level is complete
A rebound and bearish
Continuation will follow
SHORT🔥
✅Like and subscribe to never miss a new idea!✅
Disclosure: I am part of Trade Nation's Influencer program and receive a monthly fee for using their TradingView charts in my analysis.
Forex

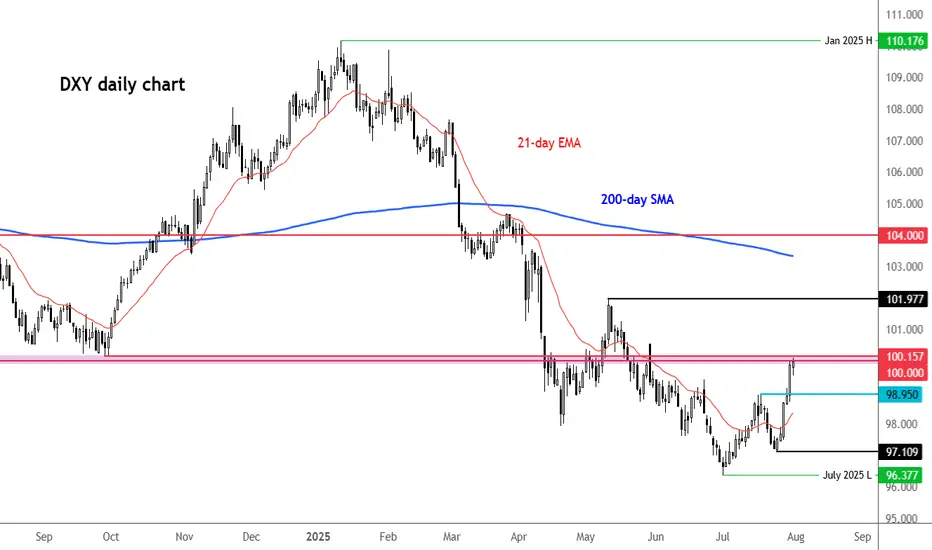
DXY testing 100.00 resistanceThe US dollar index has risen to rest a key resistance area around the 100.00 level. Previously a key support and resistance zone, what happens here could determine the near-term technical direction for the US dollar.
Key support below this zone is at 98.95, marking a prior resistance. Given the short-term bullish price structure, I would expect this level to hold if the greenback were to ease back from here.
If the bullish momentum gathers pace, then 101.00 could be the next stop, followed by the recent high of 101.97.
From a macro point of view, resilient economic data and persistent core inflation concerns continue to support the Federal Reserve’s cautious policy approach. Today’s core PCE inflation reading came in slightly above forecast, at 2.8% year-over-year versus the expected 2.7%. In addition, jobless claims were better than anticipated, registering 218,000 compared to the 224,000 forecast. The Q2 Employment Cost Index also surprised to the upside, rising 0.9% quarter-on-quarter.
These figures follow yesterday’s stronger-than-expected GDP report and a solid ADP private payrolls release, further underscoring the strength of the U.S. economy.
Attention now turns to Friday’s nonfarm payrolls report, which could have a meaningful impact on rate expectations. Fed Chair Jerome Powell has emphasized the importance of the unemployment rate as a key metric, so any upside surprise could reinforce the Fed’s current position.
However, expectations are not very high for the non-farm payrolls report. Current forecasts suggest an increase of 106,000 jobs, with average weekly earnings rising 0.3% month-over-month, and the unemployment rate edging up to 4.2%. Yet, the scarcity of strong leading indicators this month adds a layer of uncertainty to the outlook.
By Fawad Razaqzada, market analyst with FOREX.com
USD_JPY RESISTANCE AHEAD|SHORT|
✅USD_JPY is going up now
But a strong resistance level is ahead at 151.232
Thus I am expecting a pullback
And a move down towards the target of 150.368
SHORT🔥
✅Like and subscribe to never miss a new idea!✅
Disclosure: I am part of Trade Nation's Influencer program and receive a monthly fee for using their TradingView charts in my analysis.

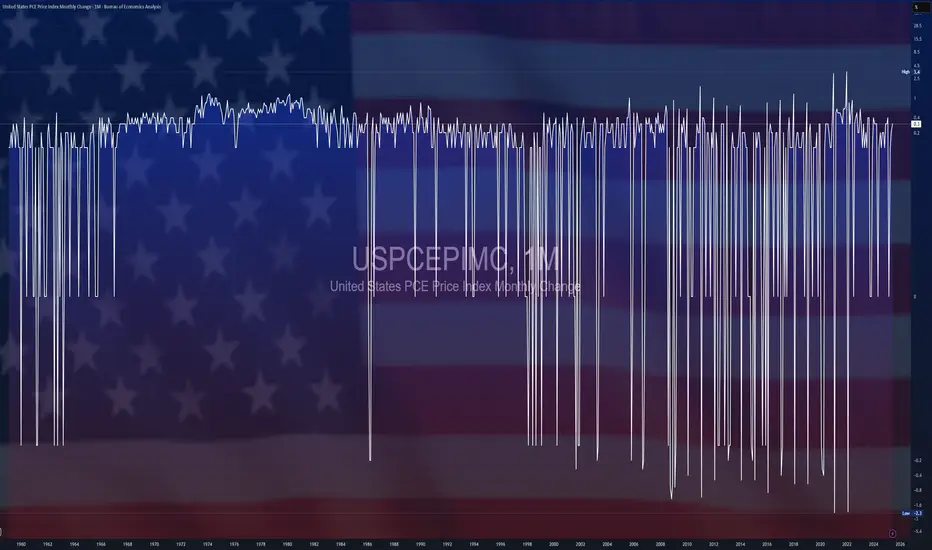
$USPCEPIMC -U.S PCE Prices Rise (June/2025)ECONOMICS:USPCEPIMC
June/2025
source: U.S. Bureau of Economic Analysis
- The US PCE price index rose by 0.3% mom in June, the largest increase in four months, and in line with expectations, led by prices for goods.
The core PCE index also went up 0.3%, aligning with forecasts.
However, both the headline and core annual inflation rates topped forecasts, reaching 2.6% and 2.8%, respectively.
Meanwhile, both personal income and spending edged up 0.3%.
EUR/GBP Thief Trade: Swipe Profits Before Overbought Trap!🦹♂️ EUR/GBP "THE CHUNNEL HEIST" – BULLISH LOOT IN PROGRESS! 🚨💰
(Thief Trading Strategy – Escape Before the Cops Arrive!)
🎯 DEAR MARKET PIRATES & PROFIT SNATCHERS,
Based on our 🔥Thief Trading Style Analysis🔥, we’re executing a bullish heist on EUR/GBP ("The Chunnel"). The vault is wide open—time to swipe the loot before the high-risk resistance police barricade (aka overbought trap) shuts us down!
📜 THE MASTER PLAN:
✔ Entry (📈): "The Bullish Vault is Unlocked!"
Buy Limit Orders (15-30min TF) near recent swing lows/highs.
Thief’s DCA Trick: Layer entries like a pro robber—multiple limit orders for max loot.
✔ Stop Loss (🛑): "Hide Your Stash Wisely!"
SL at nearest 4H candle wick (0.86500)—adjust based on your risk appetite & lot size.
Remember: A good thief always has an escape route!
✔ Target (🎯): 0.88500 (or escape earlier if the cops get suspicious!)
🔎 SCALPERS & SWING BANDITS – LISTEN UP!
Scalpers: Stick to LONG-ONLY heists! Use trailing SL to protect profits.
Swing Thieves: If you’re low on cash, join the slow robbery—DCA & hold!
📡 WHY THIS HEIST IS HOT:
Bullish momentum in play (but BEWARE of overbought traps!).
Fundamental Drivers: Check COT Reports, Macro Data, & Sentiment.
🚨 TRADING ALERT: NEWS = POLICE RAID RISK!
Avoid new trades during high-impact news.
Trailing SL = Your Getaway Car! Lock profits before volatility strikes.
💥 BOOST THIS HEIST – STRENGTHEN THE GANG!
👉 Smash the LIKE & BOOST button to fuel our next market robbery!
👉 Follow for more heists—profit awaits! 🚀💰
🦹♂️ Stay Sharp, Stay Ruthless… See You on the Next Heist!

AUD-USD Will Go Down! Sell!
Hello,Traders!
AUD-USD is trading in a
Downtrend and the pair
Broke the key horizontal
Level of 0.6470 which is
Now a resistance then
Made a retest and a
Confident pullback which
Reinforces our bearish
Bias and makes us expect
A further bearish move down
Sell!
Comment and subscribe to help us grow!
Check out other forecasts below too!
Disclosure: I am part of Trade Nation's Influencer program and receive a monthly fee for using their TradingView charts in my analysis.

EUR-USD Bearish Breakout! Sell!
Hello,Traders!
EUR-USD made a bearish
Breakout of the key horizontal
Level of 1.1460 then made
A retest and a pullback so
We are bearish biased and
We will be expecting a
Further bearish continuation
Sell!
Comment and subscribe to help us grow!
Check out other forecasts below too!
Disclosure: I am part of Trade Nation's Influencer program and receive a monthly fee for using their TradingView charts in my analysis.

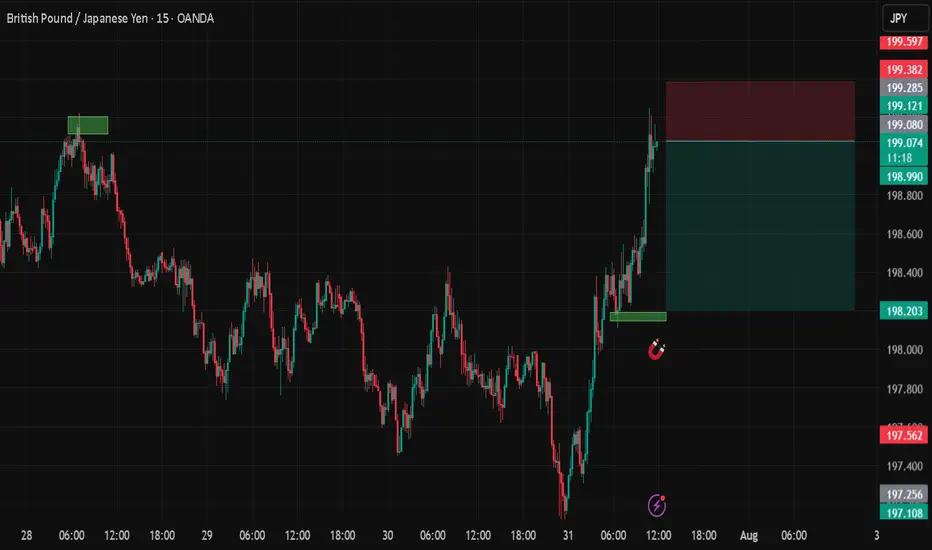
GBPJPYDate:
July 31,2025
Session:
New York Session
Pair:
GBPJPY
Bias:
Long
Liquidity from Monday's London session was swept in today's (Thursday) New York and London Session. Now I see price following the trend downward.
Entry: 199.080
Stop Loss: 199.387
Target: 198.207
RR: 2.90
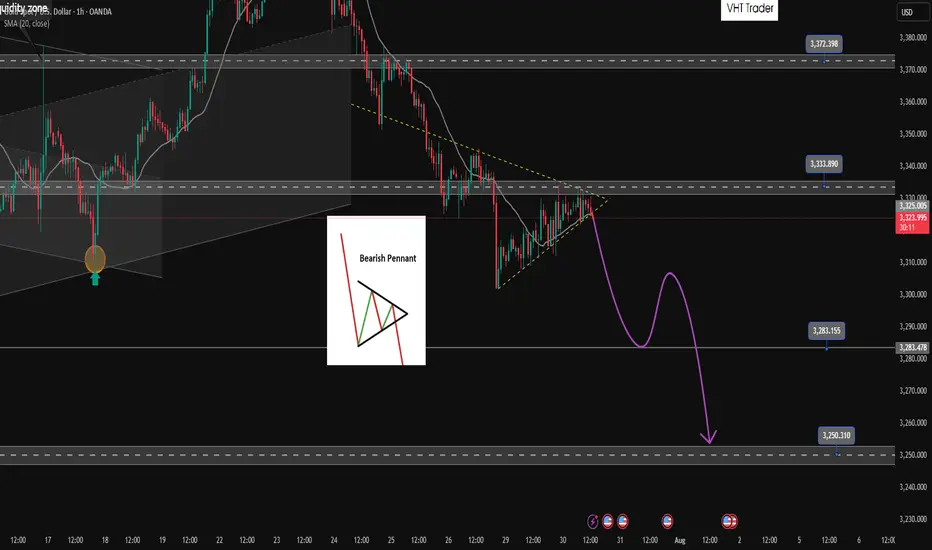
Bearish pennant pattern active. Active SELL✏️Gold price is forming a triangle accumulation pattern. That shows the hesitation of investors at the moment, they may be waiting for important economic indicators of the US this week. Just an impact that makes Price break out of the triangle border can create a strong FOMO trend. The price line is quite similar to the bearish pennant pattern and heading towards really strong support areas.
📉 Key Levels
SELL Trigger: Break bottom line 3324
Target 3285, lower is the 3250 area
BUY Trigger: Break and trading above 3333
BUY Trigger: Rejection and confirmation of candle at 3285
Leave your comments on the idea. I am happy to read your views.
EURJPY SWEET BLUESEurjpy has hit all take profits with very little drawdown and huge profits very quickly nice pattern, simply followed

Dollar Index (DXY): Will It Rise More?!
Dollar Index is on its way to 100.4 resistance.
A breakout of a major supply cluster on a daily after FED meeting
yesterday indicates a strong bullish pressure.
I think that growth will continue soon.
❤️Please, support my work with like, thank you!❤️

Gold Sell Setup - M15PEPPERSTONE:XAUUSD
Timeframe: m15
Risk Level: Medium
🔹 Setup:
Price is testing the upper boundary of the descending channel.
📈 Entry:
Current price zone: 3302.5
🎯 Targets (TP):
TP1: 3393
TP2: 3283
TP4: 3264
TP6: 3244
⛔ Stop Loss (SL):
3312.2
#XAUUSD #GOLD #SELL #Signal #MJTrading
Psychology Always Matters:

EURUSD: Will Start Growing! Here is Why:
It is essential that we apply multitimeframe technical analysis and there is no better example of why that is the case than the current EURUSD chart which, if analyzed properly, clearly points in the upward direction.
Disclosure: I am part of Trade Nation's Influencer program and receive a monthly fee for using their TradingView charts in my analysis.
❤️ Please, support our work with like & comment! ❤️

GBPCAD: The Hunt for the Previous Month's LowLike a predator stalking its prey, the market often moves with a clear objective. For GBPCAD, the primary target is now the massive pool of liquidity resting below the Previous Month's Low. This isn't a random drop; it's a calculated hunt. This analysis lays out the plan to join the reversal after the hunt is complete.
The price of GBPCAD is approaching a large pool of liquidity in the form of the Previous Month's Low (PML) , with the May 5th low located just below it. There is a high probability that this liquidity will be swept in the near future, because with only a few days left until the end of the month, the PML will no longer act as such a strong magnet for the price as it does now.
The capture of this liquidity would be accompanied by the mitigation of a daily order block in conjunction with a daily FVG . This confluence of factors could act as strong support for a potential price bounce, with a minimum target of a liquidity sweep of the Previous Week's High (PWH) .
SETUP CONDITIONS
The condition for the long setup to form would be a sharp downside liquidity sweep with a candle wick, which mitigates the upper part of the daily order block, followed by the start of a bullish order flow on a lower timeframe .
► Invalidation: Invalidation of the long scenario would be a daily candle body closing below the May 5th low, or a sharp drop to the middle of the daily order block.
~~~~~~~~~~~~~~~~~~~~~~~~~~~~~~~~~~~~~~~~~~~~~~~~~~~~~~~~~~~~~~~~~
The principles and conditions for forming the manipulation zones I show in this trade idea are detailed in my educational publication, which was chosen by TradingView for the "Editor's Picks" category and received a huge amount of positive feedback from this insightful trading community. To better understand the logic I've used here and the general principles of price movement in most markets from the perspective of institutional capital, I highly recommend checking out this guide if you haven't already. 👇
P.S. This is not a prediction of the exact price direction. It is a description of high-probability setup that become valid only if specific conditions are met when the price reaches the marked POI. If the conditions are not met, the setup are invalid. No setup has a 100% success rate, so if you decide to use this trade idea, always apply a stop-loss and proper risk management. Trade smart.
~~~~~~~~~~~~~~~~~~~~~~~~~~~~~~~~~~~~~~~~~~~~~~~~~~~~~~~~~~~~~~~~~
If you found this analysis helpful, support it with a Boost! 🚀
Have a question or your own view on this idea? Share it in the comments. 💬
► Follow me on TradingView to get real-time updates on THIS idea (entry, targets & live trade management) and not to miss my next detailed breakdown.
~~~~~~~~~~~~~~~~~~~~~~~~~~~~~~~~~~~~~~~~~~~~~~~~~~~~~~~~~~~~~~~~~

EURJPY: Short Trade Explained
EURJPY
- Classic bearish formation
- Our team expects pullback
SUGGESTED TRADE:
Swing Trade
Short EURJPY
Entry - 171.66
Sl - 172.11
Tp - 170.81
Our Risk - 1%
Start protection of your profits from lower levels
Disclosure: I am part of Trade Nation's Influencer program and receive a monthly fee for using their TradingView charts in my analysis.
❤️ Please, support our work with like & comment! ❤️

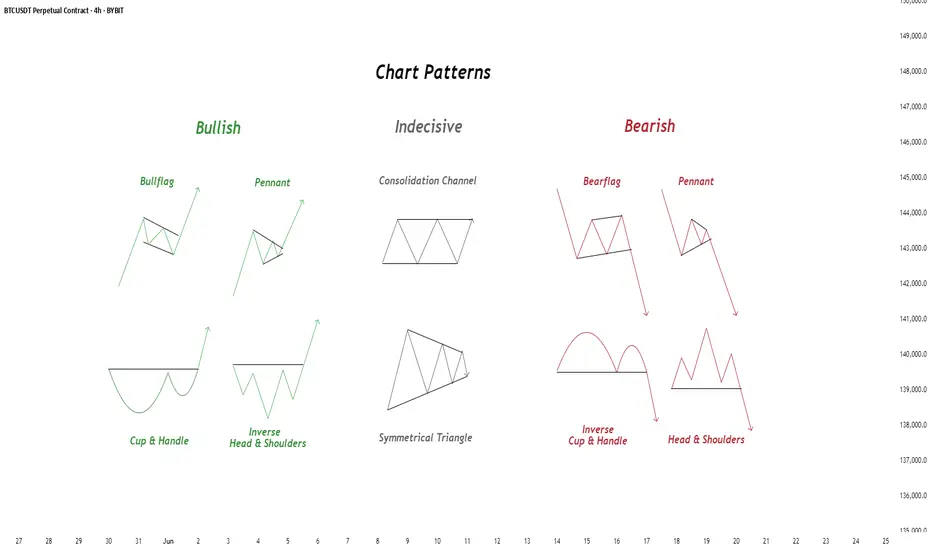
Chart Patterns - How to read them like a ProChart patterns are visual formations on price charts that help traders anticipate potential market movements.
These patterns fall into three main categories: bullish , bearish , and indecisive .
---
1. Bullish Chart Patterns
Bullish patterns often signal that price is likely to move upward.
1.1 Bull Flag
* What it looks like: A sharp upward move followed by a small downward-sloping rectangle (the flag).
* Meaning: After a strong rally, the price consolidates briefly before continuing higher.
* Key insight: A breakout above the flag typically signals a continuation of the trend.
1.2 Pennant (Bullish)
* What it looks like: A strong upward move followed by a small symmetrical triangle.
* Meaning: Similar to the bull flag, but the consolidation takes a triangular form.
* Key insight: Once price breaks above the pennant, the uptrend often resumes.
1.3 Cup & Handle
* What it looks like: A “U”-shaped curve (the cup) followed by a small downward drift (the handle).
* Meaning: This pattern suggests a period of accumulation before price breaks higher.
* Key insight: A breakout above the handle signals the beginning of a new bullish leg.
1.4 Inverse Head & Shoulders
* What it looks like: Three low points, with the middle low being the deepest.
* Meaning: This reversal pattern appears after a downtrend and signals a potential change to an uptrend.
* Key insight: A breakout above the “neckline” confirms the reversal.
---
2. Indecisive Chart Patterns
These patterns show market hesitation, where neither bulls nor bears are clearly in control.
2.1 Consolidation Channel
* What it looks like: Price moves within a horizontal channel.
* Meaning: Market is moving sideways with no strong trend.
* Key insight: A breakout in either direction often leads to a significant move.
2.2 Symmetrical Triangle
* What it looks like: Two converging trend lines forming a triangle.
* Meaning: This is a neutral pattern that can break out in either direction.
* Key insight: Traders wait for a breakout before taking a position.
---
3. Bearish Chart Patterns
Bearish patterns signal a high probability of downward price movement.
3.1 Bear Flag
* What it looks like: A sharp decline followed by a small upward-sloping rectangle.
* Meaning: After a strong drop, price consolidates before continuing lower.
* Key insight: A breakout below the flag suggests a continuation of the downtrend.
3.2 Pennant (Bearish)
* What it looks like: A sharp downward move followed by a small symmetrical triangle.
* Meaning: Similar to the bear flag, but the consolidation takes a triangular form.
* Key insight: A breakout downward typically resumes the bearish trend.
3.3 Inverse Cup & Handle
* What it looks like: An upside-down cup with a small upward drift forming the handle.
* Meaning: Indicates weakness after an uptrend, often followed by a drop.
* Key insight: A break below the handle usually signals a strong bearish move.
3.4 Head & Shoulders
* What it looks like: Three peaks, with the middle one being the highest.
* Meaning: A classic reversal pattern that indicates a potential shift from an uptrend to a downtrend.
* Key insight: A break below the “neckline” confirms the bearish reversal.
---
How to Use These Patterns
* Combine pattern recognition with support/resistance, volume, and indicators for stronger confirmation.
* Always wait for breakouts and avoid acting too early.
* Manage risk with stop-loss orders.
AUD/USD – Potential Bounce Buy SetupOANDA:AUDUSD
Timeframe: 30m
Type: Counter-trend / Bounce from Support
Risk Level: Medium to High
Possible Reward: 4+
🔹 Setup:
Price is testing the lower boundary of the recent support zone (0.6432 – 0.6420), aligning with the previous channel structure visible on the 8h chart. The descending move has shown initial signs of exhaustion, suggesting a potential bounce.
📈 Entry:
Current price zone 0.6432 – 0.6445
🎯 Targets (TP):
TP1: 0.64624
TP2: 0.64797
TP4: 0.65158
⛔ Stop Loss (SL):
0.64250 (below recent swing low and liquidity pool)
8H chart Overview:
Previous Position from top of Channel:
#AUDUSD #Forex #SmartMoney #PriceAction #MJTrading #ChartDesigner
Psychology Always Matters:

USD/CAD - 6C1! : Trade update FundamentalThe US dollar index (DXY) gained strength against major currencies on Monday following a landmark trade agreement between the United States and the European Union. During the meeting in Scotland on Sunday, President Donald Trump and European Commission President Ursula von der Leyen announced a new trade framework, which includes a 15% import tariff on EU goods—half of the 30% rate Trump had initially threatened to impose starting August 1.
The DXY opened higher at the start of the week, and it’s clear that most currencies are likely to see a decline in response. This trend also extends to pairs like the 6C1! (USDCAD), where the USD has been increasing its long positions. Last week, non-commercial traders added to their holdings, while commercial traders remain at their highest levels since 2021. Based on this setup, we are maintaining a bullish outlook and expect the continuation of our long position strategy.
Previous Idea :
✅ Please share your thoughts about USD/CAD in the comments section below and HIT LIKE if you appreciate my analysis. Don't forget to FOLLOW ME; you will help us a lot with this small contribution.

EUR/USD Setup Is Ready This is a bullish EUR/USD (Euro/US Dollar) 1-hour chart analysis. The setup indicates a potential upward reversal after a downtrend, supported by a series of higher lows.
Key elements:
Entry Point: Around 1.14044–1.14376.
Stop Loss: Placed below the recent low at 1.12770 to manage risk.
Targets:
First Target: 1.15034
Second Target: 1.15892
Third Target: 1.17238
The chart suggests a buy setup with a risk-reward strategy, aiming for a breakout and continuation towards higher resistance levels. The large upward arrow emphasizes bullish momentum expectations.

GBPUSD: Strong Trend-Following Pattern 🇬🇧🇺🇸
GBPUSD is going to drop lower.
The market has completed a correctional movement within
a bearish flag.
Its support violation provides a strong bearish confirmation.
I expect a drop to 1.3202 level.
❤️Please, support my work with like, thank you!❤️
I am part of Trade Nation's Influencer program and receive a monthly fee for using their TradingView charts in my analysis.

EURUSD – Retest Failed, Bearish Pressure RemainsHello, what’s your take on FX:EURUSD ?
After breaking the trendline, EURUSD attempted a retest but failed. The price is now hovering around 1.142, with selling pressure still evident.
This setup targets the 1.618 Fibonacci extension zone around 1.114. In the short term, a correction based on Dow Theory may unfold — the marked area could offer a perfect selling opportunity.
💡 Priority: SELL on RETEST – strict risk management with clear TP and SL.
Now it’s your turn — what’s your view? Share it in the comments below.
Good luck!

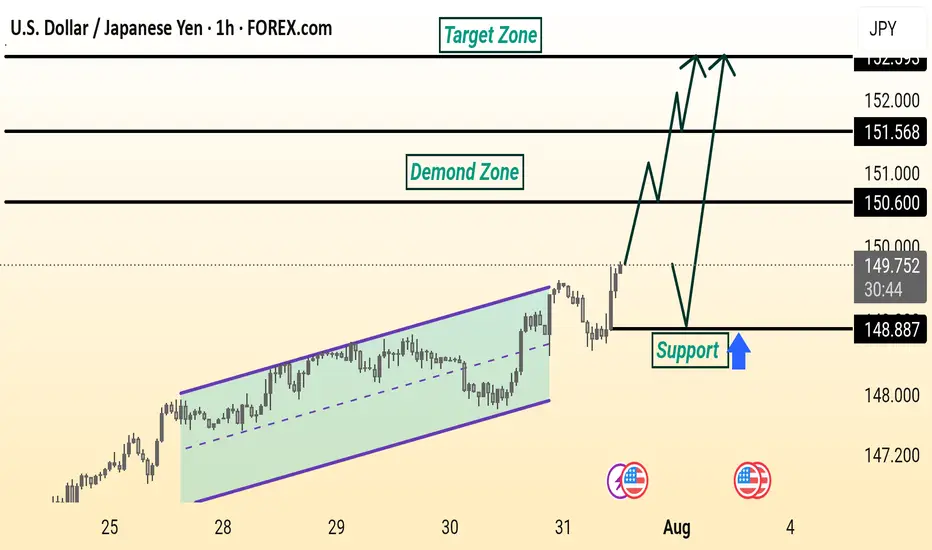
USD/JPY Analysis is Ready USD/JPY is showing a bullish setup. Price broke out of a rising channel and is expected to retest the 148.887 support level before moving higher toward the 150.600 and 151.568 resistance zones, targeting the 152.000 area. The demand zone adds strength to the potential upside.
AUDUSD Will Go Lower! Sell!
Please, check our technical outlook for AUDUSD.
Time Frame: 9h
Current Trend: Bearish
Sentiment: Overbought (based on 7-period RSI)
Forecast: Bearish
The market is approaching a significant resistance area 0.645.
Due to the fact that we see a positive bearish reaction from the underlined area, I strongly believe that sellers will manage to push the price all the way down to 0.637 level.
P.S
Overbought describes a period of time where there has been a significant and consistent upward move in price over a period of time without much pullback.
Disclosure: I am part of Trade Nation's Influencer program and receive a monthly fee for using their TradingView charts in my analysis.
Like and subscribe and comment my ideas if you enjoy them!
