XAUUSDHello Traders! 👋
What are your thoughts on GOLD?
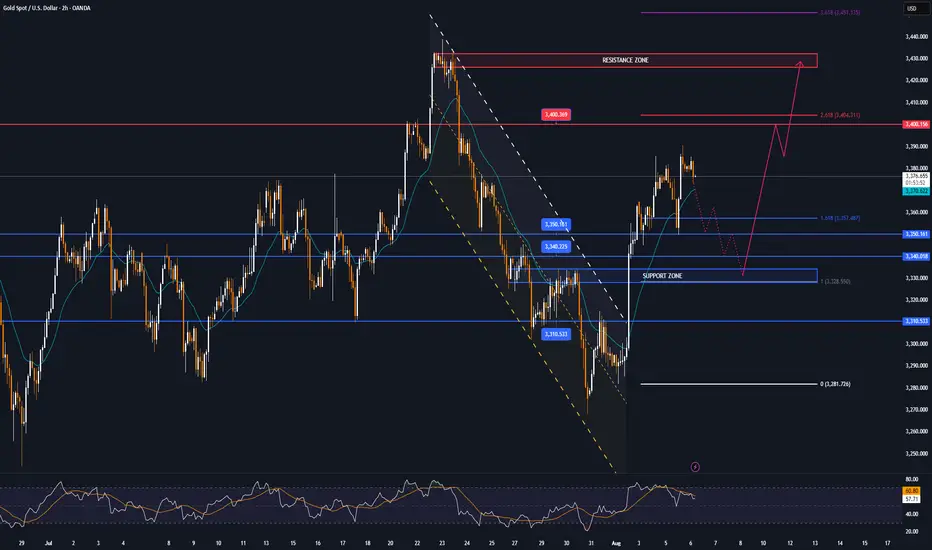
Gold remains trapped below the key $3,390–$3,400 resistance zone, which has rejected price multiple times in recent sessions.
A short-term pullback toward the marked support level is likely.
From that zone, we expect buyers to step in, leading to another bullish push toward the resistance, and this time, a potential breakout above the $3,400 level.
As long as the price stays above support, the bullish outlook remains intact.
A confirmed break above $3,400 could open the path toward new highs.
Don’t forget to like and share your thoughts in the comments! ❤️
Forex

CADJPY: Bullish Move Confirmed?! 🇨🇦🇯🇵
CADJPY is going to bounce from a key daily support.
With a high probability, 107.28 level will be reached soon.
❤️Please, support my work with like, thank you!❤️

USDCHF – Bullish comeback in progress?Hey everyone! What’s your take on the current trend of USDCHF?
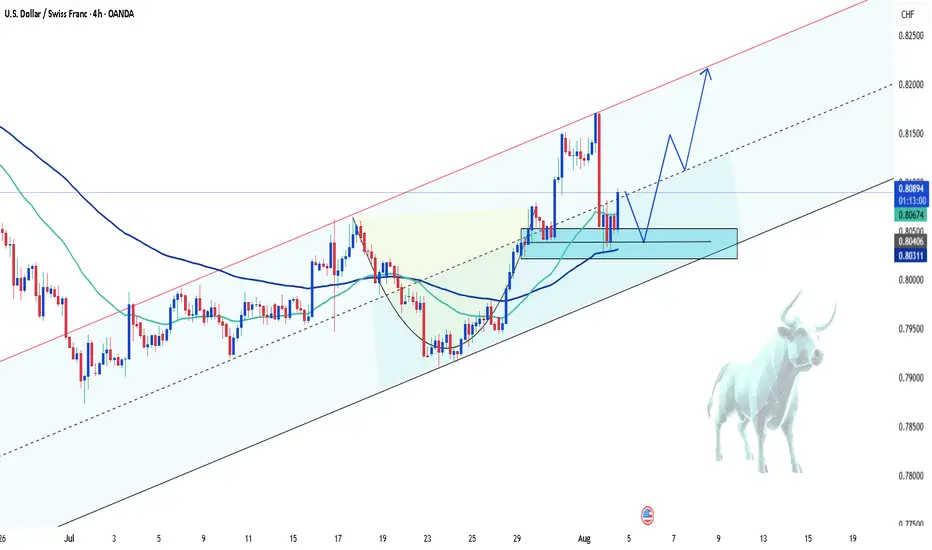
While the pair experienced a recent dip, take a step back and look at the bigger picture — doesn’t it still seem to be moving within an ascending channel?
Right now, USDCHF is hovering around 0.8092 and starting to bounce back. The recovery appears to be supported by a newly formed support zone and the confluence of the EMA 34 and 89. The pair seems to be eyeing the recent high, with potential to climb further toward the upper boundary of the channel.
My current bias? Bullish.
What about you — do you see the same opportunity?
Drop a comment and hit like if you’re on the same page!
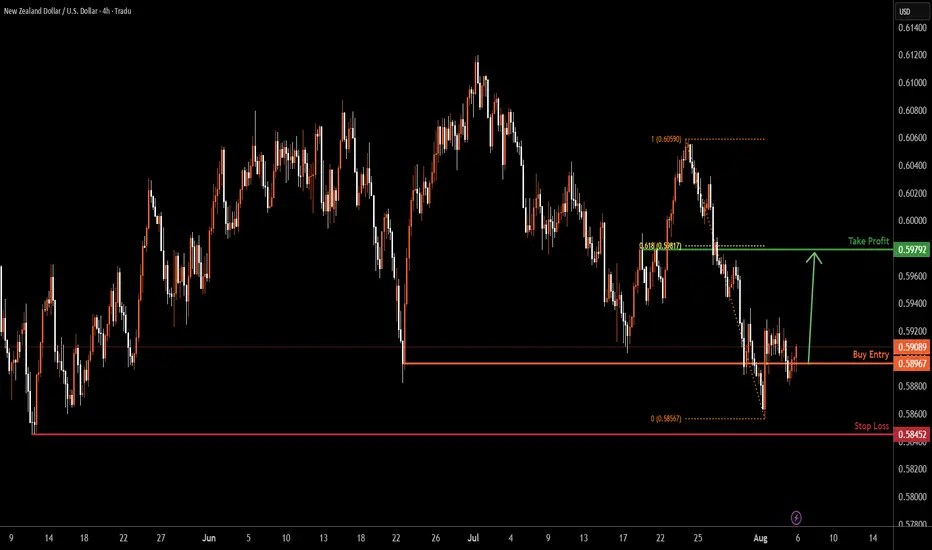
NZDUSD H4 | Bullish reversal for the KiwiBased on the H4 chart analysis, we can see that the price has bounced off the buy entry, which is a pullback support and could rise from this level to the take profit which aligns with the 61.8% Fibonacci retracement.
Buy entry is at 0.5896, which is a pullback support.
Stop loss is at 0.5845, which is a swing low support.
Take profit is at 0.5979, which is a pullback resistance that lines up with the 61.8% Fibonacci retracement.
High Risk Investment Warning
Trading Forex/CFDs on margin carries a high level of risk and may not be suitable for all investors. Leverage can work against you.
Stratos Markets Limited (tradu.com ):
CFDs are complex instruments and come with a high risk of losing money rapidly due to leverage. 65% of retail investor accounts lose money when trading CFDs with this provider. You should consider whether you understand how CFDs work and whether you can afford to take the high risk of losing your money.
Stratos Europe Ltd (tradu.com ):
CFDs are complex instruments and come with a high risk of losing money rapidly due to leverage. 66% of retail investor accounts lose money when trading CFDs with this provider. You should consider whether you understand how CFDs work and whether you can afford to take the high risk of losing your money.
Stratos Global LLC (tradu.com ):
Losses can exceed deposits.
Please be advised that the information presented on TradingView is provided to Tradu (‘Company’, ‘we’) by a third-party provider (‘TFA Global Pte Ltd’). Please be reminded that you are solely responsible for the trading decisions on your account. There is a very high degree of risk involved in trading. Any information and/or content is intended entirely for research, educational and informational purposes only and does not constitute investment or consultation advice or investment strategy. The information is not tailored to the investment needs of any specific person and therefore does not involve a consideration of any of the investment objectives, financial situation or needs of any viewer that may receive it. Kindly also note that past performance is not a reliable indicator of future results. Actual results may differ materially from those anticipated in forward-looking or past performance statements. We assume no liability as to the accuracy or completeness of any of the information and/or content provided herein and the Company cannot be held responsible for any omission, mistake nor for any loss or damage including without limitation to any loss of profit which may arise from reliance on any information supplied by TFA Global Pte Ltd.
The speaker(s) is neither an employee, agent nor representative of Tradu and is therefore acting independently. The opinions given are their own, constitute general market commentary, and do not constitute the opinion or advice of Tradu or any form of personal or investment advice. Tradu neither endorses nor guarantees offerings of third-party speakers, nor is Tradu responsible for the content, veracity or opinions of third-party speakers, presenters or participants.
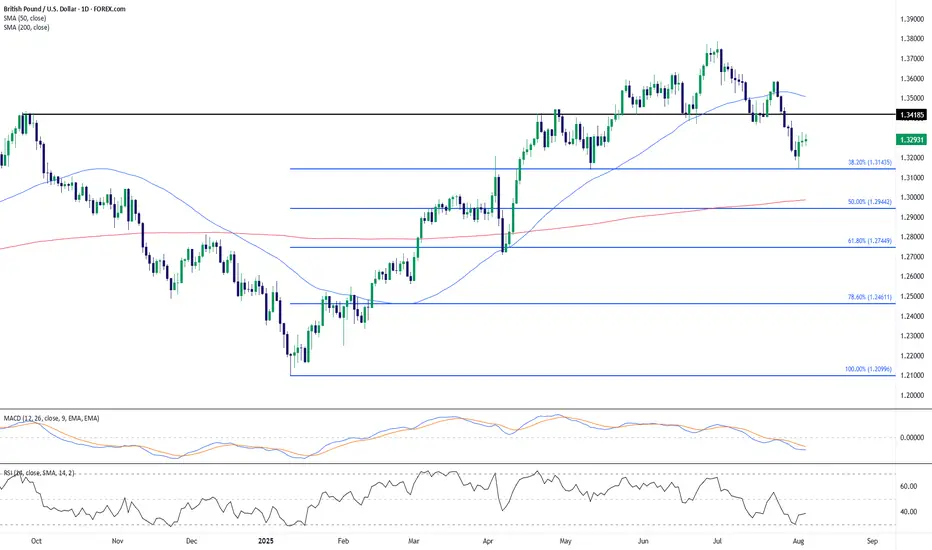
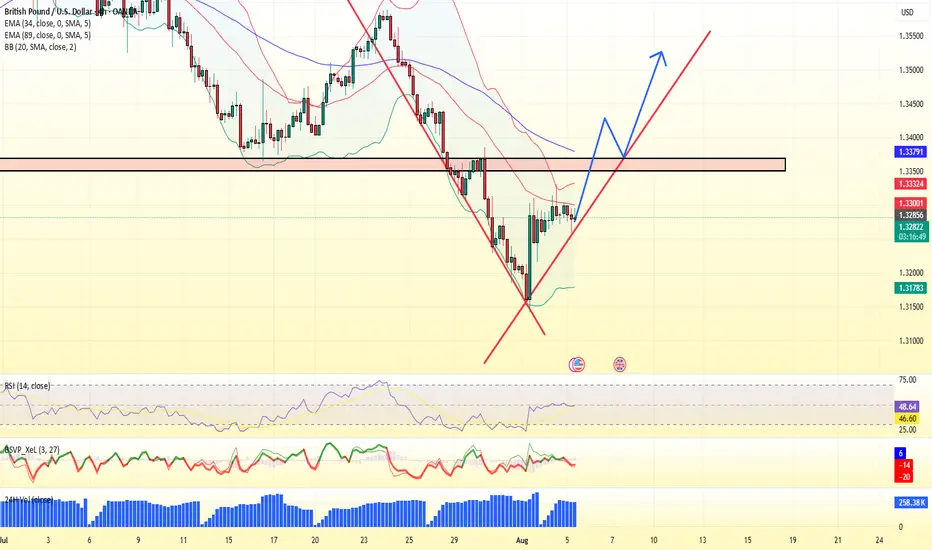
GBP/USD: Bullish Bounce from Fibonacci SupportCable has recently rebounded off the 38.2% Fibonacci retracement level around 1.3145, suggesting initial downside momentum is losing steam after the July high near 1.38. This bounce comes as RSI begins turning up from oversold territory (38.70), potentially hinting at early bullish divergence. Meanwhile, the MACD remains bearish, though its histogram shows signs of contraction.
Price action has slipped below the 50-day SMA (1.3508), but is still well above the 200-day SMA (1.2986), keeping the broader bullish structure intact. The area between 1.3145 and the 1.2940 (50% retracement) remains key support, while 1.3418 – a prior support now turned resistance – may act as a ceiling for any rebound attempts.
Key Takeaways:
Price has reacted positively to the 38.2% Fib level.
MACD remains weak but shows early signs of slowing downside.
RSI is attempting to reverse from near-oversold conditions.
1.3418 is the level to beat for bulls; below 1.3145 could open room to 1.2940.
Until we see a daily close above the prior support at 1.3418, upside may be limited to a corrective phase within a broader pullback. Short-term bullish attempts are likely to remain fragile unless supported by improving momentum and a reclaim of the 50-day SMA.
-MW
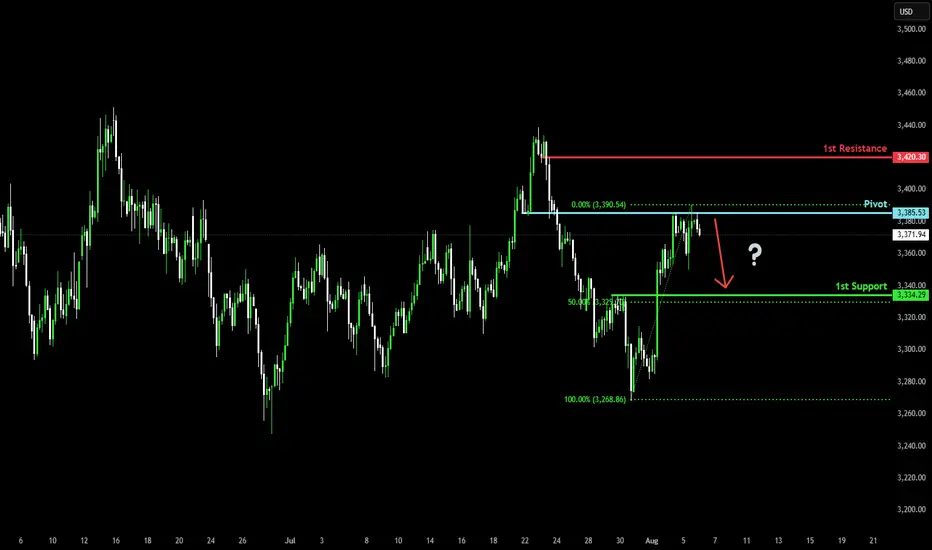
Bearish drop for the Gold?The price has rejected off the pivot which has been identified as a pullback resistance and could drop to the 50% Fibonacci support.
Pivot: 3,385.53
1st Support: 3,334.29
1st Resistance: 3,420.30
Risk Warning:
Trading Forex and CFDs carries a high level of risk to your capital and you should only trade with money you can afford to lose. Trading Forex and CFDs may not be suitable for all investors, so please ensure that you fully understand the risks involved and seek independent advice if necessary.
Disclaimer:
The above opinions given constitute general market commentary, and do not constitute the opinion or advice of IC Markets or any form of personal or investment advice.
Any opinions, news, research, analyses, prices, other information, or links to third-party sites contained on this website are provided on an "as-is" basis, are intended only to be informative, is not an advice nor a recommendation, nor research, or a record of our trading prices, or an offer of, or solicitation for a transaction in any financial instrument and thus should not be treated as such. The information provided does not involve any specific investment objectives, financial situation and needs of any specific person who may receive it. Please be aware, that past performance is not a reliable indicator of future performance and/or results. Past Performance or Forward-looking scenarios based upon the reasonable beliefs of the third-party provider are not a guarantee of future performance. Actual results may differ materially from those anticipated in forward-looking or past performance statements. IC Markets makes no representation or warranty and assumes no liability as to the accuracy or completeness of the information provided, nor any loss arising from any investment based on a recommendation, forecast or any information supplied by any third-party.
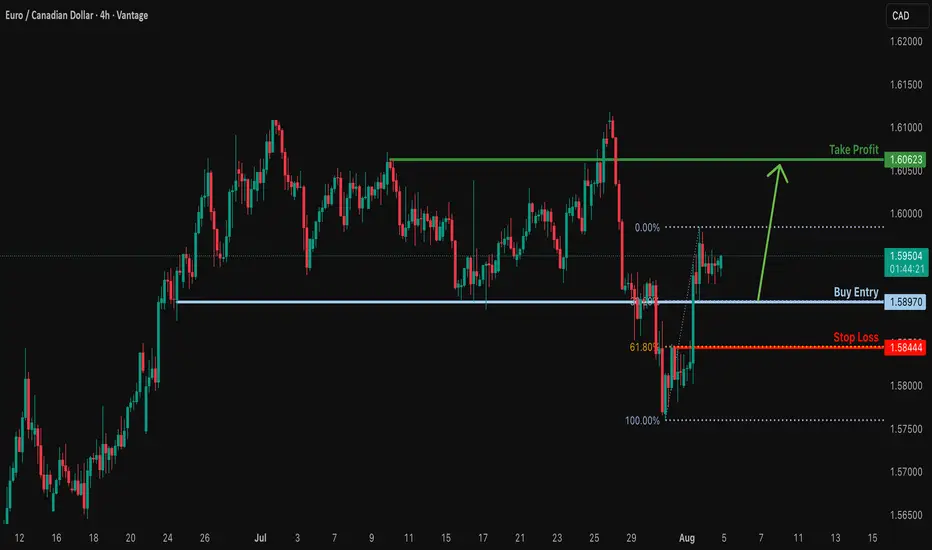
Bulllish bounce off?EUR/CAD is falling towards the support level which is a pullback support that aligns with the 38.2% Fibonacci retracement and could bounce from this level to our take profit.
Entry: 1.5897
Why we like it:
There is a pullback support that lines up with the 38.2% Fibonacci retracement.
Stop loss: 1.58444
Why we like it:
There is a pullback support that aligns with the 61.8% Fibonacci retracement.
Take profit: 1.60623
Why we like it:
There is a pullback resistance.
Enjoying your TradingView experience? Review us!
Please be advised that the information presented on TradingView is provided to Vantage (‘Vantage Global Limited’, ‘we’) by a third-party provider (‘Everest Fortune Group’). Please be reminded that you are solely responsible for the trading decisions on your account. There is a very high degree of risk involved in trading. Any information and/or content is intended entirely for research, educational and informational purposes only and does not constitute investment or consultation advice or investment strategy. The information is not tailored to the investment needs of any specific person and therefore does not involve a consideration of any of the investment objectives, financial situation or needs of any viewer that may receive it. Kindly also note that past performance is not a reliable indicator of future results. Actual results may differ materially from those anticipated in forward-looking or past performance statements. We assume no liability as to the accuracy or completeness of any of the information and/or content provided herein and the Company cannot be held responsible for any omission, mistake nor for any loss or damage including without limitation to any loss of profit which may arise from reliance on any information supplied by Everest Fortune Group.
Gold Set to Reach Historic HighsHello everyone, great to see you again!
Gold has been on a strong upward trajectory, breaking previous bearish structures and showing solid growth momentum. Market sentiment is heavily supported by the weakening of global currencies, particularly the US dollar, and expectations surrounding the potential interest rate cuts by the Federal Reserve.
Looking at the technical picture, we are approaching the historic peak of $3,433. The gold market is showing significant strength, confirmed by EMA 34 and EMA 89, as well as new support zones, signaling a trend reversal and confirming the bullish outlook.
The next few trading sessions could play a critical role in confirming whether the precious metal can break the all-time highs.
What do you think? Is gold about to make history? Let me know in the comments below!

Gold's Bullish Momentum: Heading Towards Historic Highs?Hey everyone, it's Alex here!
Yesterday, XAUUSD continued its upward trend and is now trading around 3.375 USD.
The price increase of gold is mainly driven by the bargain-hunting sentiment from speculators. After a slight drop in gold prices in the morning, buy orders were quickly triggered, taking advantage of the lower prices. Coupled with the weakening USD, this opened the door for a strong buying pressure on gold.
From a technical perspective, the current trend shows the beginning of a new bullish wave within a clearly defined uptrend channel. Notably, the EMA 34 and EMA 89 are converging closely, along with the breakout of previous resistance, which further increases the likelihood of the ongoing bullish momentum.
Regarding the outlook, I prefer buying in line with the prevailing trend. As long as the price holds above the newly established support (confirmed by previous resistance), the next target will be the upper boundary of the price channel, around 3,435 USD.
This is a key level that will determine whether the upward trend continues or if the market will experience a correction. It all depends on how the market reacts at that moment.
What do you think about the current gold trend? Feel free to share your thoughts in the comments!

GOLD trades in narrow range, leading market pulseThe current market pulse is still mainly revolving around the Trump-initiated tariff story, with spot OANDA:XAUUSD trading in a fairly narrow range and currently reported at $3,376/oz, down 0.13% on the day. Gold is also awaiting further impact from the Fed's interest rate cut, with a weaker Dollar providing support for non-yielding gold.
Tariff News Update
US President Donald Trump said on Tuesday (August 5) that US tariffs on imported semiconductors and pharmaceuticals will be announced “in about a week”. The progressive tariffs on imported pharmaceuticals could be as high as 250%.
US news agency Bloomberg News said the Trump administration is now preparing to target key economic sectors and pledge to reshape global trade.
“We’re going to start with a lower tariff on drugs, but within a year, not more than a year and a half, it’s going to be 150%, then 250% because we want drugs made in our country,” Trump said in an interview with CNBC on Tuesday. He did not specify what the initial tariff would be.
“We’re going to be announcing measures on semiconductors and chips, which is a different category,” Trump added. However, Trump did not provide further details.
The U.S. Commerce Department has been investigating the semiconductor market since April as it prepares for possible tariffs on an industry with estimated global sales of nearly $700 billion. The U.S. has imposed tariffs on imported cars, auto parts, as well as steel and aluminum under the Trump administration.
Tariffs on imported chips could significantly raise costs for major data center operators, including Microsoft Corp., OpenAI, Meta Platforms Inc. and Amazon.com Inc., which plan to spend billions of dollars on the advanced semiconductors needed to power their artificial intelligence businesses.
On the Fed’s interest-rate path
US job growth in July missed expectations, while nonfarm payrolls data for May and June were revised down significantly, with a combined loss of 258,000 jobs, suggesting a worsening labor market.
Furthermore, San Francisco Fed President Mary Daly said on Monday: "We may need more than two rate cuts, and more is likely." She also noted: "The labor market is not too weak, but it is weakening, and further weakening would be detrimental."
Surprising US labor market data and Daly’s dovish comments have all but confirmed the likelihood of a Fed rate cut in September. According to CME’s FedWatch tool, the market is now pricing in a 90% chance of a Fed rate cut in September.
OANDA:XAUUSD is often seen as a safe haven asset during times of political and economic uncertainty, and performs better in low-interest-rate environments.
Technical Outlook Analysis OANDA:XAUUSD
Gold is still trading in a fairly narrow range yesterday, but the price action is still mainly held above the EMA21 and it still has all the conditions for a possible increase. However, although the range is quite large, the overall situation is still showing a sideways accumulation trend.
Currently, gold is supported by the EMA21, followed by the short-term $3,310 level and the raw price point of $3,300. As long as it remains above the psychological $3,300 level, it is still eligible for a short-term bullish outlook.
Meanwhile, a break above $3,400 would open the door for a new short-term bullish cycle with the next target around $3,430 – $3,450.
On the momentum front, the RSI maintains its price action above 50 and is still far from the overbought zone (80 – 100) suggesting that there is still plenty of room for upside ahead.
During the day, in terms of technical position, gold has unchanged conditions that are inclined to increase in price, and the notable positions will be listed as follows.
Support: 3,350 – 3,340 – 3,310 USD
Resistance: 3,400 – 3,430 – 3,450 USD
SELL XAUUSD PRICE 3431 - 3429⚡️
↠↠ Stop Loss 3435
→Take Profit 1 3323
↨
→Take Profit 2 3317
BUY XAUUSD PRICE 3329 - 3331⚡️
↠↠ Stop Loss 3325
→Take Profit 1 3337
↨
→Take Profit 2 3343
AUD/USD Long Trade Setup – Buying at the Channel LowOANDA:AUDUSD
🔍 Technical Overview:
The pair is trading within a well-defined ascending channel.
A potential bullish reversal is forming at the confluence of:
Channel support
Local structural support (highlighted in orange circle)
Bullish wick rejections and slowing downside momentum
📈 Trade Idea: BUY AUD/USD
Entry: Market buy or buy near 0.6450 – 0.6465
Stop-Loss: Below the swing low and channel support at 0.64160
Target 1: 0.65150
Target 2: 0.6566
Target 3: 0.66160
Risk-to-Reward: ~1:3 R:R ratio
Monitor price action near mid-channel resistance
🧠 “If the structure speaks to you, let it echo.” – Let the price action confirm your bias before committing fully.
Previous Sell Setup at the top of channel:
Psychology Always Matters:

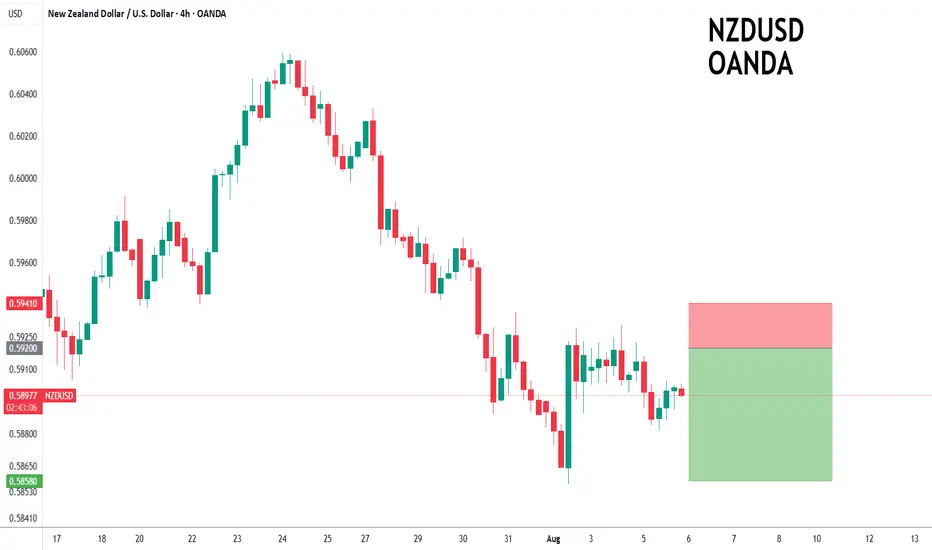
NZDUSD to continue in the downward move?NZDUSD - 24h expiry
There is no clear indication that the downward move is coming to an end.
Our short term bias remains negative.
50 4hour EMA is at 0.5931.
We look for a temporary move higher.
Risk/Reward would be poor to call a sell from current levels.
We look to Sell at 0.5920 (stop at 0.5941)
Our profit targets will be 0.5858 and 0.5848
Resistance: 0.5905 / 0.5930 / 0.5950
Support: 0.5881 / 0.5857 / 0.5830
Risk Disclaimer
The trade ideas beyond this page are for informational purposes only and do not constitute investment advice or a solicitation to trade. This information is provided by Signal Centre, a third-party unaffiliated with OANDA, and is intended for general circulation only. OANDA does not guarantee the accuracy of this information and assumes no responsibilities for the information provided by the third party. The information does not take into account the specific investment objectives, financial situation, or particular needs of any particular person. You should take into account your specific investment objectives, financial situation, and particular needs before making a commitment to trade, including seeking, under a separate engagement, as you deem fit.
You accept that you assume all risks in independently viewing the contents and selecting a chosen strategy.
Where the research is distributed in Singapore to a person who is not an Accredited Investor, Expert Investor or an Institutional Investor, Oanda Asia Pacific Pte Ltd (“OAP“) accepts legal responsibility for the contents of the report to such persons only to the extent required by law. Singapore customers should contact OAP at 6579 8289 for matters arising from, or in connection with, the information/research distributed.
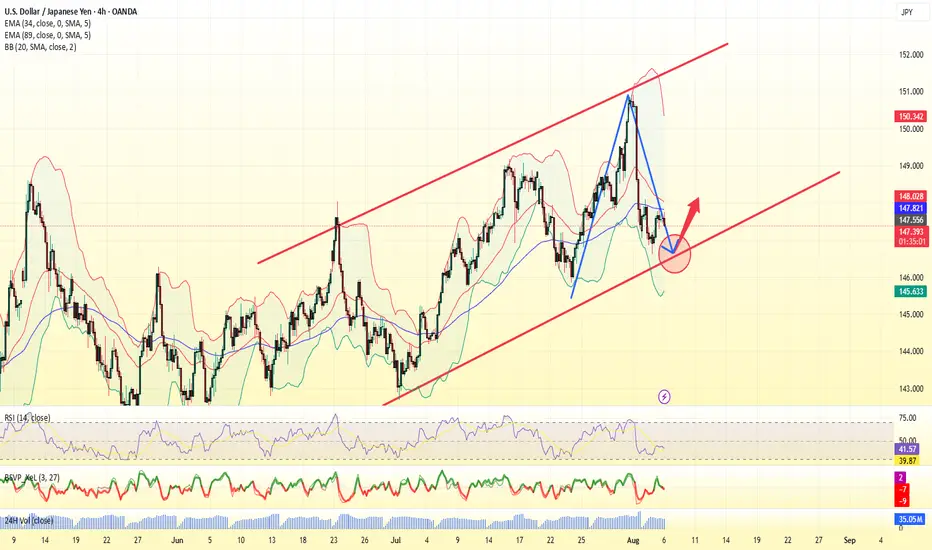
USDJPY Bullish Momentum Continues ? Hello traders, what do you think about USDJPY?
As of now, USDJPY is showing a slight upward movement after the recent correction. The price is trading around 147.59, not changing much since the beginning of the session.
The Japanese yen remains under pressure due to Japan’s slow recovery and ongoing economic challenges, giving USD an edge to capitalize on recent gains.
From a technical standpoint, USDJPY is moving in an ascending wedge pattern. After testing the trendline support near 147, the pair could be headed toward the psychological target of 150, or even higher towards the upper trendline boundary in the coming days.
Keep an eye on the price action near key resistance levels as the market continues to evaluate global economic factors, especially the upcoming US jobs data and Fed policy outlook.
What’s your take on USDJPY? Do you expect this pair to rise further? Let me know in the comments below!

Don’t Panic Yet… BTC Might Just Be ReloadingBitcoin is doing something it’s done before.
Every time CRYPTOCAP:BTC has pulled back into this key rising zone, it’s bounced back stronger. The last few dips got absorbed right at this level, and we’re seeing the same setup again now.
Price recently flipped a major resistance into new support, and that level is being tested again. If it holds, we’re likely looking at another leg up possibly towards $124K.
Nothing is broken. Just a typical retest in an uptrend.
DYOR, NFA
Thanks for the reading

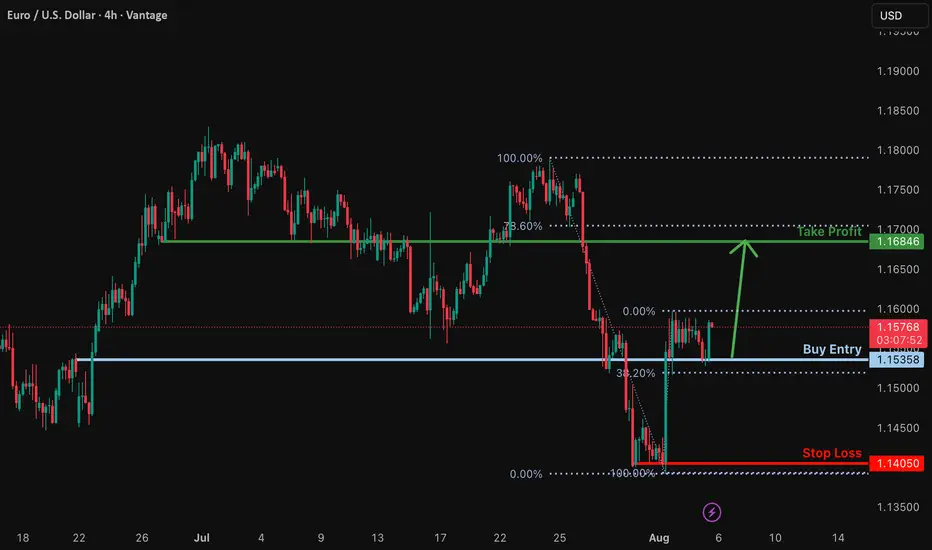
Bullish rise?EUR/USD has bounced off the support level, which is a pullback support that is slightly above the 38.2% Fibonacci retracement, and could rise from this level to our take profit.
Entry: 1.1535
Why we like it:
There is a pullback support that is slightly above the 38.2% Fibonacci retracement.
Stop loss: 1.1405
Why we like it:
There is a swing low support.
Take profit: 1.1684
Why we like it:
There is a pullback resistance that is slightly below the 78.6% Fibonacci retracement.
Enjoying your TradingView experience? Review us!
Please be advised that the information presented on TradingView is provided to Vantage (‘Vantage Global Limited’, ‘we’) by a third-party provider (‘Everest Fortune Group’). Please be reminded that you are solely responsible for the trading decisions on your account. There is a very high degree of risk involved in trading. Any information and/or content is intended entirely for research, educational and informational purposes only and does not constitute investment or consultation advice or investment strategy. The information is not tailored to the investment needs of any specific person and therefore does not involve a consideration of any of the investment objectives, financial situation or needs of any viewer that may receive it. Kindly also note that past performance is not a reliable indicator of future results. Actual results may differ materially from those anticipated in forward-looking or past performance statements. We assume no liability as to the accuracy or completeness of any of the information and/or content provided herein and the Company cannot be held responsible for any omission, mistake nor for any loss or damage including without limitation to any loss of profit which may arise from reliance on any information supplied by Everest Fortune Group.
USDCHF: The Necessary Return to the Manipulation ZoneIn the market, some zones act like magnets, pulling the price back to them. After a powerful move down, USDCHF has left behind a critical manipulation zone—a place where large capital needs to return to close their books before the real trend continues. This analysis is about waiting patiently at that exact spot.
The USDCHF pair continues to be in a global downtrend . After another powerful impulse down on the higher timeframe, the instrument corrected to the 78.6% Fibonacci level of the daily structure. This level, in conjunction with a daily order block, acted as strong resistance and pushed the price down, breaking the 4H corrective structure (BOS).
The interaction with the 78.6% level was accompanied by a manipulation in the form of a new daily order block , with a 4H order block residing inside it. If large capital intends to continue the downtrend, they will first need to close the losing long positions used to conduct the Buy-to-Sell (BTS) manipulation . This makes it a strong Point of Interest (POI) and a magnet for the price.
An additional argument for a short setup forming in this POI is that an untouched daily FVG remains slightly below. The mitigation of this FVG will be the minimum target if a setup is confirmed according to one of the two scenarios, provided the price reaches the POI before this rebalancing occurs.
Two Potential Short Scenarios
SCENARIO 1: Entry from the 61.8% Local Fib
This scenario involves the mitigation of the lower boundary of the daily order block in conjunction with reaching the 61.8% level of the local correction , and a reversal reaction from this confluence.
SCENARIO 2: Entry from the 78.6% Local Fib
If the 61.8% local level is broken, the second scenario comes into play, with the mitigation of the 4H order block in conjunction with the 78.6% level of the local correction , and a reversal reaction from there.
► Invalidation: A break of this level with the price finding acceptance above it would invalidate the short idea from this POI. In that case, the correction on the higher timeframe would continue higher, aiming to capture additional liquidity, at least from the June 19th high, which is also the daily structure's break level.
~~~~~~~~~~~~~~~~~~~~~~~~~~~~~~~~~~~~~~~~~~~~~~~~~~~~~~~~~~~~~~~~~
The principles and conditions for forming the manipulation zones I show in this trade idea are detailed in my educational publication, which was chosen by TradingView for the "Editor's Picks" category and received a huge amount of positive feedback from this insightful trading community. To better understand the logic I've used here and the general principles of price movement in most markets from the perspective of institutional capital, I highly recommend checking out this guide if you haven't already. 👇
P.S. This is not a prediction of the exact price direction. It is a description of high-probability setups that become valid only if specific conditions are met when the price reaches the marked POI. If the conditions are not met, the setups are invalid. No setup has a 100% success rate, so if you decide to use this trade idea, always apply a stop-loss and proper risk management. Trade smart.
~~~~~~~~~~~~~~~~~~~~~~~~~~~~~~~~~~~~~~~~~~~~~~~~~~~~~~~~~~~~~~~~~
If you found this analysis helpful, support it with a Boost! 🚀
Have a question or your own view on this idea? Share it in the comments. 💬
► Follow me on TradingView to get real-time updates on THIS idea (entry, targets & live trade management) and not to miss my next detailed breakdown.
~~~~~~~~~~~~~~~~~~~~~~~~~~~~~~~~~~~~~~~~~~~~~~~~~~~~~~~~~~~~~~~~~

Gold - M30 Buy SetupOANDA:XAUUSD TVC:GOLD
Timeframe: m30
Risk Level: Low-Medium
🔹 Setup:
Price is testing the boundary of the ascending channel and retesting the support @ 3350
📈 Entry:
Current price zone: 3360-65
🎯 Targets (TP):
TP1: 3375
TP2: 3385
TP4: 3410
TP6: 3430
⛔ Stop Loss (SL):
3349
H4 Overview:
PEPPERSTONE:XAUUSD
#XAUUSD #GOLD #Buy #Signal #MJTrading
Psychology Always Matters:

USD increased slightly and JPY decreased deeplyThe world USD price increased slightly. The USD-Index reached 98.79 points, 0.08 points higher than yesterday. According to CNBC, the USD increased in value compared to most currencies as the market focused on President Donald Trump's personnel nomination for the US Federal Reserve (Fed). Yesterday, President Donald Trump said he would soon announce decisions on replacing Governor Adriana Kugler, who resigned last Friday, including choosing the next Fed chair. Fed Chair Jerome Powell's term will end in May 2026.
Yesterday's report from the Institute for Supply Management said that the US non-manufacturing purchasing managers' index (PMI) in July fell to 50.1 from 50.8 in June. Economists polled by Reuters had forecast the services PMI would increase to 51.5. A PMI reading above 50 indicates growth in the services sector, which accounts for more than two-thirds of the economy. Investors are pricing in a high probability that the Fed will cut interest rates at its September meeting. Investment bank Goldman Sachs expects the Fed to deliver three consecutive 0.25% rate cuts starting in September...
Gold Price Analysis August 6In the Tokyo session this morning, gold recorded some selling pressure after strong buying pressure in the US session yesterday promoted profit-taking sentiment. It is expected that prices may continue to correct during the Asia-Europe session today before potential buying pressure returns in the London session.
Trading plan:
Scalping SELL: 3375
Support zone to watch for BUY: 3346 – 3333 – 3315 (priority when there is a clear price rejection signal)
Upside target: 3420

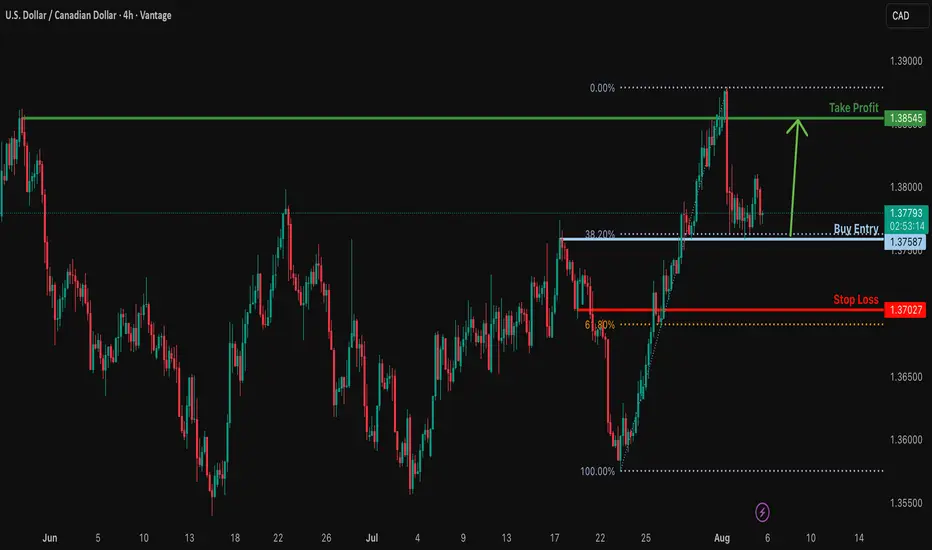
Bullish bounce off for the Loonie?The price is falling towards the support which is a pullback support that aligns with the 38.2% Fibonacci retracement and could bounce from this level to our take profit.
Entry: 1.3758
Why we like it:
There is a pullback support that lines up with the 38.2% Fibonacci retracement.
Stop loss: 1.3702
Why we like it:
There is a pullback support that is slightly above the 61.8% Fibonacci retracement.
Take profit: 1.3854
Why we like it:
There is a pullback resistance.
Enjoying your TradingView experience? Review us!
Please be advised that the information presented on TradingView is provided to Vantage (‘Vantage Global Limited’, ‘we’) by a third-party provider (‘Everest Fortune Group’). Please be reminded that you are solely responsible for the trading decisions on your account. There is a very high degree of risk involved in trading. Any information and/or content is intended entirely for research, educational and informational purposes only and does not constitute investment or consultation advice or investment strategy. The information is not tailored to the investment needs of any specific person and therefore does not involve a consideration of any of the investment objectives, financial situation or needs of any viewer that may receive it. Kindly also note that past performance is not a reliable indicator of future results. Actual results may differ materially from those anticipated in forward-looking or past performance statements. We assume no liability as to the accuracy or completeness of any of the information and/or content provided herein and the Company cannot be held responsible for any omission, mistake nor for any loss or damage including without limitation to any loss of profit which may arise from reliance on any information supplied by Everest Fortune Group.
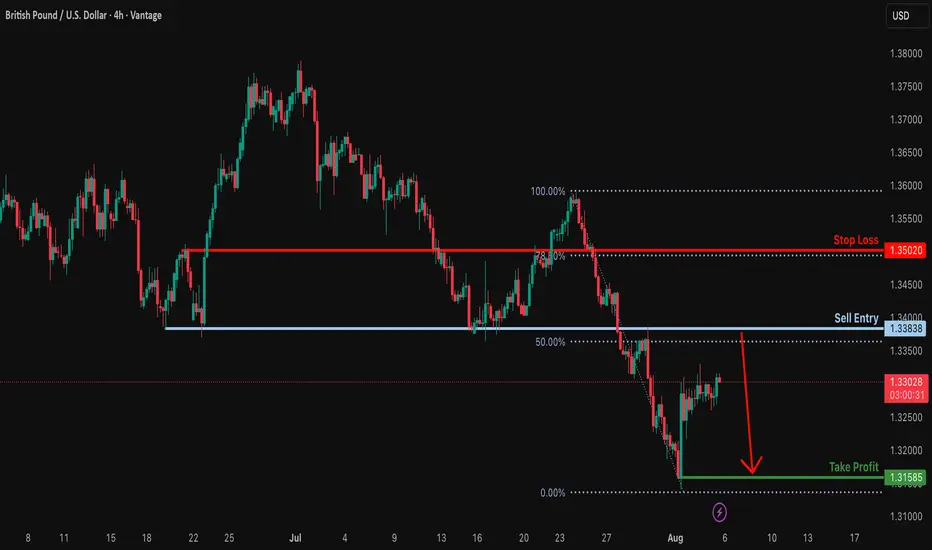
Bearish reversal off pullback resistance?GBP/USD is rising towards the resistance level, which is a pullback resistance that is slightly above the 50% Fibonacci retracement and could drop from this level to our take profit.
Entry: 1.3383
Why we like it:
There is a pullback resistance that is slightly above the 50% Fibonacci retracement.
Stop loss: 1.3502
Why we like it:
There is a pullback resistance that lines up with the 78.6% Fibonacci retracement.
Take profit: 1.3158
Why we like it:
There is a swing low support.
Enjoying your TradingView experience? Review us!
Please be advised that the information presented on TradingView is provided to Vantage (‘Vantage Global Limited’, ‘we’) by a third-party provider (‘Everest Fortune Group’). Please be reminded that you are solely responsible for the trading decisions on your account. There is a very high degree of risk involved in trading. Any information and/or content is intended entirely for research, educational and informational purposes only and does not constitute investment or consultation advice or investment strategy. The information is not tailored to the investment needs of any specific person and therefore does not involve a consideration of any of the investment objectives, financial situation or needs of any viewer that may receive it. Kindly also note that past performance is not a reliable indicator of future results. Actual results may differ materially from those anticipated in forward-looking or past performance statements. We assume no liability as to the accuracy or completeness of any of the information and/or content provided herein and the Company cannot be held responsible for any omission, mistake nor for any loss or damage including without limitation to any loss of profit which may arise from reliance on any information supplied by Everest Fortune Group.
Technical Scenario for TodayTechnical Scenario for Today
According to the current technical analysis:
If above 1.3384, resistance targets around 1.3408 or even 1.3438 could be targeted
Akhbar Forex
.
If 1.3351 is broken, the market could test lower support around 1.3321 or deeper if the pressure continues
📉 Expected intraday range
According to StockInvest's Daily Volatility model (based on 14-day ATR ~0.0064), GBP/USD could move within a range of ±0.48% from the opening price. If it opens around 1.330, the range could be 1.3246 – 1.3354
CoinCodex and MidForex also forecast an average price around 1.344, however this is more in line with the weekly and monthly forecasts, less related to intraday developments
coincodex.com
.
AUDUSD Is Bullish! Long!
Here is our detailed technical review for AUDUSD.
Time Frame: 1h
Current Trend: Bullish
Sentiment: Oversold (based on 7-period RSI)
Forecast: Bullish
The market is on a crucial zone of demand 0.646.
The oversold market condition in a combination with key structure gives us a relatively strong bullish signal with goal 0.647 level.
P.S
We determine oversold/overbought condition with RSI indicator.
When it drops below 30 - the market is considered to be oversold.
When it bounces above 70 - the market is considered to be overbought.
Disclosure: I am part of Trade Nation's Influencer program and receive a monthly fee for using their TradingView charts in my analysis.
Like and subscribe and comment my ideas if you enjoy them!
