USDCHF: The Necessary Return to the Manipulation ZoneIn the market, some zones act like magnets, pulling the price back to them. After a powerful move down, USDCHF has left behind a critical manipulation zone—a place where large capital needs to return to close their books before the real trend continues. This analysis is about waiting patiently at that exact spot.
The USDCHF pair continues to be in a global downtrend . After another powerful impulse down on the higher timeframe, the instrument corrected to the 78.6% Fibonacci level of the daily structure. This level, in conjunction with a daily order block, acted as strong resistance and pushed the price down, breaking the 4H corrective structure (BOS).
The interaction with the 78.6% level was accompanied by a manipulation in the form of a new daily order block , with a 4H order block residing inside it. If large capital intends to continue the downtrend, they will first need to close the losing long positions used to conduct the Buy-to-Sell (BTS) manipulation . This makes it a strong Point of Interest (POI) and a magnet for the price.
An additional argument for a short setup forming in this POI is that an untouched daily FVG remains slightly below. The mitigation of this FVG will be the minimum target if a setup is confirmed according to one of the two scenarios, provided the price reaches the POI before this rebalancing occurs.
Two Potential Short Scenarios
SCENARIO 1: Entry from the 61.8% Local Fib
This scenario involves the mitigation of the lower boundary of the daily order block in conjunction with reaching the 61.8% level of the local correction , and a reversal reaction from this confluence.
SCENARIO 2: Entry from the 78.6% Local Fib
If the 61.8% local level is broken, the second scenario comes into play, with the mitigation of the 4H order block in conjunction with the 78.6% level of the local correction , and a reversal reaction from there.
► Invalidation: A break of this level with the price finding acceptance above it would invalidate the short idea from this POI. In that case, the correction on the higher timeframe would continue higher, aiming to capture additional liquidity, at least from the June 19th high, which is also the daily structure's break level.
~~~~~~~~~~~~~~~~~~~~~~~~~~~~~~~~~~~~~~~~~~~~~~~~~~~~~~~~~~~~~~~~~
The principles and conditions for forming the manipulation zones I show in this trade idea are detailed in my educational publication, which was chosen by TradingView for the "Editor's Picks" category and received a huge amount of positive feedback from this insightful trading community. To better understand the logic I've used here and the general principles of price movement in most markets from the perspective of institutional capital, I highly recommend checking out this guide if you haven't already. 👇
P.S. This is not a prediction of the exact price direction. It is a description of high-probability setups that become valid only if specific conditions are met when the price reaches the marked POI. If the conditions are not met, the setups are invalid. No setup has a 100% success rate, so if you decide to use this trade idea, always apply a stop-loss and proper risk management. Trade smart.
~~~~~~~~~~~~~~~~~~~~~~~~~~~~~~~~~~~~~~~~~~~~~~~~~~~~~~~~~~~~~~~~~
If you found this analysis helpful, support it with a Boost! 🚀
Have a question or your own view on this idea? Share it in the comments. 💬
► Follow me on TradingView to get real-time updates on THIS idea (entry, targets & live trade management) and not to miss my next detailed breakdown.
~~~~~~~~~~~~~~~~~~~~~~~~~~~~~~~~~~~~~~~~~~~~~~~~~~~~~~~~~~~~~~~~~
Forex

BTC/USD - KEY SUPPORT BREAKOUT IN FOCUS!Bitcoin is currently trading near a critical support level, and price action is setting up for a decisive move.
📉 Bearish Scenario (Primary Bias):
Key support at ~$117,800 has broken, signaling a shift in market sentiment.
If the breakdown holds, we could see a strong bearish continuation toward the demand zone around $111,000.
Price may retest the broken support before the next leg down.
📈 Bullish Scenario (Alternate):
If buyers regain control and reclaim the broken support, BTC could retest the strong high at $120,700, and possibly push toward the supply zone near $123,000.
🔎 Structure Highlights:
Supply Zone: $122,000 – $123,000
Demand Zone: $110,000 – $111,500
Key Resistance/Support: $117,800
Strong High: ~$120,700
📌 Watch Closely:
Price behavior on the retest of the broken support
Bearish confirmation for downside continuation
Bullish reclaim for short-term recovery
A decisive move is near – be ready for both scenarios with tight risk management!

CADJPY: Bullish Move Confirmed?! 🇨🇦🇯🇵
CADJPY is going to bounce from a key daily support.
With a high probability, 107.28 level will be reached soon.
❤️Please, support my work with like, thank you!❤️

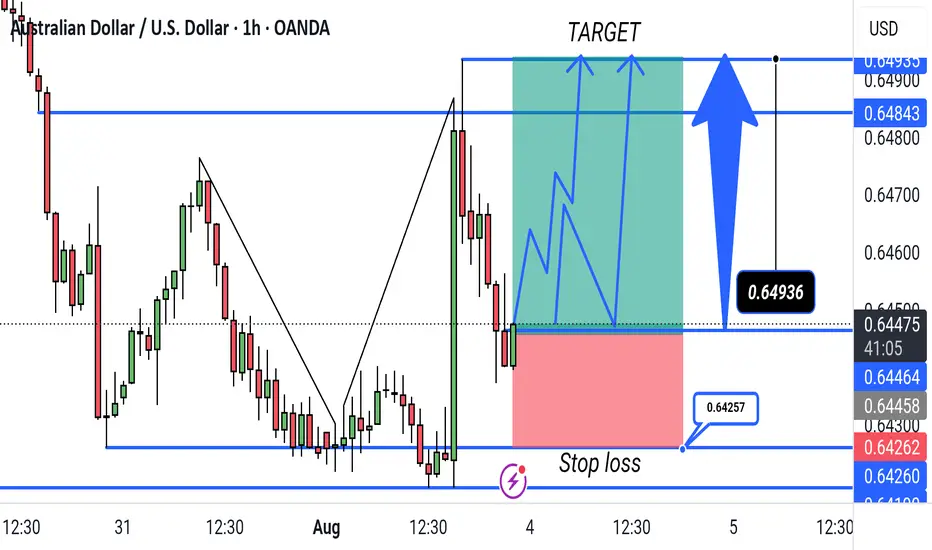
AUD/USD Long Trade Setup – Buying at the Channel LowOANDA:AUDUSD
🔍 Technical Overview:
The pair is trading within a well-defined ascending channel.
A potential bullish reversal is forming at the confluence of:
Channel support
Local structural support (highlighted in orange circle)
Bullish wick rejections and slowing downside momentum
📈 Trade Idea: BUY AUD/USD
Entry: Market buy or buy near 0.6450 – 0.6465
Stop-Loss: Below the swing low and channel support at 0.64160
Target 1: 0.65150
Target 2: 0.6566
Target 3: 0.66160
Risk-to-Reward: ~1:3 R:R ratio
Monitor price action near mid-channel resistance
🧠 “If the structure speaks to you, let it echo.” – Let the price action confirm your bias before committing fully.
Previous Sell Setup at the top of channel:
Psychology Always Matters:

ETHUSD Is Going Up! Buy!
Here is our detailed technical review for ETHUSD.
Time Frame: 2h
Current Trend: Bullish
Sentiment: Oversold (based on 7-period RSI)
Forecast: Bullish
The market is on a crucial zone of demand 3,601.00.
The oversold market condition in a combination with key structure gives us a relatively strong bullish signal with goal 3,751.96 level.
P.S
Please, note that an oversold/overbought condition can last for a long time, and therefore being oversold/overbought doesn't mean a price rally will come soon, or at all.
Disclosure: I am part of Trade Nation's Influencer program and receive a monthly fee for using their TradingView charts in my analysis.
Like and subscribe and comment my ideas if you enjoy them!

CHF/JPY SELLERS WILL DOMINATE THE MARKET|SHORT
Hello, Friends!
We are going short on the CHF/JPY with the target of 181.383 level, because the pair is overbought and will soon hit the resistance line above. We deduced the overbought condition from the price being near to the upper BB band. However, we should use low risk here because the 1W TF is green and gives us a counter-signal.
Disclosure: I am part of Trade Nation's Influencer program and receive a monthly fee for using their TradingView charts in my analysis.
✅LIKE AND COMMENT MY IDEAS✅

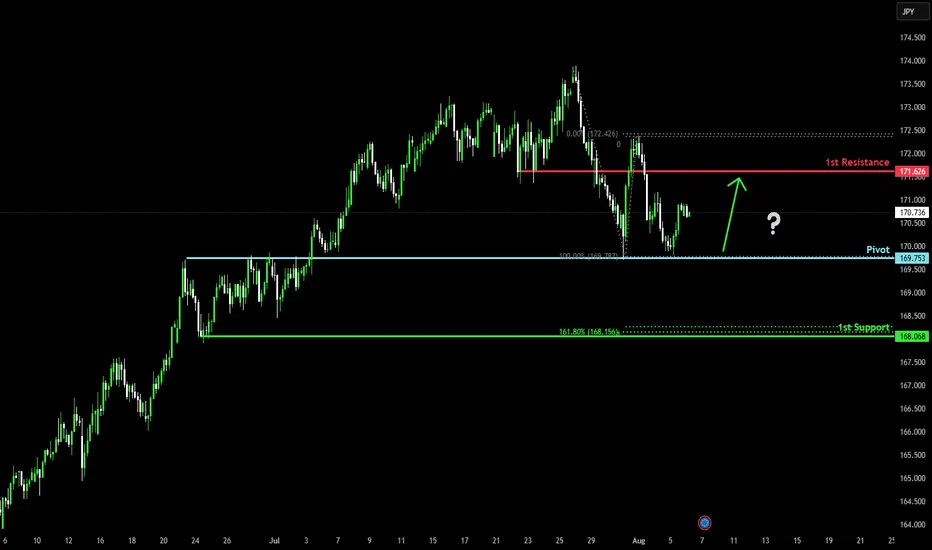
Bullish bounce off?EUR/JPY has bounced off the pivot which has been identified as an overlap support and could rise to the 1st resistance.
Pivot: 169.75
1st Support: 168.06
1st Resistance: 171.62
Risk Warning:
Trading Forex and CFDs carries a high level of risk to your capital and you should only trade with money you can afford to lose. Trading Forex and CFDs may not be suitable for all investors, so please ensure that you fully understand the risks involved and seek independent advice if necessary.
Disclaimer:
The above opinions given constitute general market commentary, and do not constitute the opinion or advice of IC Markets or any form of personal or investment advice.
Any opinions, news, research, analyses, prices, other information, or links to third-party sites contained on this website are provided on an "as-is" basis, are intended only to be informative, is not an advice nor a recommendation, nor research, or a record of our trading prices, or an offer of, or solicitation for a transaction in any financial instrument and thus should not be treated as such. The information provided does not involve any specific investment objectives, financial situation and needs of any specific person who may receive it. Please be aware, that past performance is not a reliable indicator of future performance and/or results. Past Performance or Forward-looking scenarios based upon the reasonable beliefs of the third-party provider are not a guarantee of future performance. Actual results may differ materially from those anticipated in forward-looking or past performance statements. IC Markets makes no representation or warranty and assumes no liability as to the accuracy or completeness of the information provided, nor any loss arising from any investment based on a recommendation, forecast or any information supplied by any third-party.
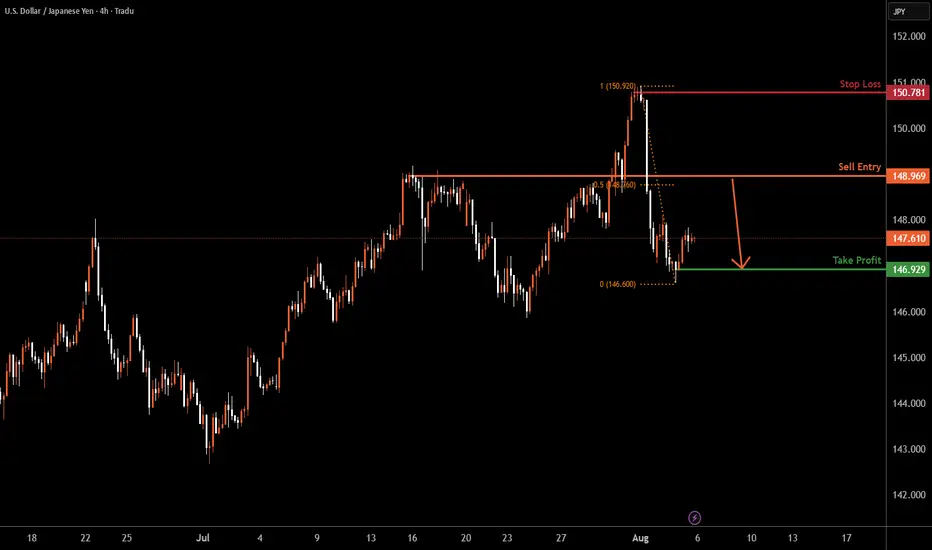
USDJPY H4 | Bearish reversal off pullback resistanceUSD/JPY is rising towards the sell entry which is a pullback resistance that is slightly above the 50% Fibonacci retracement and could drop from this level to the take profit.
Sell entry is at 148.96, which is a pullback resistance that is slightly above the 50% Fibonacci retracement.
Stop loss is at 150.78, which is a swing high resistance.
Take profit is at 146.92, which is a swing low support.
High Risk Investment Warning
Trading Forex/CFDs on margin carries a high level of risk and may not be suitable for all investors. Leverage can work against you.
Stratos Markets Limited (tradu.com ):
CFDs are complex instruments and come with a high risk of losing money rapidly due to leverage. 65% of retail investor accounts lose money when trading CFDs with this provider. You should consider whether you understand how CFDs work and whether you can afford to take the high risk of losing your money.
Stratos Europe Ltd (tradu.com ):
CFDs are complex instruments and come with a high risk of losing money rapidly due to leverage. 66% of retail investor accounts lose money when trading CFDs with this provider. You should consider whether you understand how CFDs work and whether you can afford to take the high risk of losing your money.
Stratos Global LLC (tradu.com ):
Losses can exceed deposits.
Please be advised that the information presented on TradingView is provided to Tradu (‘Company’, ‘we’) by a third-party provider (‘TFA Global Pte Ltd’). Please be reminded that you are solely responsible for the trading decisions on your account. There is a very high degree of risk involved in trading. Any information and/or content is intended entirely for research, educational and informational purposes only and does not constitute investment or consultation advice or investment strategy. The information is not tailored to the investment needs of any specific person and therefore does not involve a consideration of any of the investment objectives, financial situation or needs of any viewer that may receive it. Kindly also note that past performance is not a reliable indicator of future results. Actual results may differ materially from those anticipated in forward-looking or past performance statements. We assume no liability as to the accuracy or completeness of any of the information and/or content provided herein and the Company cannot be held responsible for any omission, mistake nor for any loss or damage including without limitation to any loss of profit which may arise from reliance on any information supplied by TFA Global Pte Ltd.
The speaker(s) is neither an employee, agent nor representative of Tradu and is therefore acting independently. The opinions given are their own, constitute general market commentary, and do not constitute the opinion or advice of Tradu or any form of personal or investment advice. Tradu neither endorses nor guarantees offerings of third-party speakers, nor is Tradu responsible for the content, veracity or opinions of third-party speakers, presenters or participants.
EUR-USD Bullish Breakout! Buy!
Hello,Traders!
EUR-USD is going up now
And the pair made a bullish
Breakout of the key horizontal
Level of 1.1593 and the breakout
Is confirmed so we are bullish
Biased and we will be
Expecting a further
Bullish move up
Buy!
Comment and subscribe to help us grow!
Check out other forecasts below too!
Disclosure: I am part of Trade Nation's Influencer program and receive a monthly fee for using their TradingView charts in my analysis.

USDCAD Will Go Down From Resistance! Short!
Please, check our technical outlook for USDCAD.
Time Frame: 1D
Current Trend: Bearish
Sentiment: Overbought (based on 7-period RSI)
Forecast: Bearish
The market is trading around a solid horizontal structure 1.375.
The above observations make me that the market will inevitably achieve 1.362 level.
P.S
We determine oversold/overbought condition with RSI indicator.
When it drops below 30 - the market is considered to be oversold.
When it bounces above 70 - the market is considered to be overbought.
Disclosure: I am part of Trade Nation's Influencer program and receive a monthly fee for using their TradingView charts in my analysis.
Like and subscribe and comment my ideas if you enjoy them!

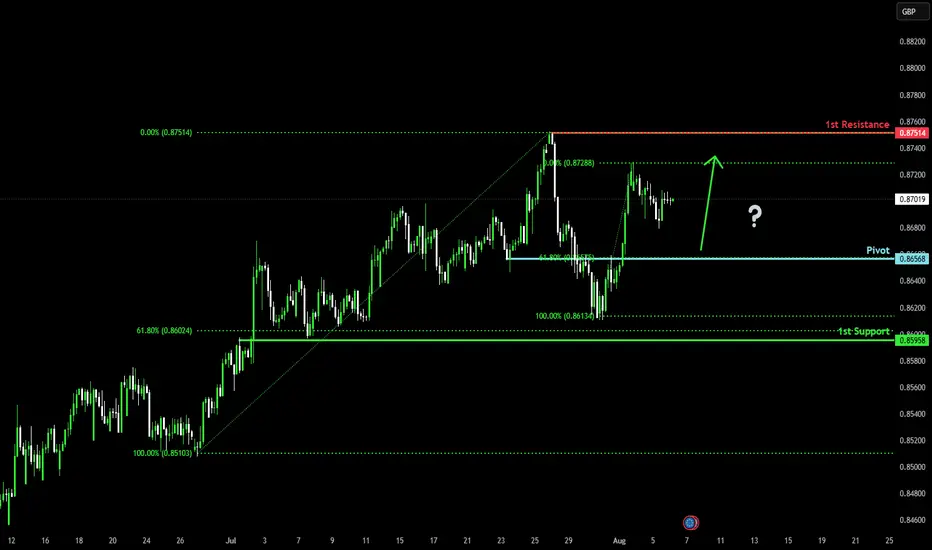
Falling towards 61.8% Fibonacci support?EUR/GBP is falling towards the pivot and could bounce to the 1st resistance which is a swing high resistance.
Pivot: 0.8656
1st Support: 0.8595
1st Resistance: 0.8751
Risk Warning:
Trading Forex and CFDs carries a high level of risk to your capital and you should only trade with money you can afford to lose. Trading Forex and CFDs may not be suitable for all investors, so please ensure that you fully understand the risks involved and seek independent advice if necessary.
Disclaimer:
The above opinions given constitute general market commentary, and do not constitute the opinion or advice of IC Markets or any form of personal or investment advice.
Any opinions, news, research, analyses, prices, other information, or links to third-party sites contained on this website are provided on an "as-is" basis, are intended only to be informative, is not an advice nor a recommendation, nor research, or a record of our trading prices, or an offer of, or solicitation for a transaction in any financial instrument and thus should not be treated as such. The information provided does not involve any specific investment objectives, financial situation and needs of any specific person who may receive it. Please be aware, that past performance is not a reliable indicator of future performance and/or results. Past Performance or Forward-looking scenarios based upon the reasonable beliefs of the third-party provider are not a guarantee of future performance. Actual results may differ materially from those anticipated in forward-looking or past performance statements. IC Markets makes no representation or warranty and assumes no liability as to the accuracy or completeness of the information provided, nor any loss arising from any investment based on a recommendation, forecast or any information supplied by any third-party.
Could the price bounce from here?EUR/CAD has bounced off the pivot which is a pullback support, and could rise to the 1st resistanc,e which is a multi-swing high.
Pivot: 1.58922
1st Support: 1.57671
1st Resistance: 1.61066
Risk Warning:
Trading Forex and CFDs carries a high level of risk to your capital and you should only trade with money you can afford to lose. Trading Forex and CFDs may not be suitable for all investors, so please ensure that you fully understand the risks involved and seek independent advice if necessary.
Disclaimer:
The above opinions given constitute general market commentary, and do not constitute the opinion or advice of IC Markets or any form of personal or investment advice.
Any opinions, news, research, analyses, prices, other information, or links to third-party sites contained on this website are provided on an "as-is" basis, are intended only to be informative, is not an advice nor a recommendation, nor research, or a record of our trading prices, or an offer of, or solicitation for a transaction in any financial instrument and thus should not be treated as such. The information provided does not involve any specific investment objectives, financial situation and needs of any specific person who may receive it. Please be aware, that past performance is not a reliable indicator of future performance and/or results. Past Performance or Forward-looking scenarios based upon the reasonable beliefs of the third-party provider are not a guarantee of future performance. Actual results may differ materially from those anticipated in forward-looking or past performance statements. IC Markets makes no representation or warranty and assumes no liability as to the accuracy or completeness of the information provided, nor any loss arising from any investment based on a recommendation, forecast or any information supplied by any third-party.

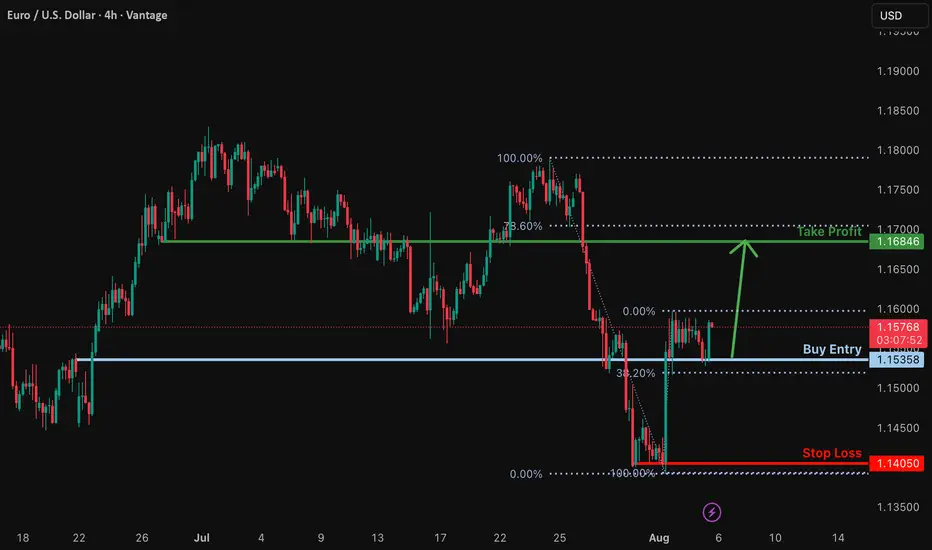
Bullish rise?EUR/USD has bounced off the support level, which is a pullback support that is slightly above the 38.2% Fibonacci retracement, and could rise from this level to our take profit.
Entry: 1.1535
Why we like it:
There is a pullback support that is slightly above the 38.2% Fibonacci retracement.
Stop loss: 1.1405
Why we like it:
There is a swing low support.
Take profit: 1.1684
Why we like it:
There is a pullback resistance that is slightly below the 78.6% Fibonacci retracement.
Enjoying your TradingView experience? Review us!
Please be advised that the information presented on TradingView is provided to Vantage (‘Vantage Global Limited’, ‘we’) by a third-party provider (‘Everest Fortune Group’). Please be reminded that you are solely responsible for the trading decisions on your account. There is a very high degree of risk involved in trading. Any information and/or content is intended entirely for research, educational and informational purposes only and does not constitute investment or consultation advice or investment strategy. The information is not tailored to the investment needs of any specific person and therefore does not involve a consideration of any of the investment objectives, financial situation or needs of any viewer that may receive it. Kindly also note that past performance is not a reliable indicator of future results. Actual results may differ materially from those anticipated in forward-looking or past performance statements. We assume no liability as to the accuracy or completeness of any of the information and/or content provided herein and the Company cannot be held responsible for any omission, mistake nor for any loss or damage including without limitation to any loss of profit which may arise from reliance on any information supplied by Everest Fortune Group.
"AUD/USD Bullish Breakout Setup – 1H Timeframe. This chart shows a bullish trade setup for AUD/USD on the 1-hour timeframe. The entry is near 0.64464, with a target at 0.64843 and a stop loss at 0.64257. The trade aims to capitalize on a potential upward breakout following a support bounce.
USD may weaken in the futureExperts say the USD is still under pressure after the US economy announced a "shocking" non-farm payrolls report for July and revised the May and June figures down sharply compared to forecasts and previous figures.
Experts say the rapidly weakening job market is fueling speculation that the US Federal Reserve (Fed) will soon cut interest rates in September.
However, in the last session, the USD basically stopped falling sharply, when data on the US service and aggregate purchasing managers' indexes increased quite well in July. This has helped the USD not to fall too much.
The USD is expected to remain volatile when the US announces weekly employment on Thursday. Next week is the July consumer price index (CPI). This is an important indicator for the Fed to make a decision on interest rate policy at its meeting in September. This index will strongly affect the trend of the USD.

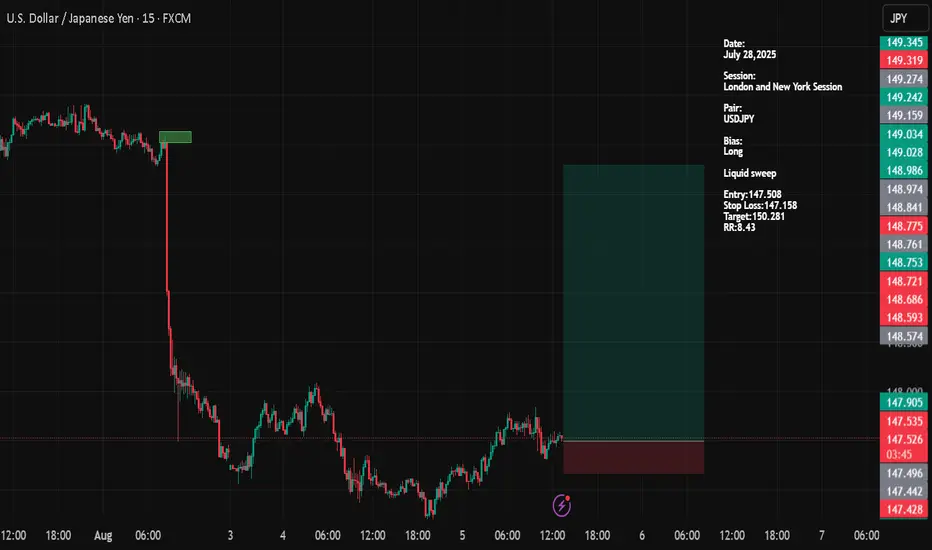
USDJPYDate:
August 05,2025
Session:
New York Session
Pair:
USDJPY
Bias:
Long
Liquid sweep
Entry:147.508
Stop Loss:147.158
Target:150.281
RR:8.43
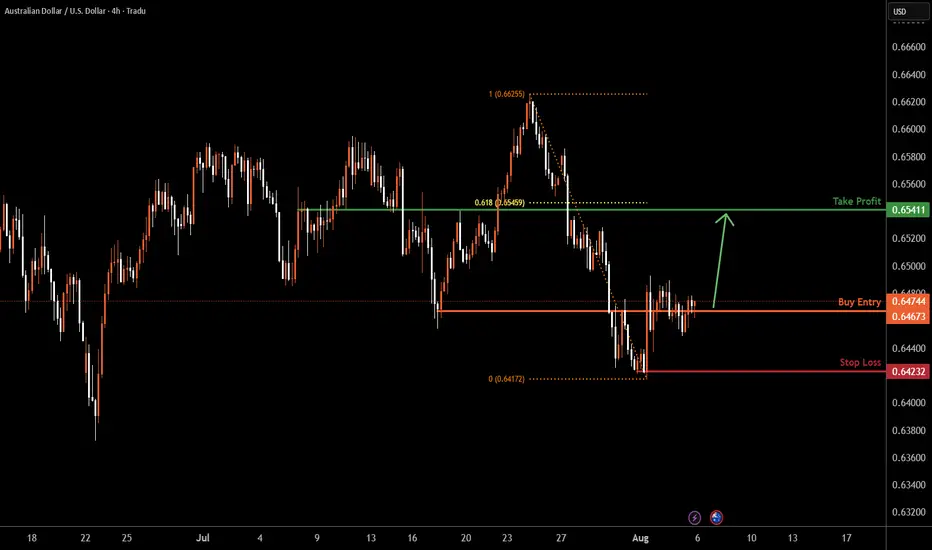
AUDUSD H4 | Could the Aussie reverse from hereAUD/USD is reacting off the buy entry which is a an overlap support and could rise from this level to the upside.
Buy entry is at 0.6472, which is an overlap support.
Stop loss is at 0.6423, which is a swing low support.
Take profit is at 0.6541, which is a pullback resistance that lines up with the 61.8% Fibonacci retracement.
High Risk Investment Warning
Trading Forex/CFDs on margin carries a high level of risk and may not be suitable for all investors. Leverage can work against you.
Stratos Markets Limited (tradu.com ):
CFDs are complex instruments and come with a high risk of losing money rapidly due to leverage. 65% of retail investor accounts lose money when trading CFDs with this provider. You should consider whether you understand how CFDs work and whether you can afford to take the high risk of losing your money.
Stratos Europe Ltd (tradu.com ):
CFDs are complex instruments and come with a high risk of losing money rapidly due to leverage. 66% of retail investor accounts lose money when trading CFDs with this provider. You should consider whether you understand how CFDs work and whether you can afford to take the high risk of losing your money.
Stratos Global LLC (tradu.com ):
Losses can exceed deposits.
Please be advised that the information presented on TradingView is provided to Tradu (‘Company’, ‘we’) by a third-party provider (‘TFA Global Pte Ltd’). Please be reminded that you are solely responsible for the trading decisions on your account. There is a very high degree of risk involved in trading. Any information and/or content is intended entirely for research, educational and informational purposes only and does not constitute investment or consultation advice or investment strategy. The information is not tailored to the investment needs of any specific person and therefore does not involve a consideration of any of the investment objectives, financial situation or needs of any viewer that may receive it. Kindly also note that past performance is not a reliable indicator of future results. Actual results may differ materially from those anticipated in forward-looking or past performance statements. We assume no liability as to the accuracy or completeness of any of the information and/or content provided herein and the Company cannot be held responsible for any omission, mistake nor for any loss or damage including without limitation to any loss of profit which may arise from reliance on any information supplied by TFA Global Pte Ltd.
The speaker(s) is neither an employee, agent nor representative of Tradu and is therefore acting independently. The opinions given are their own, constitute general market commentary, and do not constitute the opinion or advice of Tradu or any form of personal or investment advice. Tradu neither endorses nor guarantees offerings of third-party speakers, nor is Tradu responsible for the content, veracity or opinions of third-party speakers, presenters or participants.
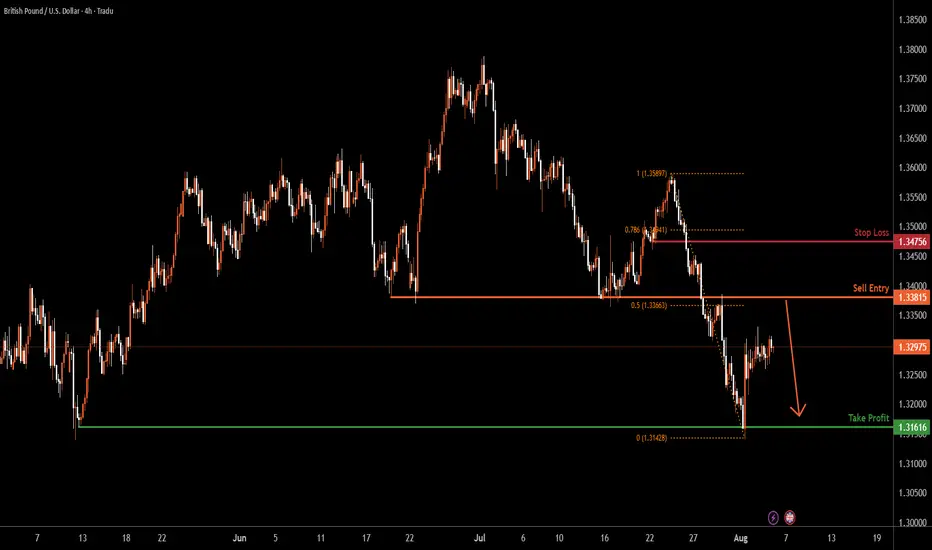
GBPUSD H4 | Bearish reversal off pullback resistanceThe Cable (GBP/USD) is rising towards the sell entry at 1.3381, which acts as a pullback resistance and could drop to the downside.
Stop loss is at 1.3475, which is a pullback resistance that is slightly below the 78.6% Fibonacci retracement.
Take profit is at 1.3161, which is a multi-swing low support.
High Risk Investment Warning
Trading Forex/CFDs on margin carries a high level of risk and may not be suitable for all investors. Leverage can work against you.
Stratos Markets Limited (tradu.com ):
CFDs are complex instruments and come with a high risk of losing money rapidly due to leverage. 65% of retail investor accounts lose money when trading CFDs with this provider. You should consider whether you understand how CFDs work and whether you can afford to take the high risk of losing your money.
Stratos Europe Ltd (tradu.com ):
CFDs are complex instruments and come with a high risk of losing money rapidly due to leverage. 66% of retail investor accounts lose money when trading CFDs with this provider. You should consider whether you understand how CFDs work and whether you can afford to take the high risk of losing your money.
Stratos Global LLC (tradu.com ):
Losses can exceed deposits.
Please be advised that the information presented on TradingView is provided to Tradu (‘Company’, ‘we’) by a third-party provider (‘TFA Global Pte Ltd’). Please be reminded that you are solely responsible for the trading decisions on your account. There is a very high degree of risk involved in trading. Any information and/or content is intended entirely for research, educational and informational purposes only and does not constitute investment or consultation advice or investment strategy. The information is not tailored to the investment needs of any specific person and therefore does not involve a consideration of any of the investment objectives, financial situation or needs of any viewer that may receive it. Kindly also note that past performance is not a reliable indicator of future results. Actual results may differ materially from those anticipated in forward-looking or past performance statements. We assume no liability as to the accuracy or completeness of any of the information and/or content provided herein and the Company cannot be held responsible for any omission, mistake nor for any loss or damage including without limitation to any loss of profit which may arise from reliance on any information supplied by TFA Global Pte Ltd.
The speaker(s) is neither an employee, agent nor representative of Tradu and is therefore acting independently. The opinions given are their own, constitute general market commentary, and do not constitute the opinion or advice of Tradu or any form of personal or investment advice. Tradu neither endorses nor guarantees offerings of third-party speakers, nor is Tradu responsible for the content, veracity or opinions of third-party speakers, presenters or participants.
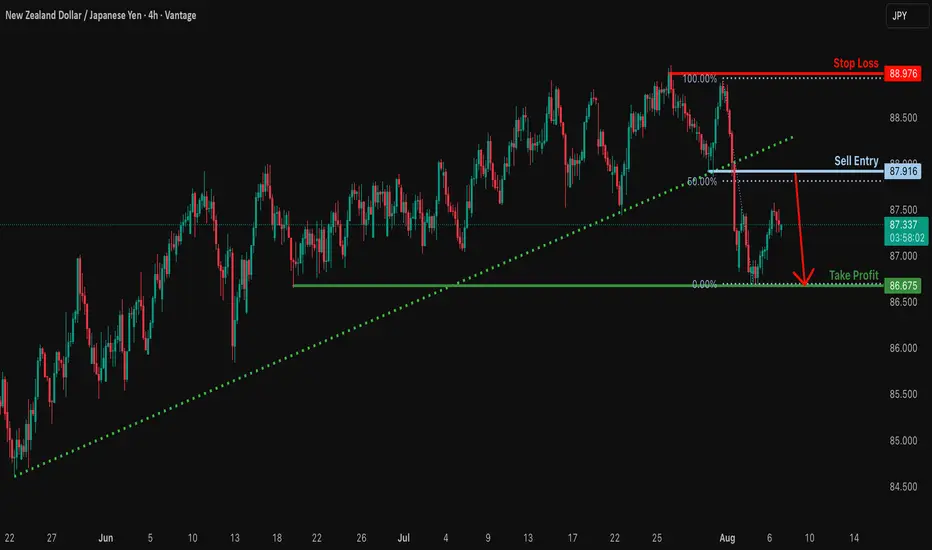
Bearish reversal?NZD/JPY is rising towards the resistance level which is a pullback resistance that aligns with the 50% Fibonacci retracement and could drop from this level to our take profit.
Entry: 87.91
Why we like it:
There is a pullback resistance that lines up with the 50% Fibonacci retracement.
Stop loss: 88.97
Why we like it:
There is a multi swing high resistance.
Take profit: 86.67
Why we like it:
There is amulti swing low support.
Enjoying your TradingView experience? Review us!
Please be advised that the information presented on TradingView is provided to Vantage (‘Vantage Global Limited’, ‘we’) by a third-party provider (‘Everest Fortune Group’). Please be reminded that you are solely responsible for the trading decisions on your account. There is a very high degree of risk involved in trading. Any information and/or content is intended entirely for research, educational and informational purposes only and does not constitute investment or consultation advice or investment strategy. The information is not tailored to the investment needs of any specific person and therefore does not involve a consideration of any of the investment objectives, financial situation or needs of any viewer that may receive it. Kindly also note that past performance is not a reliable indicator of future results. Actual results may differ materially from those anticipated in forward-looking or past performance statements. We assume no liability as to the accuracy or completeness of any of the information and/or content provided herein and the Company cannot be held responsible for any omission, mistake nor for any loss or damage including without limitation to any loss of profit which may arise from reliance on any information supplied by Everest Fortune Group.
GBPUSD Massive Short! SELL!
My dear friends,
My technical analysis for GBPUSD is below:
The market is trading on 1.3309 pivot level.
Bias - Bearish
Technical Indicators: Both Super Trend & Pivot HL indicate a highly probable Bearish continuation.
Target - 1.3295
Recommended Stop Loss - 1.3316
About Used Indicators:
A pivot point is a technical analysis indicator, or calculations, used to determine the overall trend of the market over different time frames.
Disclosure: I am part of Trade Nation's Influencer program and receive a monthly fee for using their TradingView charts in my analysis.
———————————
WISH YOU ALL LUCK

USDJPY: Long Trade Explained
USDJPY
- Classic bullish formation
- Our team expects growth
SUGGESTED TRADE:
Swing Trade
Buy USDJPY
Entry Level - 147.26
Sl - 147.12
Tp - 147.53
Our Risk - 1%
Start protection of your profits from lower levels
Disclosure: I am part of Trade Nation's Influencer program and receive a monthly fee for using their TradingView charts in my analysis.
❤️ Please, support our work with like & comment! ❤️

NZDUSD Will Go Higher! Long!
Here is our detailed technical review for NZDUSD.
Time Frame: 1D
Current Trend: Bullish
Sentiment: Oversold (based on 7-period RSI)
Forecast: Bullish
The market is testing a major horizontal structure 0.592.
Taking into consideration the structure & trend analysis, I believe that the market will reach 0.602 level soon.
P.S
Overbought describes a period of time where there has been a significant and consistent upward move in price over a period of time without much pullback.
Disclosure: I am part of Trade Nation's Influencer program and receive a monthly fee for using their TradingView charts in my analysis.
Like and subscribe and comment my ideas if you enjoy them!

USDCAD: Bulls Will Push
Looking at the chart of USDCAD right now we are seeing some interesting price action on the lower timeframes. Thus a local move up seems to be quite likely.
Disclosure: I am part of Trade Nation's Influencer program and receive a monthly fee for using their TradingView charts in my analysis.
❤️ Please, support our work with like & comment! ❤️
