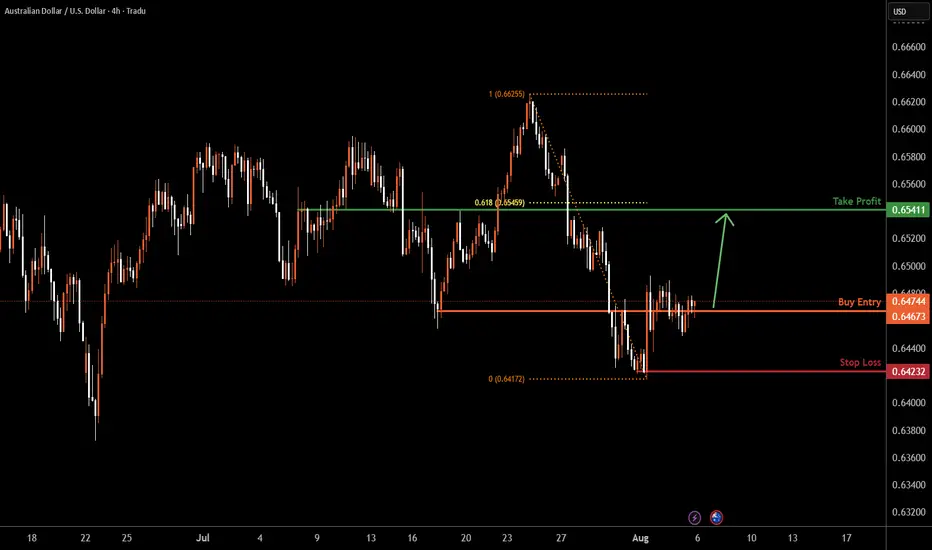
AUDUSD H4 | Could the Aussie reverse from hereAUD/USD is reacting off the buy entry which is a an overlap support and could rise from this level to the upside.
Buy entry is at 0.6472, which is an overlap support.
Stop loss is at 0.6423, which is a swing low support.
Take profit is at 0.6541, which is a pullback resistance that lines up with the 61.8% Fibonacci retracement.
High Risk Investment Warning
Trading Forex/CFDs on margin carries a high level of risk and may not be suitable for all investors. Leverage can work against you.
Stratos Markets Limited (tradu.com ):
CFDs are complex instruments and come with a high risk of losing money rapidly due to leverage. 65% of retail investor accounts lose money when trading CFDs with this provider. You should consider whether you understand how CFDs work and whether you can afford to take the high risk of losing your money.
Stratos Europe Ltd (tradu.com ):
CFDs are complex instruments and come with a high risk of losing money rapidly due to leverage. 66% of retail investor accounts lose money when trading CFDs with this provider. You should consider whether you understand how CFDs work and whether you can afford to take the high risk of losing your money.
Stratos Global LLC (tradu.com ):
Losses can exceed deposits.
Please be advised that the information presented on TradingView is provided to Tradu (‘Company’, ‘we’) by a third-party provider (‘TFA Global Pte Ltd’). Please be reminded that you are solely responsible for the trading decisions on your account. There is a very high degree of risk involved in trading. Any information and/or content is intended entirely for research, educational and informational purposes only and does not constitute investment or consultation advice or investment strategy. The information is not tailored to the investment needs of any specific person and therefore does not involve a consideration of any of the investment objectives, financial situation or needs of any viewer that may receive it. Kindly also note that past performance is not a reliable indicator of future results. Actual results may differ materially from those anticipated in forward-looking or past performance statements. We assume no liability as to the accuracy or completeness of any of the information and/or content provided herein and the Company cannot be held responsible for any omission, mistake nor for any loss or damage including without limitation to any loss of profit which may arise from reliance on any information supplied by TFA Global Pte Ltd.
The speaker(s) is neither an employee, agent nor representative of Tradu and is therefore acting independently. The opinions given are their own, constitute general market commentary, and do not constitute the opinion or advice of Tradu or any form of personal or investment advice. Tradu neither endorses nor guarantees offerings of third-party speakers, nor is Tradu responsible for the content, veracity or opinions of third-party speakers, presenters or participants.
Forex
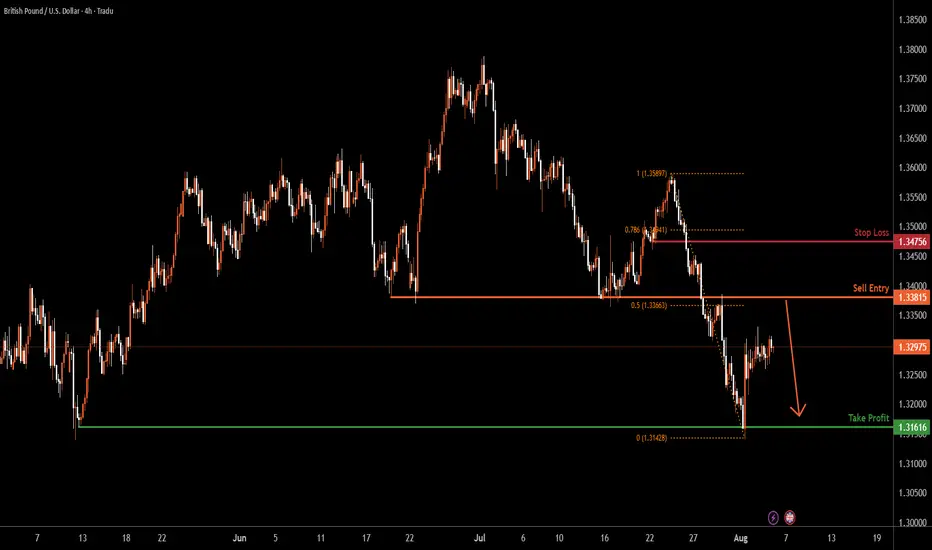
GBPUSD H4 | Bearish reversal off pullback resistanceThe Cable (GBP/USD) is rising towards the sell entry at 1.3381, which acts as a pullback resistance and could drop to the downside.
Stop loss is at 1.3475, which is a pullback resistance that is slightly below the 78.6% Fibonacci retracement.
Take profit is at 1.3161, which is a multi-swing low support.
High Risk Investment Warning
Trading Forex/CFDs on margin carries a high level of risk and may not be suitable for all investors. Leverage can work against you.
Stratos Markets Limited (tradu.com ):
CFDs are complex instruments and come with a high risk of losing money rapidly due to leverage. 65% of retail investor accounts lose money when trading CFDs with this provider. You should consider whether you understand how CFDs work and whether you can afford to take the high risk of losing your money.
Stratos Europe Ltd (tradu.com ):
CFDs are complex instruments and come with a high risk of losing money rapidly due to leverage. 66% of retail investor accounts lose money when trading CFDs with this provider. You should consider whether you understand how CFDs work and whether you can afford to take the high risk of losing your money.
Stratos Global LLC (tradu.com ):
Losses can exceed deposits.
Please be advised that the information presented on TradingView is provided to Tradu (‘Company’, ‘we’) by a third-party provider (‘TFA Global Pte Ltd’). Please be reminded that you are solely responsible for the trading decisions on your account. There is a very high degree of risk involved in trading. Any information and/or content is intended entirely for research, educational and informational purposes only and does not constitute investment or consultation advice or investment strategy. The information is not tailored to the investment needs of any specific person and therefore does not involve a consideration of any of the investment objectives, financial situation or needs of any viewer that may receive it. Kindly also note that past performance is not a reliable indicator of future results. Actual results may differ materially from those anticipated in forward-looking or past performance statements. We assume no liability as to the accuracy or completeness of any of the information and/or content provided herein and the Company cannot be held responsible for any omission, mistake nor for any loss or damage including without limitation to any loss of profit which may arise from reliance on any information supplied by TFA Global Pte Ltd.
The speaker(s) is neither an employee, agent nor representative of Tradu and is therefore acting independently. The opinions given are their own, constitute general market commentary, and do not constitute the opinion or advice of Tradu or any form of personal or investment advice. Tradu neither endorses nor guarantees offerings of third-party speakers, nor is Tradu responsible for the content, veracity or opinions of third-party speakers, presenters or participants.
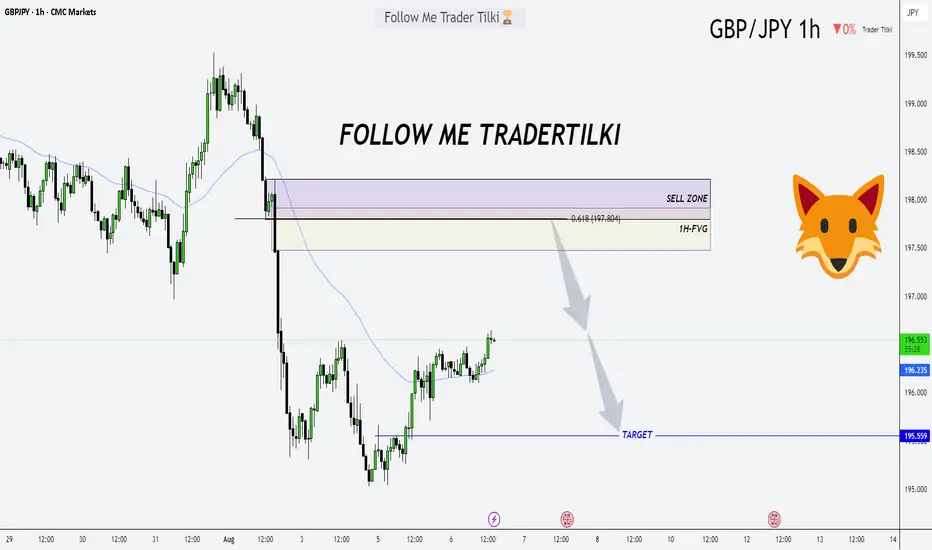
GBPJPY Sell Setup from Two Key Levels!Hey friends 👋
Here’s my carefully prepared GBPJPY analysis, just for you 📊
In this setup, I’ll be opening sell positions from two key levels:
1️⃣ 197.477
2️⃣ 198.100
My target level is: 🎯 195.560
Every single like you give truly fuels my motivation to keep sharing these insights.
Huge thanks to everyone who supports and encourages me with their likes 🙏
GBPNZD: Another Bullish Wave Coming 🇬🇧🇳🇿
GBPNZD respected a strong rising trend line on a daily.
The price formed a cup & handle pattern on that
and violated its horizontal neckline yesterday.
I think that another up movement is ahead.
Goal - 2.26
❤️Please, support my work with like, thank you!❤️

EURCAD Buyers In Panic! SELL!
My dear subscribers,
This is my opinion on the EURCAD next move:
The instrument tests an important psychological level 1.5952
Bias - Bearish
Technical Indicators: Supper Trend gives a precise Bearish signal, while Pivot Point HL predicts price changes and potential reversals in the market.
Target - 1.5888
About Used Indicators:
On the subsequent day, trading above the pivot point is thought to indicate ongoing bullish sentiment, while trading below the pivot point indicates bearish sentiment.
Disclosure: I am part of Trade Nation's Influencer program and receive a monthly fee for using their TradingView charts in my analysis.
———————————
WISH YOU ALL LUCK

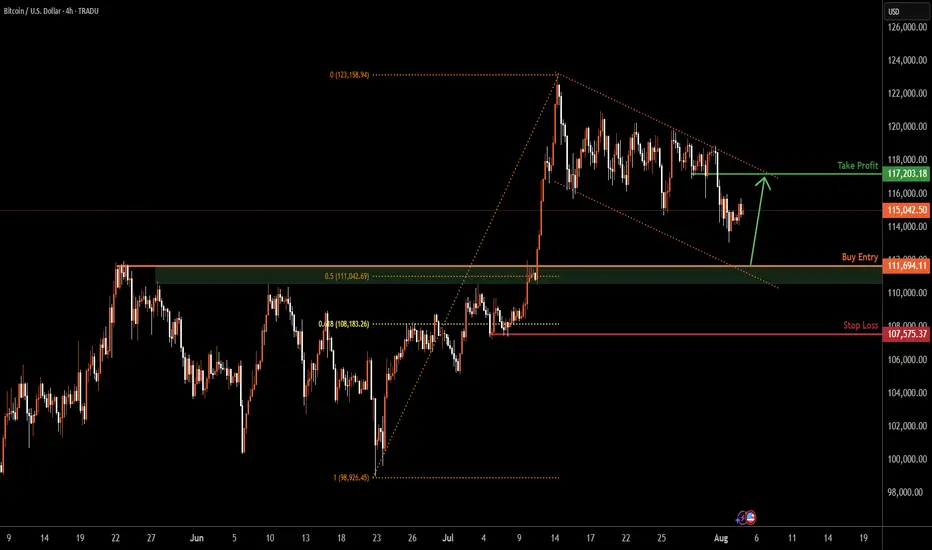
BITCOIN H4 | Bullish bounce offBTC/USD is falling towards the buy entry, which is a pullback support that is slightly above the 50% Fibonacci retracement and could bounce from this level to our take profit.
Buy entry is at 111,694.11, which is a pullback support that is slightly above the 50% Fibonacci retracement.
Stop loss is at 107,575.37, which is a pullback support that is slightly below the 61.8% Fibonacci retracement.
Take profit is at 117,203.18, which is a pullback resistance.
High Risk Investment Warning
Trading Forex/CFDs on margin carries a high level of risk and may not be suitable for all investors. Leverage can work against you.
Stratos Markets Limited (tradu.com ):
CFDs are complex instruments and come with a high risk of losing money rapidly due to leverage. 65% of retail investor accounts lose money when trading CFDs with this provider. You should consider whether you understand how CFDs work and whether you can afford to take the high risk of losing your money.
Stratos Europe Ltd (tradu.com ):
CFDs are complex instruments and come with a high risk of losing money rapidly due to leverage. 66% of retail investor accounts lose money when trading CFDs with this provider. You should consider whether you understand how CFDs work and whether you can afford to take the high risk of losing your money.
Stratos Global LLC (tradu.com ):
Losses can exceed deposits.
Please be advised that the information presented on TradingView is provided to Tradu (‘Company’, ‘we’) by a third-party provider (‘TFA Global Pte Ltd’). Please be reminded that you are solely responsible for the trading decisions on your account. There is a very high degree of risk involved in trading. Any information and/or content is intended entirely for research, educational and informational purposes only and does not constitute investment or consultation advice or investment strategy. The information is not tailored to the investment needs of any specific person and therefore does not involve a consideration of any of the investment objectives, financial situation or needs of any viewer that may receive it. Kindly also note that past performance is not a reliable indicator of future results. Actual results may differ materially from those anticipated in forward-looking or past performance statements. We assume no liability as to the accuracy or completeness of any of the information and/or content provided herein and the Company cannot be held responsible for any omission, mistake nor for any loss or damage including without limitation to any loss of profit which may arise from reliance on any information supplied by TFA Global Pte Ltd.
The speaker(s) is neither an employee, agent nor representative of Tradu and is therefore acting independently. The opinions given are their own, constitute general market commentary, and do not constitute the opinion or advice of Tradu or any form of personal or investment advice. Tradu neither endorses nor guarantees offerings of third-party speakers, nor is Tradu responsible for the content, veracity or opinions of third-party speakers, presenters or participants.
Market Analysis: EUR/GBP Loses MomentumMarket Analysis: EUR/GBP Loses Momentum
EUR/GBP is consolidating and might aim for a fresh increase above 0.8700.
Important Takeaways for EUR/GBP Analysis Today
- EUR/GBP is trading in a positive zone above the 0.8665 pivot level.
- There is a short-term declining channel forming with resistance near 0.8705 on the hourly chart.
EUR/GBP Technical Analysis
On the hourly chart of EUR/GBP, the pair started a consolidation phase after it failed to surpass 0.8730. The Euro traded below the 0.8710 and 0.8700 support levels against the British Pound.
The EUR/GBP chart suggests that the pair even declined below the 23.6% Fib retracement level of the upward move from the 0.8605 swing low to the 0.8729 high. It is now consolidating losses and trading below the 50-hour simple moving average.
The pair is now facing resistance near the 0.8705 level. There is also a short-term declining channel forming with resistance near 0.8705.
The next major resistance could be 0.8730. The main resistance is near the 0.8750 zone. A close above the 0.8750 level might accelerate gains. In the stated case, the bulls may perhaps aim for a test of 0.8780. Any more gains might send the pair toward the 0.8800 level.
Immediate support sits near 0.8680. The next major support is near 0.8665 or the 50% Fib retracement level of the upward move from the 0.8605 swing low to the 0.8729 high.
A downside break below 0.8665 might call for more downsides. In the stated case, the pair could drop toward 0.8635.
This article represents the opinion of the Companies operating under the FXOpen brand only. It is not to be construed as an offer, solicitation, or recommendation with respect to products and services provided by the Companies operating under the FXOpen brand, nor is it to be considered financial advice.

Market Analysis: GBP/USD Rebounds CautiouslyMarket Analysis: GBP/USD Rebounds Cautiously
GBP/USD is attempting a recovery wave above the 1.3215 resistance.
Important Takeaways for GBP/USD Analysis Today
- The British Pound is attempting a fresh increase above 1.3265.
- There is a contracting triangle forming with resistance at 1.3375 on the hourly chart of GBP/USD.
GBP/USD Technical Analysis
On the hourly chart of GBP/USD, the pair declined after it failed to clear the 1.3600 resistance. As mentioned in the previous analysis, the British Pound even traded below the 1.3350 support against the US Dollar.
Finally, the pair tested the 1.3140 zone and is currently attempting a fresh increase. The bulls were able to push the pair above the 50-hour simple moving average and 1.3215. The pair even climbed above the 1.3265 level.
The bulls were able to push the pair above the 50% Fib retracement level of the downward move from the 1.3385 swing high to the 1.3141 low.
On the upside, the GBP/USD chart indicates that the pair is facing resistance near 1.3375. There is also a contracting triangle forming with resistance at 1.3375 and the 76.4% Fib retracement level of the downward move from the 1.3385 swing high to the 1.3141 low.
The next major resistance is near 1.3385. A close above the 1.3385 resistance zone could open the doors for a move toward 1.3450. Any more gains might send GBP/USD toward 1.3550.
On the downside, there is decent support forming at 1.3265. If there is a downside break below 1.3265, the pair could accelerate lower. The first major support is near the 1.3215 level. The next key support is seen near 1.3140, below which the pair could test 1.3050. Any more losses could lead the pair toward 1.3000.
This article represents the opinion of the Companies operating under the FXOpen brand only. It is not to be construed as an offer, solicitation, or recommendation with respect to products and services provided by the Companies operating under the FXOpen brand, nor is it to be considered financial advice.

GBPUSD SELLGBP/USD holds steady above 1.3250 as investors brace for US ISM Services PMI release
The GBP/USD pair trades on a flat note near 1.3280 during the Asian trading hours on Tuesday. Nonetheless, rising odds of Federal Reserve rate cuts could weigh on the US Dollar against the Cable. Investors will keep an eye on the US ISM Services Purchasing Managers Index data, which is due later on Tuesday.
The broad-based selling pressure surrounding the US Dollar (USD) helped GBP/USD gain traction and allowed the pair to snap a six-day losing streak.
The monthly data published by the US Bureau of Labor Statistics (BLS) showed that Nonfarm Payrolls (NFP) rose by 73,000 in July, missing analysts' estimate of 110,000, while the Unemployment Rate edged higher to 4.2% from 4.1%, as expected. More importantly, the BLS announced that it revised down May and June NFP increases, noting that NFP growth in this two-month period combined was 258,000 lower than previously reported.
The probability of a 25 basis points Federal Reserve (Fed) rate cut in September jumped above 70% from about 30% before the data, as per CME FedWatch Tool. In turn, the USD weakened sharply against its peers.
The economic calendar will not feature any high-tier macroeconomic data releases on Monday. Later in the week, the Bank of England (BoE) will announce monetary policy decisions.
In the meantime, market participants will keep a close eye on US politics. Following the dismal employment report, US President Donald Trump fired BLS Chief Erika McEntarfer, accusing her of manipulating the numbers for political purposes. Additionally, Fed Governor Adriana Kugler, whose term was scheduled to end on January 31, 2026, announced her resignation.
Investors could opt to stay away from the USD in case political developments feed into concerns over the Fed or the BLS losing independence.
SUPPORT 1.32382
SUPPORT 1.31758
SUPPORT 1.32382
RESISTANCE 1.33086
RESISTANCE 1.33375

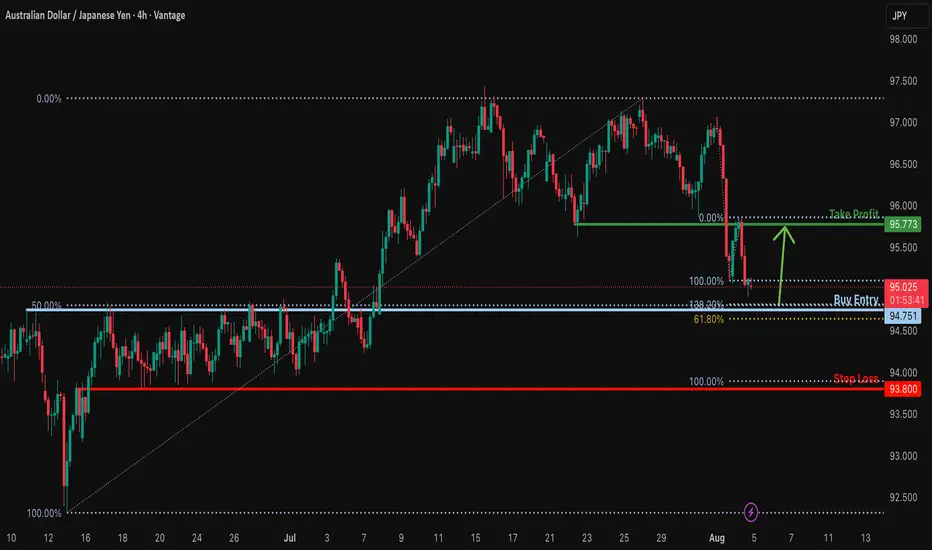
Bullish reversal off Fibonacci confluence?AUD/JPY is falling towards a support level, which is a pullback support aligning with the 138.2% Fibonacci extension, the 50% Fibonacci retracement, and the 61.8% Fibonacci projection. A bounce from this level could push the price toward our take-profit target.
Entry: 94.75
Why we like it:
There is a pullback support level that aligns with the 50% Fibonacci retracement, the 138.2% Fibonacci extension and the 61.8% Fibonacci projection.
Stop loss: 93.80
Why we like it:
There is a pullback support that lines up witht he 100% Fibonacci projection.
Takeprofit: 95.77
Why we like it:
There is an overlap resistance.
Enjoying your TradingView experience? Review us!
Please be advised that the information presented on TradingView is provided to Vantage (‘Vantage Global Limited’, ‘we’) by a third-party provider (‘Everest Fortune Group’). Please be reminded that you are solely responsible for the trading decisions on your account. There is a very high degree of risk involved in trading. Any information and/or content is intended entirely for research, educational and informational purposes only and does not constitute investment or consultation advice or investment strategy. The information is not tailored to the investment needs of any specific person and therefore does not involve a consideration of any of the investment objectives, financial situation or needs of any viewer that may receive it. Kindly also note that past performance is not a reliable indicator of future results. Actual results may differ materially from those anticipated in forward-looking or past performance statements. We assume no liability as to the accuracy or completeness of any of the information and/or content provided herein and the Company cannot be held responsible for any omission, mistake nor for any loss or damage including without limitation to any loss of profit which may arise from reliance on any information supplied by Everest Fortune Group.
CHFJPY: Pullback Confirmed?! 🇨🇭🇯🇵
CHFJPY may pull back from a key daily support.
A formation of a bullish imbalance candle on an hourly time frame
with a bullish CHoCH provide a reliable confirmation.
Goal - 182.45
❤️Please, support my work with like, thank you!❤️
I am part of Trade Nation's Influencer program and receive a monthly fee for using their TradingView charts in my analysis.

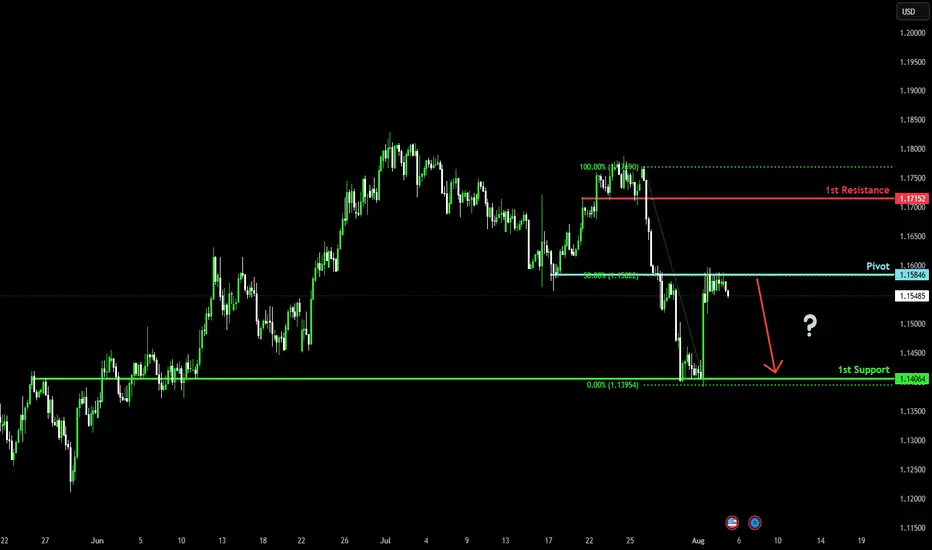
Bearish drop off pullback resistance?The price has rejected off the pivot, which has been identified as a pullback resistance that lines up with the 50% Fibonacci retracement and could drop to the 1st support.
Pivot: 1.1584
1st Support: 1.1406
1st Resistance: 1.1715
Risk Warning:
Trading Forex and CFDs carries a high level of risk to your capital and you should only trade with money you can afford to lose. Trading Forex and CFDs may not be suitable for all investors, so please ensure that you fully understand the risks involved and seek independent advice if necessary.
Disclaimer:
The above opinions given constitute general market commentary, and do not constitute the opinion or advice of IC Markets or any form of personal or investment advice.
Any opinions, news, research, analyses, prices, other information, or links to third-party sites contained on this website are provided on an "as-is" basis, are intended only to be informative, is not an advice nor a recommendation, nor research, or a record of our trading prices, or an offer of, or solicitation for a transaction in any financial instrument and thus should not be treated as such. The information provided does not involve any specific investment objectives, financial situation and needs of any specific person who may receive it. Please be aware, that past performance is not a reliable indicator of future performance and/or results. Past Performance or Forward-looking scenarios based upon the reasonable beliefs of the third-party provider are not a guarantee of future performance. Actual results may differ materially from those anticipated in forward-looking or past performance statements. IC Markets makes no representation or warranty and assumes no liability as to the accuracy or completeness of the information provided, nor any loss arising from any investment based on a recommendation, forecast or any information supplied by any third-party.
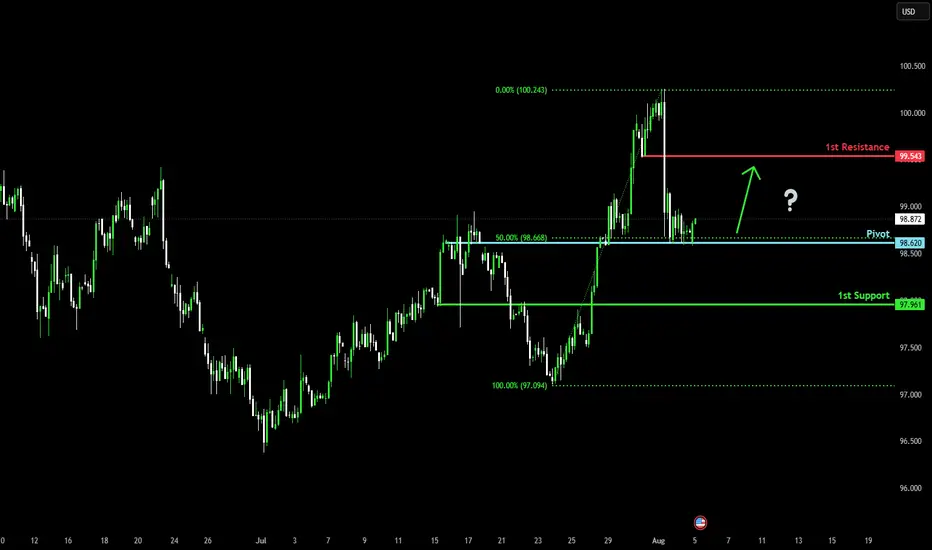
Bullish bounce off 50% Fibonacci support?US Dollar Index (DXY) is reacting off the pivot, which acts as a pullback support and could bounce to the 1st resistance.
Pivot: 98.62
1st Support: 97.96
1st Resistance: 99.54
Risk Warning:
Trading Forex and CFDs carries a high level of risk to your capital and you should only trade with money you can afford to lose. Trading Forex and CFDs may not be suitable for all investors, so please ensure that you fully understand the risks involved and seek independent advice if necessary.
Disclaimer:
The above opinions given constitute general market commentary, and do not constitute the opinion or advice of IC Markets or any form of personal or investment advice.
Any opinions, news, research, analyses, prices, other information, or links to third-party sites contained on this website are provided on an "as-is" basis, are intended only to be informative, is not an advice nor a recommendation, nor research, or a record of our trading prices, or an offer of, or solicitation for a transaction in any financial instrument and thus should not be treated as such. The information provided does not involve any specific investment objectives, financial situation and needs of any specific person who may receive it. Please be aware, that past performance is not a reliable indicator of future performance and/or results. Past Performance or Forward-looking scenarios based upon the reasonable beliefs of the third-party provider are not a guarantee of future performance. Actual results may differ materially from those anticipated in forward-looking or past performance statements. IC Markets makes no representation or warranty and assumes no liability as to the accuracy or completeness of the information provided, nor any loss arising from any investment based on a recommendation, forecast or any information supplied by any third-party.
GBP_NZD BULLISH BREAKOUT|LONG|
✅GBP_NZD broke the key structure level of 2.2500
While trading in an local downtrend
Which makes me bearish
And I think that after the retest of the broken level is complete
A rebound and bearish continuation will follow
SHORT🔥
✅Like and subscribe to never miss a new idea!✅

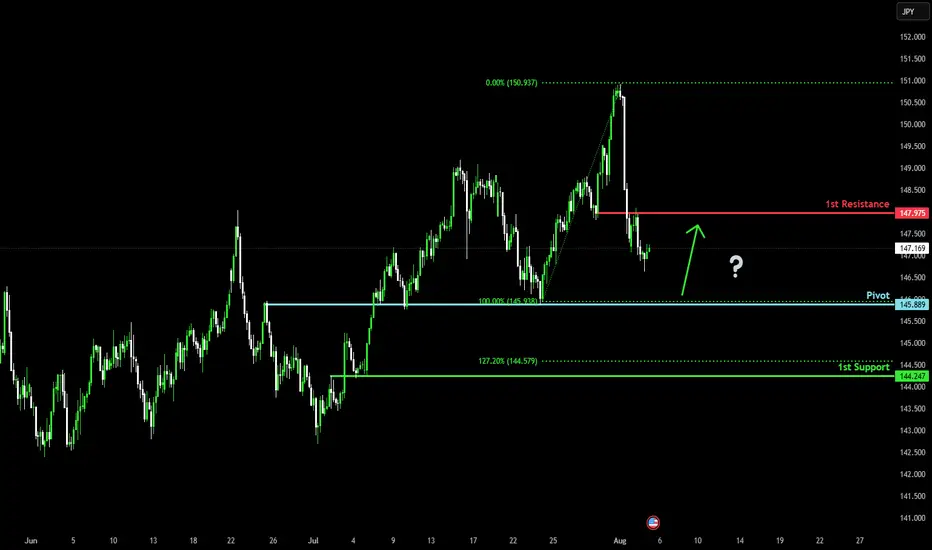
Falling towards major support?USD/JPY is falling towards the pivot, which has been identified as an overlap support and could bounce to the 1st resistance.
Pivot: 145.88
1st Support: 144.24
1st Resistance: 147.97
Risk Warning:
Trading Forex and CFDs carries a high level of risk to your capital and you should only trade with money you can afford to lose. Trading Forex and CFDs may not be suitable for all investors, so please ensure that you fully understand the risks involved and seek independent advice if necessary.
Disclaimer:
The above opinions given constitute general market commentary, and do not constitute the opinion or advice of IC Markets or any form of personal or investment advice.
Any opinions, news, research, analyses, prices, other information, or links to third-party sites contained on this website are provided on an "as-is" basis, are intended only to be informative, is not an advice nor a recommendation, nor research, or a record of our trading prices, or an offer of, or solicitation for a transaction in any financial instrument and thus should not be treated as such. The information provided does not involve any specific investment objectives, financial situation and needs of any specific person who may receive it. Please be aware, that past performance is not a reliable indicator of future performance and/or results. Past Performance or Forward-looking scenarios based upon the reasonable beliefs of the third-party provider are not a guarantee of future performance. Actual results may differ materially from those anticipated in forward-looking or past performance statements. IC Markets makes no representation or warranty and assumes no liability as to the accuracy or completeness of the information provided, nor any loss arising from any investment based on a recommendation, forecast or any information supplied by any third-party.
CAD/JPY BULLS ARE STRONG HERE|LONG
Hello, Friends!
We are now examining the CAD/JPY pair and we can see that the pair is going down locally while also being in a downtrend on the 1W TF. But there is also a powerful signal from the BB lower band being nearby indicating that the pair is oversold so we can go long from the support line below and a target at 108.573 level.
Disclosure: I am part of Trade Nation's Influencer program and receive a monthly fee for using their TradingView charts in my analysis.
✅LIKE AND COMMENT MY IDEAS✅

Heading into pullback resistance?The Cable (GBP/USD) is rising towards the pivot, which acts as a pullback resistance and could reverse to the 1st support.
Pivot: 1.3386
1st Support: 1.3104
1st Resistance: 1.3591
Risk Warning:
Trading Forex and CFDs carries a high level of risk to your capital and you should only trade with money you can afford to lose. Trading Forex and CFDs may not be suitable for all investors, so please ensure that you fully understand the risks involved and seek independent advice if necessary.
Disclaimer:
The above opinions given constitute general market commentary, and do not constitute the opinion or advice of IC Markets or any form of personal or investment advice.
Any opinions, news, research, analyses, prices, other information, or links to third-party sites contained on this website are provided on an "as-is" basis, are intended only to be informative, is not an advice nor a recommendation, nor research, or a record of our trading prices, or an offer of, or solicitation for a transaction in any financial instrument and thus should not be treated as such. The information provided does not involve any specific investment objectives, financial situation and needs of any specific person who may receive it. Please be aware, that past performance is not a reliable indicator of future performance and/or results. Past Performance or Forward-looking scenarios based upon the reasonable beliefs of the third-party provider are not a guarantee of future performance. Actual results may differ materially from those anticipated in forward-looking or past performance statements. IC Markets makes no representation or warranty and assumes no liability as to the accuracy or completeness of the information provided, nor any loss arising from any investment based on a recommendation, forecast or any information supplied by any third-party.

EURCAD What Next? BUY!
My dear friends,
My technical analysis for EURCAD is below:
The market is trading on 1.5784 pivot level.
Bias - Bullish
Technical Indicators: Both Super Trend & Pivot HL indicate a highly probable Bullish continuation.
Target - 1.5907
About Used Indicators:
A pivot point is a technical analysis indicator, or calculations, used to determine the overall trend of the market over different time frames.
Disclosure: I am part of Trade Nation's Influencer program and receive a monthly fee for using their TradingView charts in my analysis.
———————————
WISH YOU ALL LUCK

AUDUSD BUY
AUD/USD rises to near 0.6480 as accelerating Fed dovish bets weigh on US Dollar
The AUD/USD pair moves higher to near 0.6480 during the European trading session on Monday. The Aussie pair gains as demand for risk-perceived assets has increased, following an increase in market expectations that the Fed could resume its monetary expansion cycle in the September meeting
The AUD/USD currency pair, commonly known as the “Aussie”, represents how many US dollars (the quote currency) are needed to purchase one Australian dollar (the base currency). Alongside the New Zealand Dollar (NZD) and the Canadian Dollar (CAD), the AUD is considered a commodity currency due to Australia’s significant exports of raw materials such as precious metals, Oil, and agricultural products.
The Reserve Bank of Australia (RBA) has historically maintained higher interest rates compared to other industrialized nations. Combined with the relatively high liquidity of the AUD, this has made the AUD attractive for carry traders looking for higher yields.
SUPPORT 0.64852
SUPPORT 0.65074
SUPPORT 0.65285
RESISTANCE 0.64498

GOLD down slightly, watch today's data, technical conditionsOANDA:XAUUSD edged lower in Asian trading on Tuesday (August 5), currently trading around $3,380/ounce. On Tuesday, the US ISM services PMI will be released, which is the most important economic data of the week and is expected to impact the gold market.
OANDA:XAUUSD prices surged after weak jobs data increased the possibility of the Federal Reserve cutting interest rates.
Data released last Friday showed that the number of new jobs in the US non-farm sector in July was much lower than expected, and the total number of non-farm jobs in the first two months was revised down by 258,000, indicating a sharp deterioration in the labor market.
Traders now see an 87% chance of a rate cut in September, up from 63% last week, according to CME Group's FedWatch tool. Expectations of a rate cut have boosted gold prices, as the dollar provides support for the precious metal.
The US ISM non-manufacturing purchasing managers index (PMI) for July will be released today (Tuesday) and is expected to be 51.5, up from 50.8 previously.
The July ISM services PMI could impact the US dollar and gold, depending on whether it is biased towards supporting a rate cut or pausing rate cuts for an extended period.
Gold itself does not generate interest, but generally performs well in low-interest-rate environments and is seen as an inflation hedge.
On the trade front
Today (August 5), US President Donald Trump threatened to raise tariffs on Indian goods in protest at India's purchase of Russian oil. New Delhi called Trump's attack "absurd" and pledged to protect its economic interests, deepening the trade rift between the two countries.
Trump posted on the social media platform Truth Social: "India not only buys massive amounts of Russian oil, but also sells much of it on the open market at a huge profit. They don't care how many people are being killed in Ukraine by the Russian war machine."
Trump added: "Accordingly, I will be substantially increasing the tariffs that India pays to the United States."
However, Trump did not specify the specific tariff amount.
Responding to Trump's remarks, an Indian foreign ministry spokesperson said on Monday that India would "take all necessary measures to protect its national interests and economic security." The spokesperson added: "These actions against India are unjustified and unjustifiable."
Over the weekend, Reuters reported that India would continue to buy oil from Russia despite Trump’s threats.
In July, Trump announced that he would impose a 25% tariff on imports from India, and US officials have also pointed to a range of geopolitical issues as holding up the signing of a US-India trade deal.
Trump has also described the BRICS group as generally hostile to the US. Those countries have rejected Trump’s accusations, saying the group protects the interests of its members and the developing world as a whole.
Technical Outlook Analysis OANDA:XAUUSD
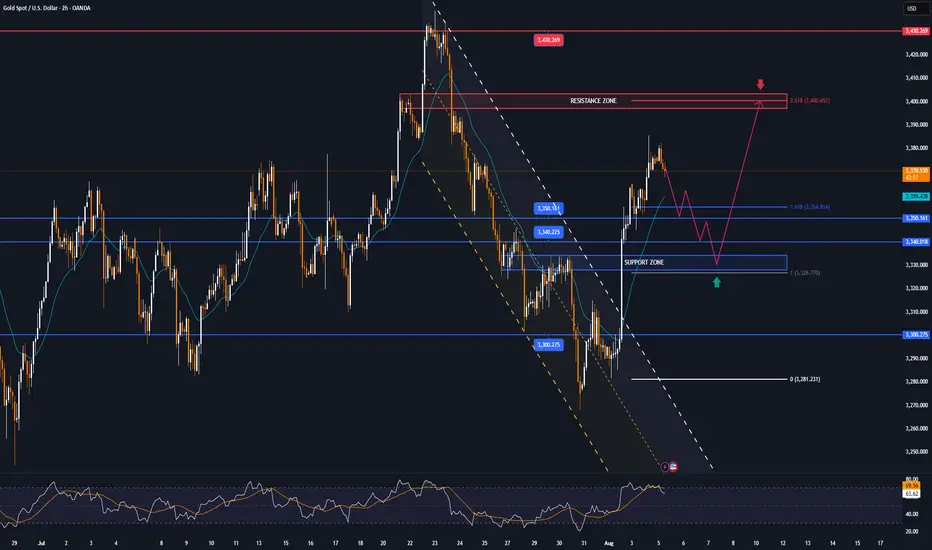
On the daily chart, although gold has been very volatile in recent times, it is still moving sideways, with price action clinging to the EMA21. And after a strong recovery in the past three trading sessions, gold is temporarily limited by the 0.236% Fibonacci retracement level, which was the bullish target that readers paid attention to earlier. The return above the EMA21 provides gold with initial conditions for bullish expectations, but a new trend has not yet formed.
If gold takes its price action above the 0.236% Fibonacci retracement level and stabilizes above it, it will have room to continue rising with the next target being the raw price point of $3,400 rather than the $3,430-$3,450 target. But at its current position, it still has no clear trend either up or down.
Meanwhile, once gold sells below the 0.382% Fibonacci retracement level, it could continue to decline with a target of $3,246 in the short term, which also means that the $3,300 – $3,292 area is the current key support area.
Momentum-wise, the Relative Strength Index (RSI) is also hovering around 50 with little fluctuation, indicating a hesitant sentiment in the market without leaning to either side.
For the day, the technical outlook for gold is a sideways consolidation but the technical conditions are slightly more bullish, and the notable positions are listed as follows.
Support: $3,350 – $3,340 – $3,300
Resistance: $3,400 – $3,430
SELL XAUUSD PRICE 3402 - 3400⚡️
↠↠ Stop Loss 3406
→Take Profit 1 3394
↨
→Take Profit 2 3388
BUY XAUUSD PRICE 3329 - 3331⚡️
↠↠ Stop Loss 3325
→Take Profit 1 3337
↨
→Take Profit 2 3343
USDCHF Is Very Bearish! Short!
Take a look at our analysis for USDCHF.
Time Frame: 1h
Current Trend: Bearish
Sentiment: Overbought (based on 7-period RSI)
Forecast: Bearish
The price is testing a key resistance 0.808.
Taking into consideration the current market trend & overbought RSI, chances will be high to see a bearish movement to the downside at least to 0.804 level.
P.S
Overbought describes a period of time where there has been a significant and consistent upward move in price over a period of time without much pullback.
Disclosure: I am part of Trade Nation's Influencer program and receive a monthly fee for using their TradingView charts in my analysis.
Like and subscribe and comment my ideas if you enjoy them!

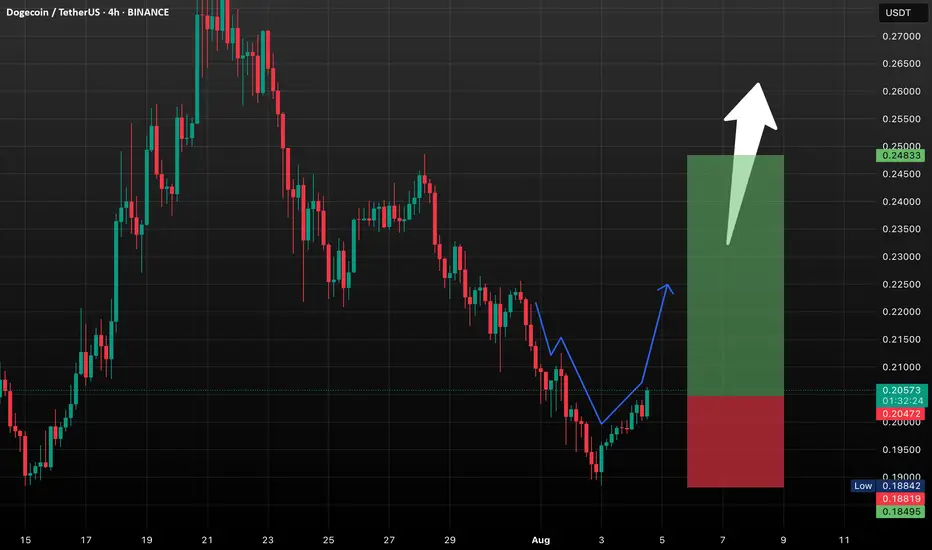
DOGE Setup Heating Up: These Levels Could Define the Next Move!Prediction for the Period Ahead (Next 1–2 Weeks):
*Base case: Holding support at $0.198–$0.200 → test $0.215.
*Bull trigger: Break above $0.215 with volume → possible move to $0.232 and higher.
*Downside risk: Falling below $0.182 could drag the price to $0.175 before any recovery.
DOGE is currently consolidating in a tight range with a neutral to slightly bearish technical bias. However, a breakout above $0.215, particularly supported by volume, could set the stage for further gains targeting $0.232–$0.287 zone. Conversely, a downturn past $0.182 opens the risk of a deeper test toward $0.175. In either scenario, the upcoming weeks seem pivotal...
GBPUSD Will Go Higher From Support! Long!
Take a look at our analysis for GBPUSD.
Time Frame: 1h
Current Trend: Bullish
Sentiment: Oversold (based on 7-period RSI)
Forecast: Bullish
The market is approaching a key horizontal level 1.328.
Considering the today's price action, probabilities will be high to see a movement to 1.336.
P.S
We determine oversold/overbought condition with RSI indicator.
When it drops below 30 - the market is considered to be oversold.
When it bounces above 70 - the market is considered to be overbought.
Disclosure: I am part of Trade Nation's Influencer program and receive a monthly fee for using their TradingView charts in my analysis.
Like and subscribe and comment my ideas if you enjoy them!
