MarketBreakdown | EURCHF, WTI CRUDE OIL, GBPNZD, DXY
Here are the updates & outlook for multiple instruments in my watch list.
1️⃣ #EURCHF daily time frame 🇪🇺🇨🇭
The market is testing a strong supply area
based on a solid falling trend line and a horizontal resistance.
Probabilities will be high that the price will retrace from that.
2️⃣ CRUDE OIL #WTI daily time frame 🛢️
The price is very close to a significant demand zone
based on a horizontal support cluster and a rising trend line.
I will expect a bullish reaction to that.
3️⃣ #GBPJPY daily time frame 🇬🇧🇳🇿
The market is trading within a contracting triangle.
The price nicely respected its support line and goes up steadily.
I think that bullish momentum will remain strong and the market
will go up to the resistance line of a triangle.
4️⃣ DOLLAR INDEX #DXY daily time frame 💵
The market is consolidating on a key daily support cluster.
Probabilities will be high that the price will bounce from that.
Today's fundamental news can be a trigger.
Do you agree with my market breakdown?
❤️Please, support my work with like, thank you!❤️
I am part of Trade Nation's Influencer program and receive a monthly fee for using their TradingView charts in my analysis.
Forex

EURUSD – Bearish pullback in play ? EURUSD has broken the ascending trendline and dropped below the EMA confluence, confirming a bearish structure. The current rebound is testing the 0.5–0.618 Fibonacci zone, but weak buying pressure and rejection candles suggest it’s likely just a technical pullback.
If momentum holds, the pair may resume its downtrend toward 1.1400 and potentially 1.1296. The bears remain in control unless strong fundamentals shift the balance.

USD/JPY Bearish Setup - Breakout from Ascending ChannelUSD/JPY Bearish Setup – Breakout from Ascending Channel
Price action on USD/JPY has broken down from an ascending channel, signaling potential bearish momentum ahead. The breakdown suggests a possible continuation toward lower support levels.
1st Support Level: 144.800 – 144.200
2nd Support Level: 143.000 – 142.400
Watch for price consolidation or retests at the 1st support level. A clean break below this zone could open the path toward the 2nd support level.
Key Notes:
Bearish volume increase post-breakout
Ichimoku cloud starting to thin, showing weakening bullish momentum
Structure favors selling rallies below the channel
📉 Bias: Bearish
💡 Plan: Wait for confirmation on lower timeframes before entering short positions

180 Pips Secured on GOLD! | Sniper Strategy in Action📈 Tired of Gold Trades Going Against You? This Sniper Strategy Just Bagged +180 Pips!
Hello Traders,
Struggling with XAUUSD’s volatility?
Taking small wins but suffering big losses?
You’re not alone — and we’ve built something just for you.
🔥 Introducing GOLD SNIPER — a high-probability strategy engineered for serious Gold traders.
With a consistent 1:2 risk-reward and precision entry logic, it’s designed to help you ride big moves and avoid common traps in XAUUSD.
🚀 Today’s Live Trade Recap:
Signal 1
🟢 Buy @ 3355.91
🔴 SL @ 3349.91
🟢 TP @ 3367.91
✅ Result: +120 Pips
Signal 2
🟢 Buy @ 3368.32
🔴 SL @ 3362.32
🟢 TP @ 3380.32
❌ Result: -60 Pips
Signal 3
🟢 Buy @ 3373.29
🔴 SL @ 3367.29
🟢 TP @ 3385.29
✅ Result: +120 Pips
📊 Total Profit Today: +180 Pips
✅ What Makes Gold Sniper So Effective?
✔️ Catches real momentum, not noise
✔️ Keeps entries & exits disciplined and mechanical
✔️ Aims for high-reward trades, not scalp scraps
🎯 Want better entries and more consistent wins on XAUUSD?
📩 DM us now to get instant access and start using Gold Sniper on your TradingView chart.
If this helped you, like the idea and drop a comment — let’s grow together!
Happy Trading,
InvestPro India

EURUSD SELLEUR/USD appears offered around 1.1550
After failing to break above the 1.1600 barrier, EUR/USD is currently under renewed selling pressure and is testing the mid-1.1500s again on Monday. The US Dollar, on the other hand, rises slightly across the board as investors absorb Friday's big drop after the US employment data and turn their focus to trade.
The daily chart for the EUR/USD pair shows the pair met buyers just ahead of a bullish 100 Simple Moving Average (SMA) currently at around 1.1370. A flat 20 SMA, in the meantime, provides resistance at around 1.1640, the level to overcome to turn bullish. Finally, technical indicators corrected oversold conditions, but lost their upward strength just below their midlines, suggesting buyers are still on the sidelines.
In the 4-hour chart, the EUR/USD pair is range-bound, although there are no signs of a potential slide. The 20 SMA lost its bearish strength and turned flat in the 1.1480 area, while technical indicators remain directionless well above their midlines. The pair flirted with the 1.1600 level during Asian trading hours, with gains beyond the level turning the risk towards the upside in the near term.
SUPPORT 1.15387
SUPPORT 1.14950
SUPPORT 1.14520
RESISTANCE 1.16032
RESISTANCE 1.15832

GOLD Buyers In Panic! SELL!
My dear friends,
Please, find my technical outlook for GOLD below:
The instrument tests an important psychological level 3309.2
Technical Indicators: Supper Trend gives a precise Bearish signal, while Pivot Point HL predicts price changes and potential reversals in the market.
Target - 3296.9
Recommended Stop Loss - 3316.4
About Used Indicators:
Super-trend indicator is more useful in trending markets where there are clear uptrends and downtrends in price.
Disclosure: I am part of Trade Nation's Influencer program and receive a monthly fee for using their TradingView charts in my analysis.
———————————
WISH YOU ALL LUCK

SILVER Is Going Down! Sell!
Please, check our technical outlook for SILVER.
Time Frame: 1h
Current Trend: Bearish
Sentiment: Overbought (based on 7-period RSI)
Forecast: Bearish
The market is trading around a solid horizontal structure 3,722.4.
The above observations make me that the market will inevitably achieve 3,685.7 level.
P.S
Please, note that an oversold/overbought condition can last for a long time, and therefore being oversold/overbought doesn't mean a price rally will come soon, or at all.
Disclosure: I am part of Trade Nation's Influencer program and receive a monthly fee for using their TradingView charts in my analysis.
Like and subscribe and comment my ideas if you enjoy them!

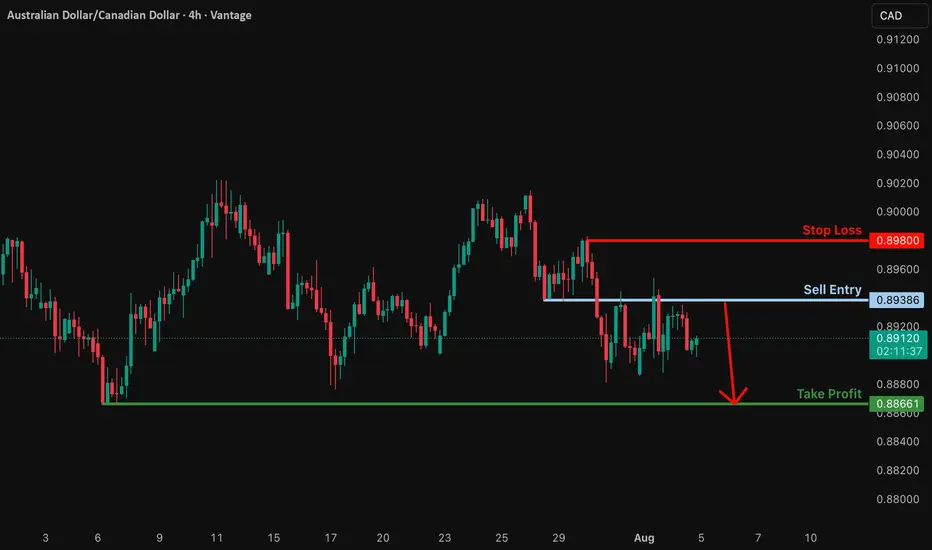
Bearish drop?AUD/CAD has rejected off the resistance level whihc is a pullback resistance and could drop from this level to our take profit.
Entry: 0.89386
Why we like it:
There is a pullback resistance.
Stop loss: 0.89800
Why we like it:
There is a pullback resistance.
Take profit: 0.88661
Why we like it:
There is a swing low support.
Enjoying your TradingView experience? Review us!
Please be advised that the information presented on TradingView is provided to Vantage (‘Vantage Global Limited’, ‘we’) by a third-party provider (‘Everest Fortune Group’). Please be reminded that you are solely responsible for the trading decisions on your account. There is a very high degree of risk involved in trading. Any information and/or content is intended entirely for research, educational and informational purposes only and does not constitute investment or consultation advice or investment strategy. The information is not tailored to the investment needs of any specific person and therefore does not involve a consideration of any of the investment objectives, financial situation or needs of any viewer that may receive it. Kindly also note that past performance is not a reliable indicator of future results. Actual results may differ materially from those anticipated in forward-looking or past performance statements. We assume no liability as to the accuracy or completeness of any of the information and/or content provided herein and the Company cannot be held responsible for any omission, mistake nor for any loss or damage including without limitation to any loss of profit which may arise from reliance on any information supplied by Everest Fortune Group.
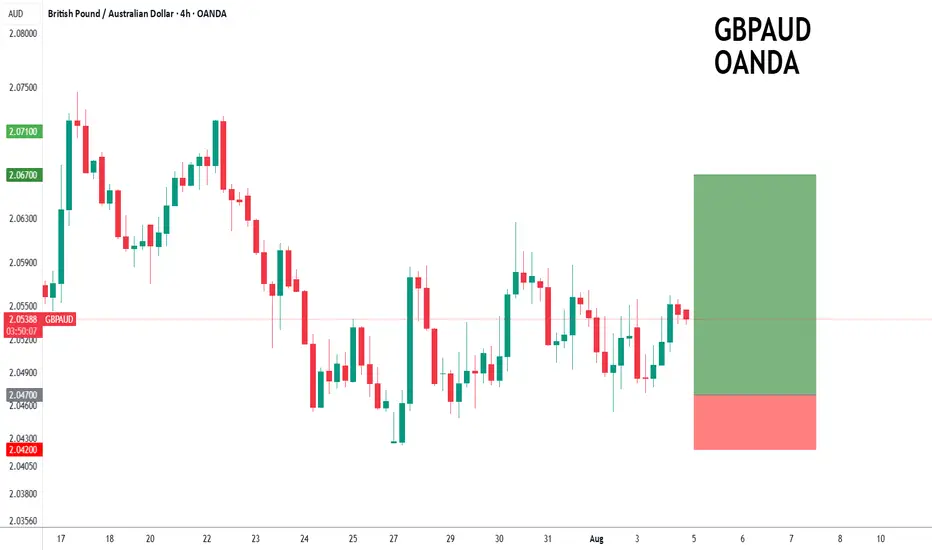
GBPAUD forming a bottom?GBPAUD - 24h expiry
The primary trend remains bullish.
Price action looks to be forming a bottom.
We look for a temporary move lower.
Preferred trade is to buy on dips.
Bespoke support is located at 2.0470.
We look to Buy at 2.0470 (stop at 2.0420)
Our profit targets will be 2.0670 and 2.0700
Resistance: 2.0600 / 2.0670 / 2.0700
Support: 2.0450 / 2.0420 / 2.0390
Risk Disclaimer
The trade ideas beyond this page are for informational purposes only and do not constitute investment advice or a solicitation to trade. This information is provided by Signal Centre, a third-party unaffiliated with OANDA, and is intended for general circulation only. OANDA does not guarantee the accuracy of this information and assumes no responsibilities for the information provided by the third party. The information does not take into account the specific investment objectives, financial situation, or particular needs of any particular person. You should take into account your specific investment objectives, financial situation, and particular needs before making a commitment to trade, including seeking, under a separate engagement, as you deem fit.
You accept that you assume all risks in independently viewing the contents and selecting a chosen strategy.
Where the research is distributed in Singapore to a person who is not an Accredited Investor, Expert Investor or an Institutional Investor, Oanda Asia Pacific Pte Ltd (“OAP“) accepts legal responsibility for the contents of the report to such persons only to the extent required by law. Singapore customers should contact OAP at 6579 8289 for matters arising from, or in connection with, the information/research distributed.
AUDJPY; Heikin Ashi Trade Idea📈 Hey Traders!
Here’s a fresh outlook from my trading desk. If you’ve been following me for a while, you already know my approach:
🧩 I trade Supply & Demand zones using Heikin Ashi chart on the 4H timeframe.
🧠 I keep it mechanical and clean — no messy charts, no guessing games.
❌ No trendlines, no fixed sessions, no patterns, no indicator overload.
❌ No overanalyzing market structure or imbalances.
❌ No scalping, and no need to be glued to the screen.
✅ I trade exclusively with limit orders, so it’s more of a set-and-forget style.
✅ This means more freedom, less screen time, and a focus on quality setups.
✅ Just a simplified, structured plan and a calm mindset.
💬 Let’s Talk:
💡Do you trade supply & demand too ?
💡What’s your go-to timeframe ?
💡Ever tried Heikin Ashi ?
📩 Got questions about my strategy or setup? Drop them below — ask me anything, I’m here to share.
Let’s grow together and keep it simple. 👊

EUR-CHF Resistance Ahead! Sell!
Hello,Traders!
EUR-CHF went up sharply
And the pair is locally
Overbought so after it
Hits the horizontal resistance
Above at 0.9367 we will be
Expecting a local bearish correction
Sell!
Comment and subscribe to help us grow!
Check out other forecasts below too!
Disclosure: I am part of Trade Nation's Influencer program and receive a monthly fee for using their TradingView charts in my analysis.

After data shock, GOLD has bullish conditions againOANDA:XAUUSD rose more than 2% on Friday, hitting a one-week high, as weaker-than-expected U.S. non-farm payrolls data boosted hopes of a Federal Reserve rate cut and the announcement of new tariffs boosted safe-haven demand.
On the economic data front
Gold prices rose more than 2% in U.S. trading on Friday (Aug. 1), hitting a one-week high, as weaker-than-expected U.S. non-farm payrolls data fueled hopes of a Federal Reserve rate cut and safe-haven demand was boosted by the announcement of new tariffs.
The U.S. Department of Labor's Bureau of Labor Statistics reported that nonfarm payrolls increased by just 73,000 jobs in July, well below market expectations of 110,000. June's data was revised down to just 14,000, indicating a significant slowdown in job growth. The unemployment rate rose to 4.2%, indicating a cooling labor market.
The jobs data was weaker than expected, but slightly higher than the market's lowest forecast. This increases the likelihood of a rate cut by the Fed later this year. As a non-yielding asset, gold typically performs better in a low-interest-rate environment.
According to CME Group's FedWatch tool, market participants now expect the Federal Reserve to cut rates twice before the end of the year, starting in September. Earlier this week, the Fed held rates steady at 4.25%-4.50%. Chairman Powell said it was too early to determine whether a rate cut would be forthcoming in September, citing inflation and employment data.
On the trade front
Trump has imposed a new round of tariffs on exports from dozens of trading partners, including Canada, Brazil, India and Taiwan, causing a global market crash.
Countries are scrambling to negotiate a better deal. In times of economic and geopolitical uncertainty, safe-haven gold is in high demand.
So far in 2025, gold prices have risen more than $400, hitting a record high of $3,167.57/oz on April 3, driven by safe-haven demand and central bank buying.
Weak jobs data also sent the dollar lower against major currencies, further supporting gold prices as a weaker greenback makes gold more attractive to investors holding other currencies.
Investors' Attention Turns to September FOMC Meeting
Markets are now focused on the September Federal Open Market Committee (FOMC) meeting. Facing the dual pressures of volatile inflation, slowing employment and escalating global trade tensions, the Fed will have to balance its inflation target with economic growth.
Markets are betting on the Fed to begin a new round of easing, and gold, as a hedge against currency devaluation and economic uncertainty, is expected to continue to benefit.
Gold prices have risen more than 30% year-to-date, reflecting the market’s preference for safe-haven assets. If weak U.S. economic data continues in the coming weeks, or if new geopolitical conflicts emerge, gold prices are expected to continue their upward trend, challenging new highs for the year.
Summary, Commentary
Weak employment, new tariffs and a slumping stock market have all contributed to a strong recovery in gold prices. With the possibility of the US Federal Reserve cutting interest rates in September increasing significantly, gold market sentiment has warmed and risk aversion has returned.
Investors will need to keep a close eye on inflation data, Fed officials’ speeches, and whether Trump continues to stoke trade tensions, which could lead to greater volatility in the gold market.
Against the backdrop of the unexpected non-farm payrolls report and moderate inflation, the market has essentially “locked in” the possibility of a rate cut in September, but whether the cut will be 25 or 50 basis points, and whether there will be further rate cuts in the future, will depend on the interaction between the Fed members’ verbal guidance and market expectations.
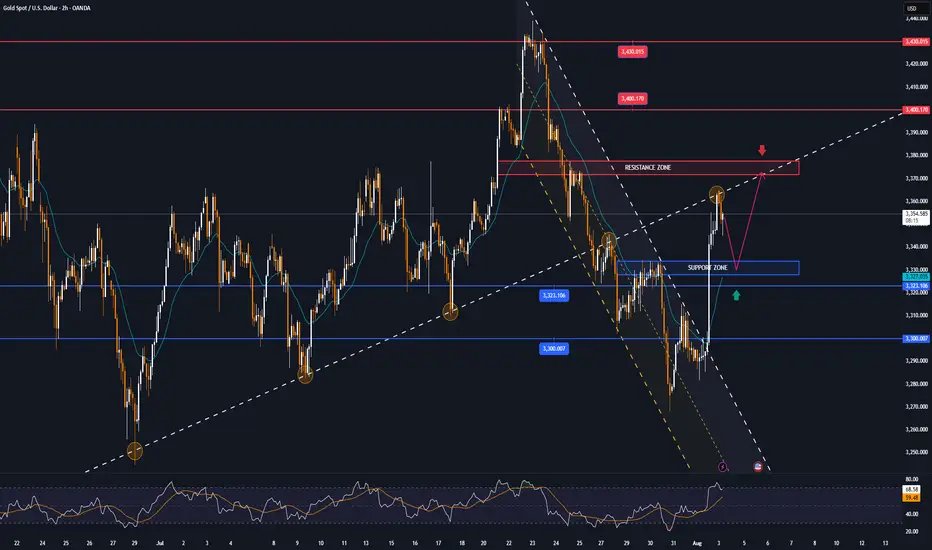
Technical Outlook Analysis OANDA:XAUUSD
On the daily chart, affected by the sudden weak data that shocked the market, gold broke most of the technical structure that was leaning towards the downside. Price action was pushed above the EMA21, while the short-term downtrend channel was also broken above and the Relative Strength Index crossed above 50.
These are the initial conditions for a short-term uptrend. But to confirm an uptrend and a new uptrend in the near term, gold needs to continue to break above the 0.236% Fibonacci retracement level (3,371 USD) first, then the target will be around 3,400 USD in the short term.
If gold breaks above $3,400 again, traders should set a new target of $3,430 in the short term, rather than $3,450 which is the all-time high.
Motivationally, the RSI has not reached oversold territory to provide pure reversal support, but it has been pushed by the market shock after the NFP data release, so this rally may not be sustainable in a purely motivational way either.
Overall, gold is now more bullish after a rally on Friday, opening up initial conditions for expectations of a new uptrend. And the notable points will be listed as follows.
Support: 3,323 – 3,310 – 3,300 USD
Resistance: 3,371 – 3,400 – 3,430 USD
SELL XAUUSD PRICE 3376 - 3374⚡️
↠↠ Stop Loss 3380
→Take Profit 1 3368
↨
→Take Profit 2 3362
BUY XAUUSD PRICE 3327 - 3329⚡️
↠↠ Stop Loss 3323
→Take Profit 1 3335
↨
→Take Profit 2 3341
GBPUSD ANALYSISAfter seeing the previous day close and reject an area of resistance and a break below the trendline area of support on the lower timeframe, but with the daily still bearish the 4hr is pushing to the upside. A break of 4hr structure support could be a clear signal that sellers are now pushing price.

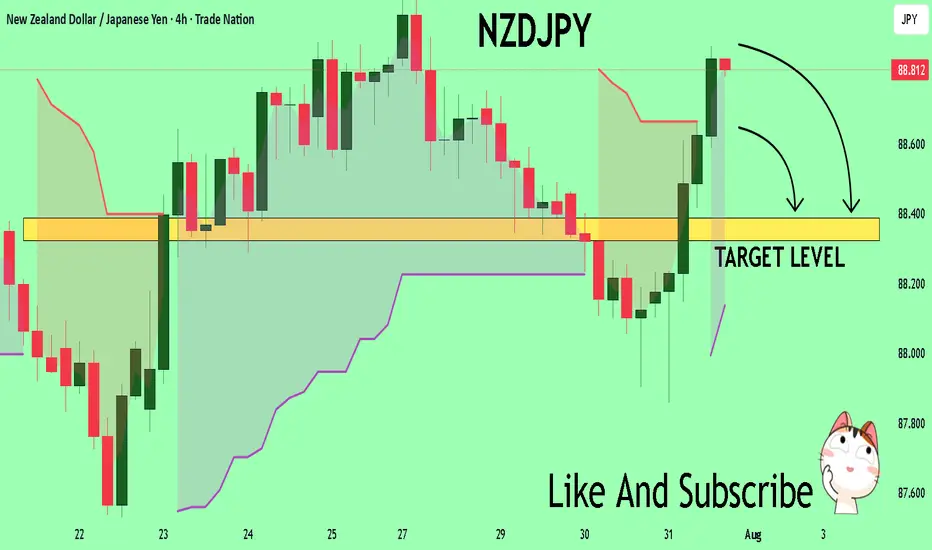
NZDJPY The Target Is DOWN! SELL!
My dear friends,
Please, find my technical outlook for NZDJPY below:
The price is coiling around a solid key level - 88.806
Bias - Bearish
Technical Indicators: Pivot Points Low anticipates a potential price reversal.
Super trend shows a clear sell, giving a perfect indicators' convergence.
Goal - 88.388
About Used Indicators:
The pivot point itself is simply the average of the high, low and closing prices from the previous trading day.
Disclosure: I am part of Trade Nation's Influencer program and receive a monthly fee for using their TradingView charts in my analysis.
———————————
WISH YOU ALL LUCK
USDJPY Will Grow! Buy!
Here is our detailed technical review for USDJPY.
Time Frame: 12h
Current Trend: Bullish
Sentiment: Oversold (based on 7-period RSI)
Forecast: Bullish
The market is testing a major horizontal structure 147.215.
Taking into consideration the structure & trend analysis, I believe that the market will reach 150.314 level soon.
P.S
The term oversold refers to a condition where an asset has traded lower in price and has the potential for a price bounce.
Overbought refers to market scenarios where the instrument is traded considerably higher than its fair value. Overvaluation is caused by market sentiments when there is positive news.
Disclosure: I am part of Trade Nation's Influencer program and receive a monthly fee for using their TradingView charts in my analysis.
Like and subscribe and comment my ideas if you enjoy them!

EURUSD: Bearish Continuation
Remember that we can not, and should not impose our will on the market but rather listen to its whims and make profit by following it. And thus shall be done today on the EURUSD pair which is likely to be pushed down by the bears so we will sell!
Disclosure: I am part of Trade Nation's Influencer program and receive a monthly fee for using their TradingView charts in my analysis.
❤️ Please, support our work with like & comment! ❤️

USDJPY My Opinion! BUY!
My dear friends,
My technical analysis for USDJPY is below:
The market is trading on 147.23 pivot level.
Bias - Bullish
Technical Indicators: Both Super Trend & Pivot HL indicate a highly probable Bullish continuation.
Target - 148.77
About Used Indicators:
A pivot point is a technical analysis indicator, or calculations, used to determine the overall trend of the market over different time frames.
Disclosure: I am part of Trade Nation's Influencer program and receive a monthly fee for using their TradingView charts in my analysis.
———————————
WISH YOU ALL LUCK

EUR_JPY SUPPORT AHEA|LONG|
✅EUR_JPY is going down now
But a strong support level is ahead at 169.757
Thus I am expecting a rebound
And a move up towards the target of 170.400
LONG🚀
✅Like and subscribe to never miss a new idea!✅
Disclosure: I am part of Trade Nation's Influencer program and receive a monthly fee for using their TradingView charts in my analysis.

EURJPY Will Go Down From Resistance! Short!
Please, check our technical outlook for EURJPY.
Time Frame: 12h
Current Trend: Bearish
Sentiment: Overbought (based on 7-period RSI)
Forecast: Bearish
The market is approaching a significant resistance area 170.468.
Due to the fact that we see a positive bearish reaction from the underlined area, I strongly believe that sellers will manage to push the price all the way down to 168.585 level.
P.S
Overbought describes a period of time where there has been a significant and consistent upward move in price over a period of time without much pullback.
Disclosure: I am part of Trade Nation's Influencer program and receive a monthly fee for using their TradingView charts in my analysis.
Like and subscribe and comment my ideas if you enjoy them!

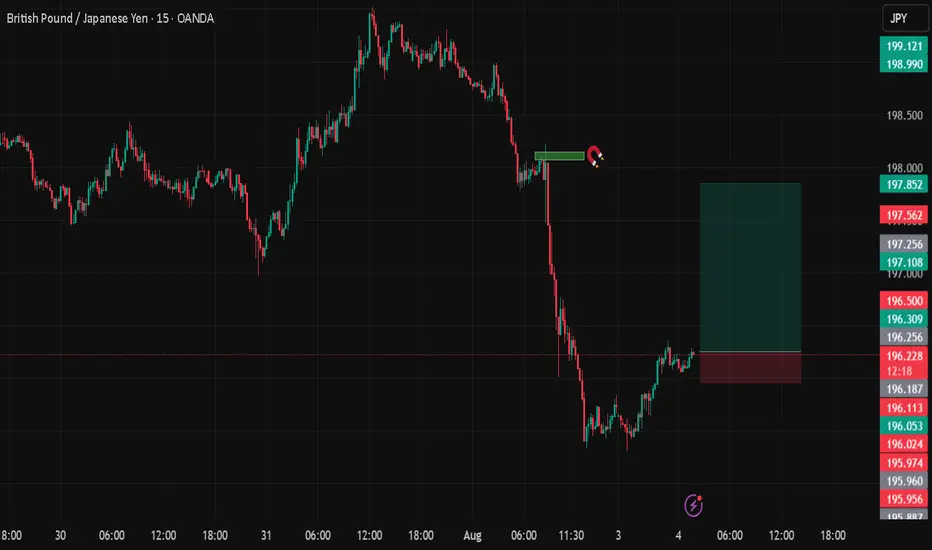
GBPJPYDate:
August 3,2025
Session:
Tokyo Session
Pair:
GBPJPY
Bias:
Long
Fridays New York open left a liquidity pool. I see todays Asia or London session sweeping that area.
Entry:196.254
Stop Loss:195.957
Target:197.847
RR:5.32
GBPCHF: Short Signal with Entry/SL/TP
GBPCHF
- Classic bearish setup
- Our team expects bearish continuation
SUGGESTED TRADE:
Swing Trade
Short GBPCHF
Entry Point - 1.0741
Stop Loss - 1.0754
Take Profit - 1.0714
Our Risk - 1%
Start protection of your profits from lower levels
Disclosure: I am part of Trade Nation's Influencer program and receive a monthly fee for using their TradingView charts in my analysis.
❤️ Please, support our work with like & comment! ❤️

GBPJPY Is Very Bearish! Sell!
Please, check our technical outlook for GBPJPY.
Time Frame: 45m
Current Trend: Bearish
Sentiment: Overbought (based on 7-period RSI)
Forecast: Bearish
The market is approaching a significant resistance area 198.994.
Due to the fact that we see a positive bearish reaction from the underlined area, I strongly believe that sellers will manage to push the price all the way down to 198.786 level.
P.S
Overbought describes a period of time where there has been a significant and consistent upward move in price over a period of time without much pullback.
Disclosure: I am part of Trade Nation's Influencer program and receive a monthly fee for using their TradingView charts in my analysis.
Like and subscribe and comment my ideas if you enjoy them!

USDCHF Will Go Down From Resistance! Short!
Take a look at our analysis for USDCHF.
Time Frame: 9h
Current Trend: Bearish
Sentiment: Overbought (based on 7-period RSI)
Forecast: Bearish
The market is approaching a key horizontal level 0.813.
Considering the today's price action, probabilities will be high to see a movement to 0.806.
P.S
We determine oversold/overbought condition with RSI indicator.
When it drops below 30 - the market is considered to be oversold.
When it bounces above 70 - the market is considered to be overbought.
Disclosure: I am part of Trade Nation's Influencer program and receive a monthly fee for using their TradingView charts in my analysis.
Like and subscribe and comment my ideas if you enjoy them!
