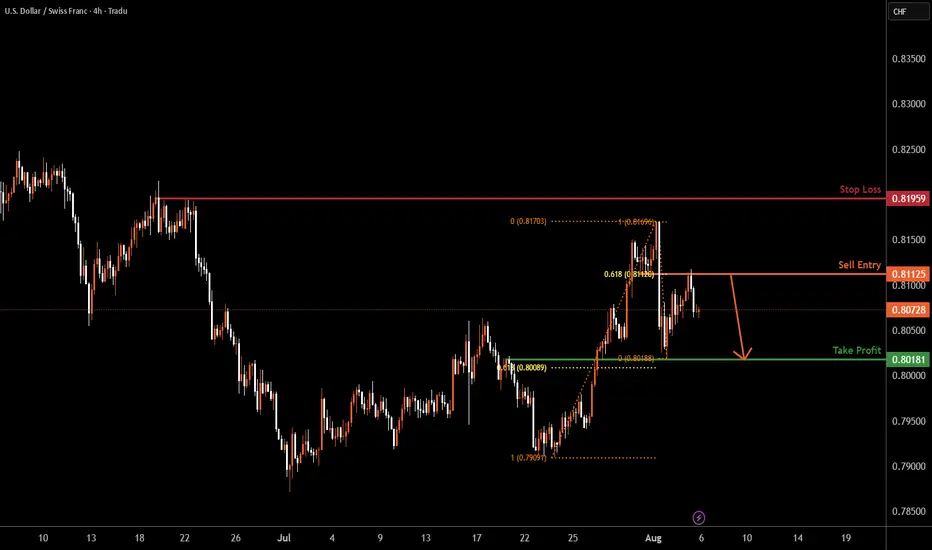
USDCHF H4 | Bearish dropUSD/CHF has rejected off the sell entry which is a pullback resistance that lines up with the 61.8% Fibonacci retracement and could potentially drop from this level to the take profit.
Sell entry is at 0.8112, which is a pullback resistance that lines up with the 61.8% Fibonacci retracement.
Stop loss is at 0.8195, which is a swing high resistance.
Take profit is at 0.8018, which is a pullback support that is slightly above the 61.8% Fibonacci retracement.
High Risk Investment Warning
Trading Forex/CFDs on margin carries a high level of risk and may not be suitable for all investors. Leverage can work against you.
Stratos Markets Limited (tradu.com ):
CFDs are complex instruments and come with a high risk of losing money rapidly due to leverage. 65% of retail investor accounts lose money when trading CFDs with this provider. You should consider whether you understand how CFDs work and whether you can afford to take the high risk of losing your money.
Stratos Europe Ltd (tradu.com ):
CFDs are complex instruments and come with a high risk of losing money rapidly due to leverage. 66% of retail investor accounts lose money when trading CFDs with this provider. You should consider whether you understand how CFDs work and whether you can afford to take the high risk of losing your money.
Stratos Global LLC (tradu.com ):
Losses can exceed deposits.
Please be advised that the information presented on TradingView is provided to Tradu (‘Company’, ‘we’) by a third-party provider (‘TFA Global Pte Ltd’). Please be reminded that you are solely responsible for the trading decisions on your account. There is a very high degree of risk involved in trading. Any information and/or content is intended entirely for research, educational and informational purposes only and does not constitute investment or consultation advice or investment strategy. The information is not tailored to the investment needs of any specific person and therefore does not involve a consideration of any of the investment objectives, financial situation or needs of any viewer that may receive it. Kindly also note that past performance is not a reliable indicator of future results. Actual results may differ materially from those anticipated in forward-looking or past performance statements. We assume no liability as to the accuracy or completeness of any of the information and/or content provided herein and the Company cannot be held responsible for any omission, mistake nor for any loss or damage including without limitation to any loss of profit which may arise from reliance on any information supplied by TFA Global Pte Ltd.
The speaker(s) is neither an employee, agent nor representative of Tradu and is therefore acting independently. The opinions given are their own, constitute general market commentary, and do not constitute the opinion or advice of Tradu or any form of personal or investment advice. Tradu neither endorses nor guarantees offerings of third-party speakers, nor is Tradu responsible for the content, veracity or opinions of third-party speakers, presenters or participants.
Forex
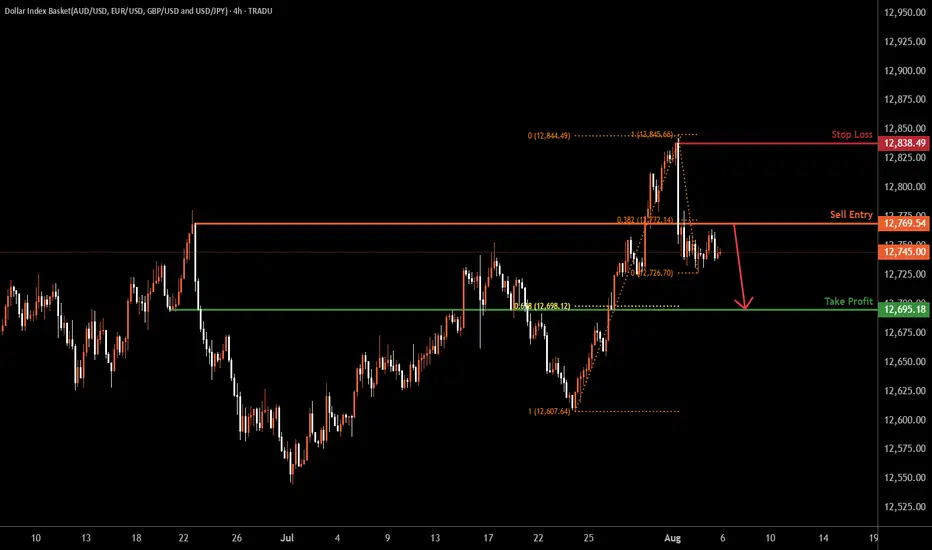
USDOLLA H4 | Bearish dropBased on the H4 chart analysis, we can see the price rise to the sell entry which is a pullback resistance and could drop from this level to the take profit.
Sell entry is at 12,769.54, which is a pullback resistance that lines up with the 38.2% Fibonacci retracement.
Stop loss is at 12,838,49, which is a swing high resistance.
Take profit is at 12,695.18, which is a pullback support that aligns with the 61.8% Fibonacci retracement.
High Risk Investment Warning
Trading Forex/CFDs on margin carries a high level of risk and may not be suitable for all investors. Leverage can work against you.
Stratos Markets Limited (tradu.com ):
CFDs are complex instruments and come with a high risk of losing money rapidly due to leverage. 65% of retail investor accounts lose money when trading CFDs with this provider. You should consider whether you understand how CFDs work and whether you can afford to take the high risk of losing your money.
Stratos Europe Ltd (tradu.com ):
CFDs are complex instruments and come with a high risk of losing money rapidly due to leverage. 66% of retail investor accounts lose money when trading CFDs with this provider. You should consider whether you understand how CFDs work and whether you can afford to take the high risk of losing your money.
Stratos Global LLC (tradu.com ):
Losses can exceed deposits.
Please be advised that the information presented on TradingView is provided to Tradu (‘Company’, ‘we’) by a third-party provider (‘TFA Global Pte Ltd’). Please be reminded that you are solely responsible for the trading decisions on your account. There is a very high degree of risk involved in trading. Any information and/or content is intended entirely for research, educational and informational purposes only and does not constitute investment or consultation advice or investment strategy. The information is not tailored to the investment needs of any specific person and therefore does not involve a consideration of any of the investment objectives, financial situation or needs of any viewer that may receive it. Kindly also note that past performance is not a reliable indicator of future results. Actual results may differ materially from those anticipated in forward-looking or past performance statements. We assume no liability as to the accuracy or completeness of any of the information and/or content provided herein and the Company cannot be held responsible for any omission, mistake nor for any loss or damage including without limitation to any loss of profit which may arise from reliance on any information supplied by TFA Global Pte Ltd.
The speaker(s) is neither an employee, agent nor representative of Tradu and is therefore acting independently. The opinions given are their own, constitute general market commentary, and do not constitute the opinion or advice of Tradu or any form of personal or investment advice. Tradu neither endorses nor guarantees offerings of third-party speakers, nor is Tradu responsible for the content, veracity or opinions of third-party speakers, presenters or participants.
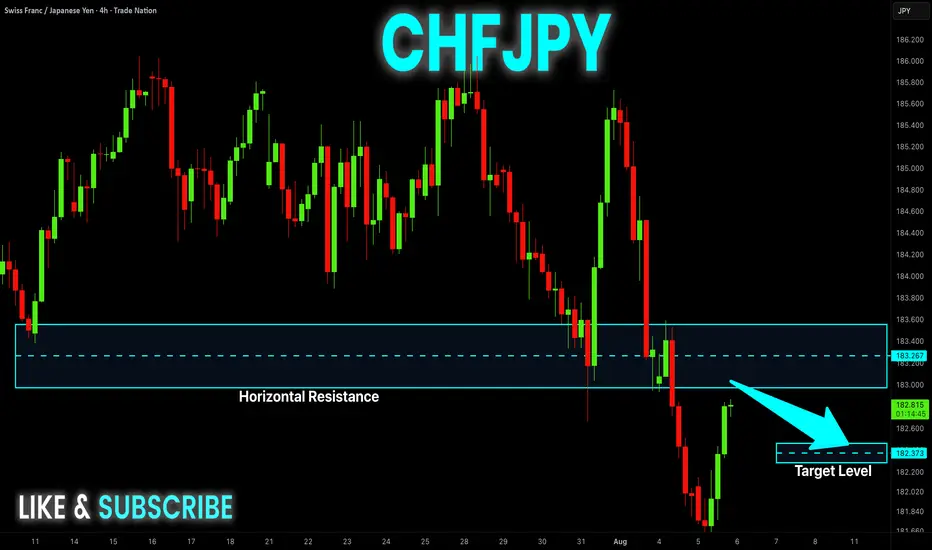
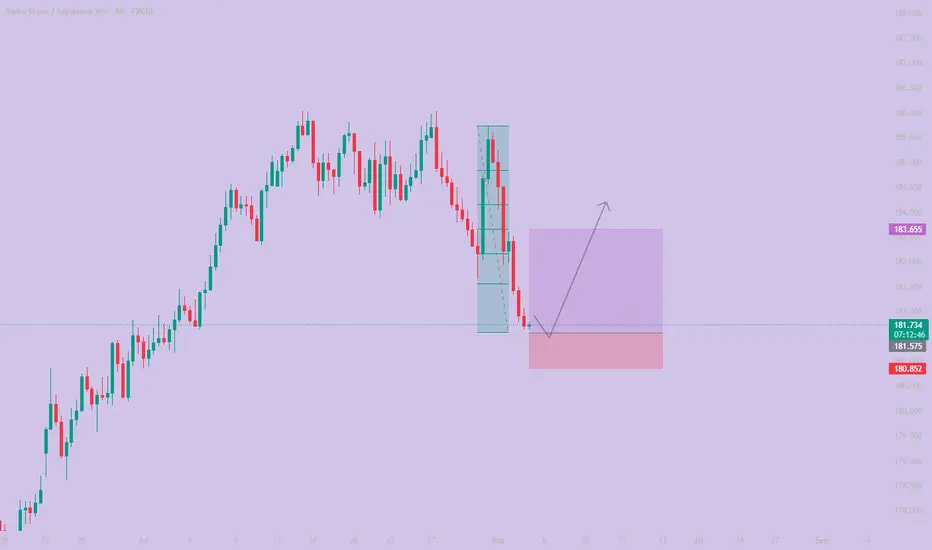
CHF-JPY Potential Short! Sell!
Hello,Traders!
CHF-JPY is making a rebound
But we are bearish biased
And after the pair hits the
Horizontal resistance of 183.400
We will be expecting a
Local bearish correction
Sell!
Comment and subscribe to help us grow!
Check out other forecasts below too!
Disclosure: I am part of Trade Nation's Influencer program and receive a monthly fee for using their TradingView charts in my analysis.
NZD_JPY LOCAL SHORT|
✅NZD_JPY went up sharply
But a strong resistance level was hit at 87.100
Thus I am expecting a pullback
And a move down towards the target of 86.937
SHORT🔥
✅Like and subscribe to never miss a new idea!✅

NZDCHF: Bullish Continuation is Highly Probable! Here is Why:
Remember that we can not, and should not impose our will on the market but rather listen to its whims and make profit by following it. And thus shall be done today on the NZDCHF pair which is likely to be pushed up by the bulls so we will buy!
Disclosure: I am part of Trade Nation's Influencer program and receive a monthly fee for using their TradingView charts in my analysis.
❤️ Please, support our work with like & comment! ❤️

USD CAD Where Are We Heading DEEP ANALYSIS Hi Trading Fam
So with USD CAD this is what we are seeing:
Bearish:
If we stay under 1.38 then a drop down to the 1.37 range
Bullish:
If we can close above the high at 1.38 then we have levels of 1.3840 , and 1.3980 that could be hit
Trade Smarter Live Better
Kris

Gold 30M Chart Alert! Reversal Potential at Key SupportThe chart shows a current bearish move in XAU/USD with price testing key support levels around 3,356.390. We've identified a potential sweep of the market, as price might dip further to clear out stop losses before reversing upwards.
📊 Key Levels:
Support: The lower level near 3,350 is a strong support zone where price might find buying interest.
Resistance: The 3,374 level marks resistance where price could face selling pressure.
📈 Potential Scenario:
Bullish Setup: If the price tests the support zone around 3,350 and holds, we could see a bounce back upwards toward 3,374 and possibly beyond, depending on market conditions.
Price Action: Look for a sweep at the lower levels to clear out liquidity before a potential upward move, confirming the reversal.
💡 Trade Idea:
Entry Zone: Watch for price action near the 3,350 support zone for a potential buy setup.
Target Zone: Look for a possible move up to 3,374 or higher.

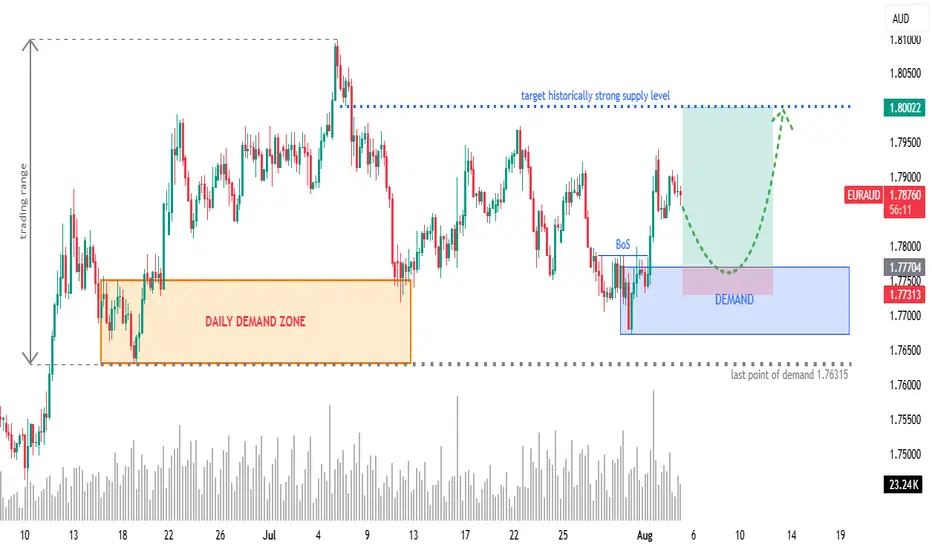
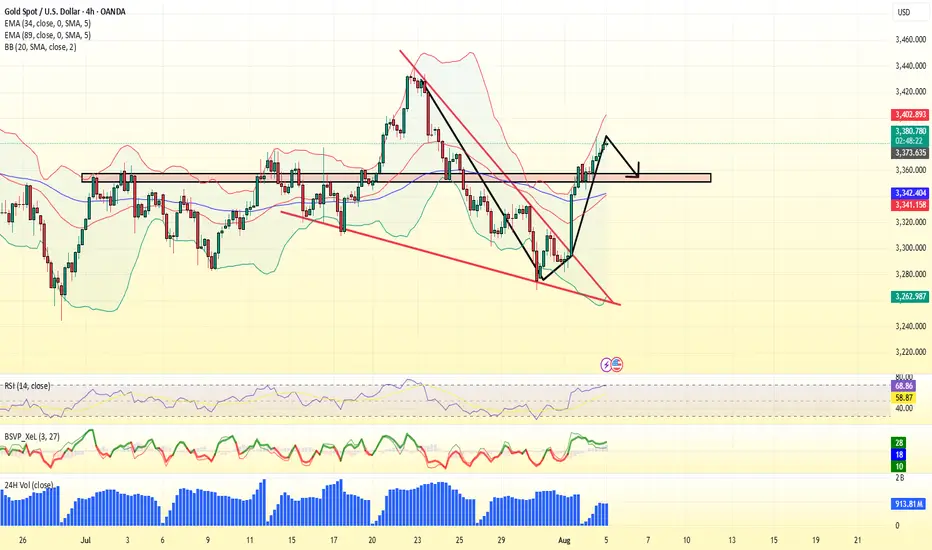
EURAUD 4H: Long Setup from Fresh Demand ZoneOverview:
OANDA:EURAUD retracing into a newly formed 4H demand zone after a bullish Break of Structure (BoS). Eyes on continuation towards a historically significant supply zone at 1.8000.
🧩 Setup Details
• Asset & Timeframe: EURAUD, 4H
• Bias: Bullish
• Entry Zone: 1.77300 – 1.77700 (DEMAND area)
• Targets:
🎯 T1 = 1.7900 (minor reaction level)
🎯 T2 = 1.8000 (historical supply level)
• Stop-Loss: Below 1.77300 (last valid demand)
• Risk-Reward: Approx. 1:6+
🧠 Why Now? (Trade Rationale)
• ✅ Fresh 4H Demand Zone: Price is retracing into a clear demand zone after rejecting lower prices.
• ✅ Break of Structure (BoS): Bullish BoS confirms shift in order flow.
• ✅ Volume Confirmation: Increasing demand near current price levels.
• ✅ Clear Liquidity Sweep: Price likely swept short-term lows before BoS.
• ✅ Target Supply Zone: 1.8000 is a well-respected historical supply/resistance level — clean magnet for price.
⏱ Multi-Timeframe Context
• Daily Chart: Price is reacting off a larger DAILY DEMAND ZONE. Trend bias is bullish.
• 4H Chart: Structure break + demand formation suggest continuation.
• 1H/Entry Level: Monitor price action in the blue zone for lower-timeframe confirmation (e.g. bullish engulfing, flip zones, LQ sweep, etc.) and potentially greater risk-reward.
📉 Risk Management & Duration
• Stop below 1.76315 keeps you protected from deeper invalidation.
• Trade Duration: Short to mid-term (1–4 days).
• Position Size: Scale based on volatility; ideal for swing trade conditions.
📌 Trade Plan Summary
📍 Watch for bullish PA on re-entry into demand (1.77300–1.77700)
📍 Set SL below 1.76315
📍 TP1 at 1.79000 — partials advised
📍 TP2 at 1.80000 — strong historical level
📍 Adjust SL to BE on momentum breakout
NASDAQ Week 32 OutlookOn the US Nas 100 1-hour chart, a bearish breakout from a symmetrical triangle suggests downward momentum. The Fair Value Gap at 23,500.0 is a pivotal level—watch for a breakout and retest here to confirm sell entries. Aim for the target at 22681.1, with a stop-loss at 23,740.4 to protect against adverse moves.

gold price forecast today short term increase forecastmarket overview
Gold prices had a correction around 2325 yesterday, after recovering from a low of 2,290 USD. In the context of investors expecting the Fed to cut interest rates soon, gold is being strongly supported by the prospect of loose monetary policy and the weak USD.
Factors supporting gold prices
Weaker-than-expected US labor data
The non-farm payrolls report released on Friday showed the number of new jobs reaching only 142,000 - much lower than the expected level of 180,000. This increased expectations that the Fed will cut interest rates as early as September, strongly supporting gold prices

XAUUSD – Decision Zone Between $3,395 & $3,362Gold continues to trade within a defined structure, now pulling back from local highs after rejecting near the open. Price is approaching key support just above $3,362, which now acts as the decision point for the next leg.
Buyers held this zone previously, but momentum has weakened and the next move will be critical:
→ $3,395.76 is the upside trigger; a confirmed 30m close above could open the door toward $3,407 and higher
→ A failure to hold $3,362.60 support would expose $3,358 and possibly accelerate a bearish continuation
→ The structure remains range bound, but compression is building beneath resistance
This is a pivotal zone for gold short term. Either bulls reclaim control with a strong breakout above $3,395 or sellers step in on a confirmed breakdown below $3,362 to reset structure lower.
#XAUUSD #GoldAnalysis #PriceAction #BreakoutLevels #SupportResistance

NZD/JPY BEST PLACE TO BUY FROM|LONG
NZD/JPY SIGNAL
Trade Direction: long
Entry Level: 86.809
Target Level: 88.001
Stop Loss: 86.010
RISK PROFILE
Risk level: medium
Suggested risk: 1%
Timeframe: 8h
Disclosure: I am part of Trade Nation's Influencer program and receive a monthly fee for using their TradingView charts in my analysis.
✅LIKE AND COMMENT MY IDEAS✅

AUD/JPY LONG FROM SUPPORT
Hello, Friends!
The BB lower band is nearby so AUD-JPY is in the oversold territory. Thus, despite the downtrend on the 1W timeframe I think that we will see a bullish reaction from the support line below and a move up towards the target at around 96.130.
Disclosure: I am part of Trade Nation's Influencer program and receive a monthly fee for using their TradingView charts in my analysis.
✅LIKE AND COMMENT MY IDEAS✅

#016: CHF/JPY Long Investment Opportunity
Today I want to show you this long investment opportunity by placing a BUY LIMIT order on CHF/JPY. Hello, I'm Forex Trader Andrea Russo, an independent trader and prop trader with $200,000 in capital under management. Thank you in advance for your time.
The CHF/JPY pair is building an extremely interesting technical pattern, which could offer one of the best risk-controlled long opportunities in recent weeks.
🧠 Advanced Structural Analysis
After an orderly sequence of lower highs, the price recently completed a bearish move that looks more like directional manipulation than a true breakout.
Three key elements support this hypothesis:
- Final compression on decreasing volume
- Visible divergence between relative strength and price movement
- Volume clusters interrupted in the lower zone, with the LVN area still empty and devoid of institutional liquidity
🔍 The hunting zone is already active
According to our studies, the price is exactly within the so-called "stop hunting zone," a range between technical and psychological levels where:
- Retail traders are closing long positions at a loss
- Breakout traders are entering short positions late
- Market makers are accumulating passively, exploiting market emotion
Historically, these zones herald strong reversals if defended by banks' protective orders.
🔄 Multi-Timeframe Confluence
All higher timeframes (4H, 8H, and Daily) show a consistent picture of active cyclical support, with a potential harmonic pattern nearing completion and a technical structure that coincides with previous levels of institutional reaction.
Gold's Next Move? Eyes on the Liquidity Trap Below!Gold has created internal liquidity during the New York session and is now moving downward. There is liquidity resting below the recent swing lows, and beneath that lie bullish Pending Demand (PD) arrays. If the market takes out this liquidity, we can then look for bullish confirmations from the PD arrays for potential buy opportunities.
Do Your Own Research (DYOR).

Gold price today August 5: strong reversalWorld gold prices unexpectedly reversed sharply, as Europe and the US continued to release poor economic data. Specifically, the European economic area announced the investor confidence index released monthly by Sentix GmbH, August at a decrease of 3.7 points, much lower than the increase of 4.5 points in July.
In the US, factory orders released monthly by the US Census Bureau, measuring the change in the value of new orders for goods purchased at US factories, decreased by 4.8% in June compared to the previous month. Although slightly higher than the forecast of a decrease of 4.9%, it decreased sharply compared to the increase of 8.3% in May.
Thus, both the US and the European region are showing weaknesses in economic development. Because new orders in the US are considered a forward-looking indicator of upcoming demand for manufactured goods. Falling orders indicate that the production and business activities of US enterprises will face difficulties in operation.
GBPUSD LONG4H supply still holding, but I expect a bullish move this week if possible.
Demand was in control on the 5M, creating a clean demand zone with a liquidity sweep.
That gave clear reason for higher prices. Dropped down to the 15s for entry.
Tapped out after 3RR was achieved.
Same system. Same pair. Same outcome.
Zero emotion. Just posting what works.

EURJPY ANALYSISAfter seeing the previous weekly candle close bearish and the daily from Monday close below the low of the last bearish candle which is a sign of sellers strength, we could expect further sells to continue but a simple retracement on the 4hr back to an area of interest for a potential LH structure point before further sells

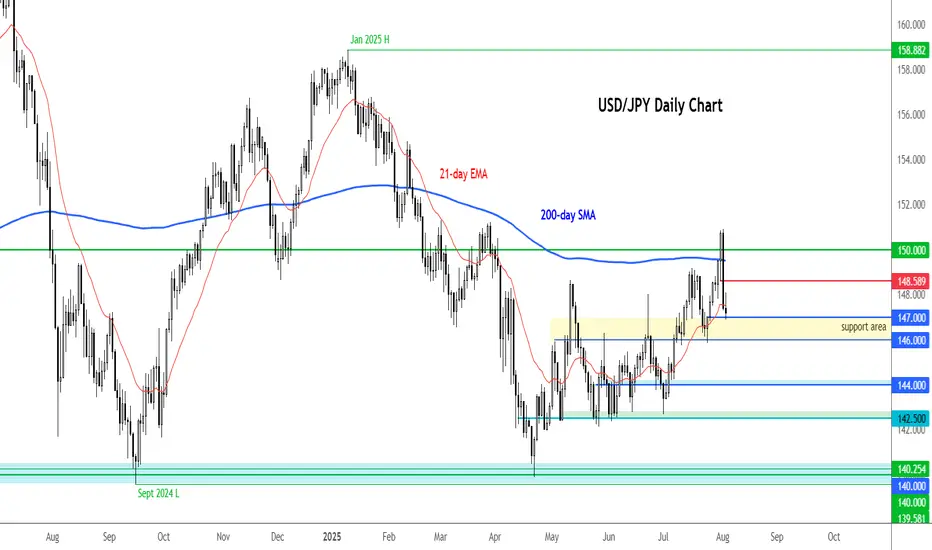
USD/JPY testing key support after Friday's dropThe USD/JPY fell sharply Friday in reaction to the weak US jobs data. But it is now testing the upside of a massive short-term support area, between 146.00-147.00. Can we see a bounce here towards 148.60 zone initially?
By Fawad Razaqzada, market analyst with FOREX.com
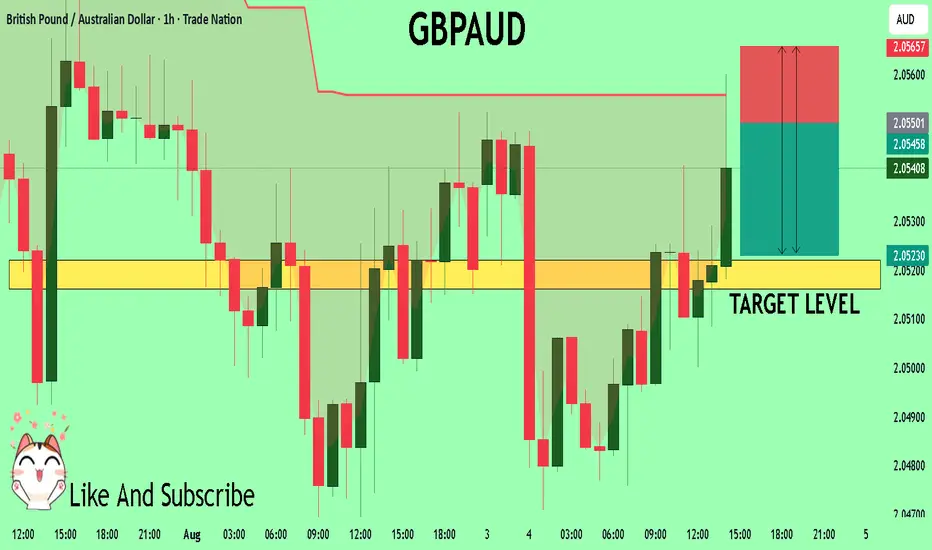
GBPAUD Technical Analysis! SELL!
My dear friends,
Please, find my technical outlook for GBPAUD below:
The instrument tests an important psychological level 2.0550
Bias - Bearish
Technical Indicators: Supper Trend gives a precise Bearish signal, while Pivot Point HL predicts price changes and potential reversals in the market.
Target - 2.0522
Recommended Stop Loss - 2.0565
About Used Indicators:
Super-trend indicator is more useful in trending markets where there are clear uptrends and downtrends in price.
Disclosure: I am part of Trade Nation's Influencer program and receive a monthly fee for using their TradingView charts in my analysis.
———————————
WISH YOU ALL LUCK
XAUUSD 30M Range Trap Holding, But Will Bulls Break Above $3366Gold is currently trading within a well defined intraday range, with clear resistance around $3,366.36 and support near $3,339.78. After a strong initial move, price action has stalled, reflecting indecision and balanced order flow between buyers and sellers.
The market now approaches a key inflection point:
→ A confirmed 30 minute candle close above $3,366.36 would signal potential bullish continuation, with immediate targets at $3,368.99 and $3,371.11
→ Conversely, a close below $3,339.78 may trigger a downside move toward $3,331.66, followed by $3,328.21
Momentum remains neutral within the range, and any premature entries carry increased risk of whipsaw. Patience is essential, a clean breakout with structure and volume confirmation will offer higher probability trade setups.
This remains a rangebound environment until proven otherwise. Breakout traders should stay alert, but disciplined.
#XAUUSD #Gold #TechnicalAnalysis #PriceAction #SupportResistance #BreakoutWatch #MarketStructure #30mChart

AUDJPY Will Go Lower! Sell!
Take a look at our analysis for AUDJPY.
Time Frame: 9h
Current Trend: Bearish
Sentiment: Overbought (based on 7-period RSI)
Forecast: Bearish
The price is testing a key resistance 96.734.
Taking into consideration the current market trend & overbought RSI, chances will be high to see a bearish movement to the downside at least to 96.102 level.
P.S
Overbought describes a period of time where there has been a significant and consistent upward move in price over a period of time without much pullback.
Disclosure: I am part of Trade Nation's Influencer program and receive a monthly fee for using their TradingView charts in my analysis.
Like and subscribe and comment my ideas if you enjoy them!

