GBP/CAD SENDS CLEAR BEARISH SIGNALS|SHORT
GBP/CAD SIGNAL
Trade Direction: short
Entry Level: 1.833
Target Level: 1.821
Stop Loss: 1.840
RISK PROFILE
Risk level: medium
Suggested risk: 1%
Timeframe: 3h
Disclosure: I am part of Trade Nation's Influencer program and receive a monthly fee for using their TradingView charts in my analysis.
✅LIKE AND COMMENT MY IDEAS✅
Forex

CADJPY: Bullish Continuation is Expected! Here is Why:
Balance of buyers and sellers on the CADJPY pair, that is best felt when all the timeframes are analyzed properly is shifting in favor of the buyers, therefore is it only natural that we go long on the pair.
Disclosure: I am part of Trade Nation's Influencer program and receive a monthly fee for using their TradingView charts in my analysis.
❤️ Please, support our work with like & comment! ❤️

GBP/JPY BULLS ARE GAINING STRENGTH|LONG
Hello, Friends!
Previous week’s red candle means that for us the GBP/JPY pair is in the downtrend. And the current movement leg was also down but the support line will be hit soon and lower BB band proximity will signal an oversold condition so we will go for a counter-trend long trade with the target being at 197.696.
Disclosure: I am part of Trade Nation's Influencer program and receive a monthly fee for using their TradingView charts in my analysis.
✅LIKE AND COMMENT MY IDEAS✅

GBP/AUD SELLERS WILL DOMINATE THE MARKET|SHORT
Hello, Friends!
GBP-AUD uptrend evident from the last 1W green candle makes short trades more risky, but the current set-up targeting 2.049 area still presents a good opportunity for us to sell the pair because the resistance line is nearby and the BB upper band is close which indicates the overbought state of the GBP/AUD pair.
Disclosure: I am part of Trade Nation's Influencer program and receive a monthly fee for using their TradingView charts in my analysis.
✅LIKE AND COMMENT MY IDEAS✅

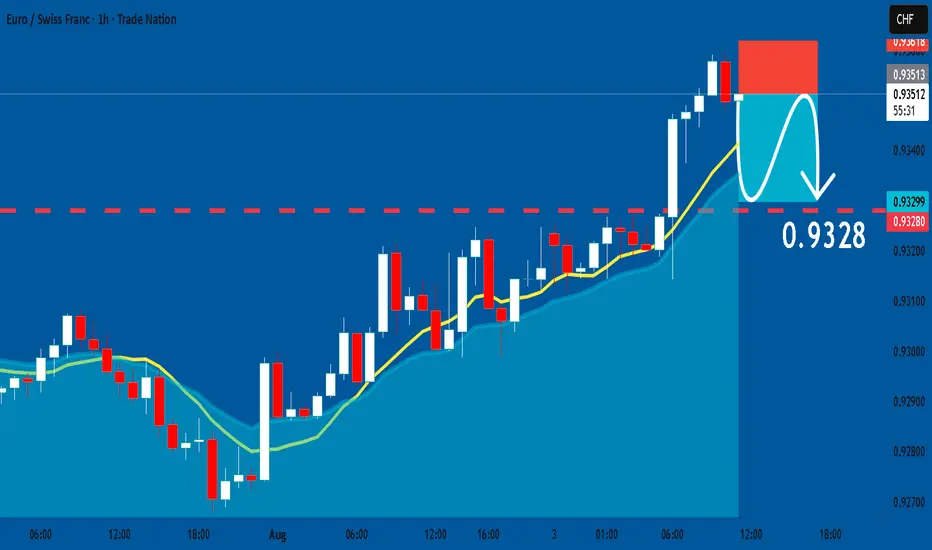
EURCHF: Short Signal Explained
EURCHF
- Classic bearish formation
- Our team expects fall
SUGGESTED TRADE:
Swing Trade
Sell EURCHF
Entry Level - 0.9350
Sl - 0.9361
Tp - 0.9328
Our Risk - 1%
Start protection of your profits from lower levels
Disclosure: I am part of Trade Nation's Influencer program and receive a monthly fee for using their TradingView charts in my analysis.
❤️ Please, support our work with like & comment! ❤️
NZD/JPY BEARS ARE STRONG HERE|SHORT
Hello, Friends!
Previous week’s green candle means that for us the NZD/JPY pair is in the uptrend. And the current movement leg was also up but the resistance line will be hit soon and upper BB band proximity will signal an overbought condition so we will go for a counter-trend short trade with the target being at 88.302.
Disclosure: I am part of Trade Nation's Influencer program and receive a monthly fee for using their TradingView charts in my analysis.
✅LIKE AND COMMENT MY IDEAS✅

CAD/CHF BEARS WILL DOMINATE THE MARKET|SHORT
Hello, Friends!
We are targeting the 0.584 level area with our short trade on CAD/CHF which is based on the fact that the pair is overbought on the BB band scale and is also approaching a resistance line above thus going us a good entry option.
Disclosure: I am part of Trade Nation's Influencer program and receive a monthly fee for using their TradingView charts in my analysis.
✅LIKE AND COMMENT MY IDEAS✅

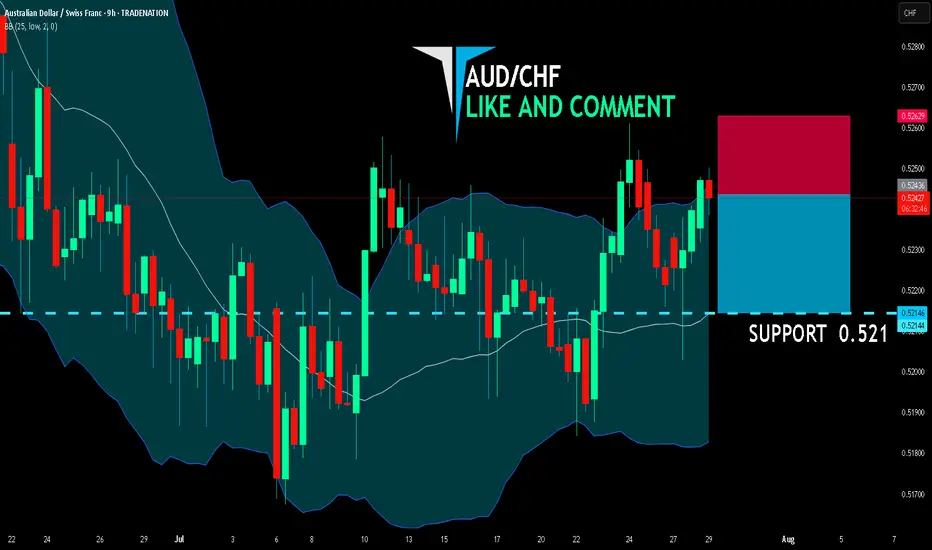
AUD/CHF BEARS ARE STRONG HERE|SHORT
AUD/CHF SIGNAL
Trade Direction: short
Entry Level: 0.524
Target Level: 0.521
Stop Loss: 0.526
RISK PROFILE
Risk level: medium
Suggested risk: 1%
Timeframe: 9h
Disclosure: I am part of Trade Nation's Influencer program and receive a monthly fee for using their TradingView charts in my analysis.
✅LIKE AND COMMENT MY IDEAS✅
USD/CHF BEARS WILL DOMINATE THE MARKET|SHORT
Hello, Friends!
Bearish trend on USD/CHF, defined by the red colour of the last week candle combined with the fact the pair is overbought based on the BB upper band proximity, makes me expect a bearish rebound from the resistance line above and a retest of the local target below at 0.804.
Disclosure: I am part of Trade Nation's Influencer program and receive a monthly fee for using their TradingView charts in my analysis.
✅LIKE AND COMMENT MY IDEAS✅

EUR/GBP BULLS ARE STRONG HERE|LONG
EUR/GBP SIGNAL
Trade Direction: long
Entry Level: 0.863
Target Level: 0.872
Stop Loss: 0.857
RISK PROFILE
Risk level: medium
Suggested risk: 1%
Timeframe: 9h
Disclosure: I am part of Trade Nation's Influencer program and receive a monthly fee for using their TradingView charts in my analysis.
✅LIKE AND COMMENT MY IDEAS✅

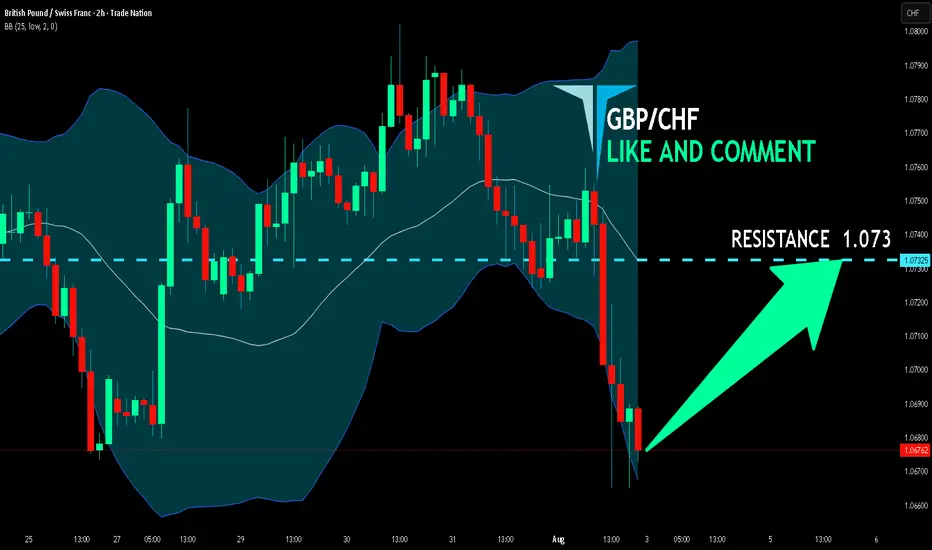
GBP/CHF BEST PLACE TO BUY FROM|LONG
Hello, Friends!
GBP/CHF pair is in the uptrend because previous week’s candle is green, while the price is clearly falling on the 2H timeframe. And after the retest of the support line below I believe we will see a move up towards the target above at 1.073 because the pair is oversold due to its proximity to the lower BB band and a bullish correction is likely.
Disclosure: I am part of Trade Nation's Influencer program and receive a monthly fee for using their TradingView charts in my analysis.
✅LIKE AND COMMENT MY IDEAS✅
XAUUSDHello Traders! 👋
What are your thoughts on GOLD?
Gold saw a strong rally on Friday following the U.S. Non-Farm Payrolls (NFP) report and is now trading near a key resistance zone.
At this resistance, a short-term pullback is likely as traders lock in profits.
We expect the correction to be contained within key support levels, and if price holds in that zone, the uptrend is likely to resume, targeting new highs.
Will gold resume its rally after the correction? Share your view below! 👇
Don’t forget to like and share your thoughts in the comments! ❤️

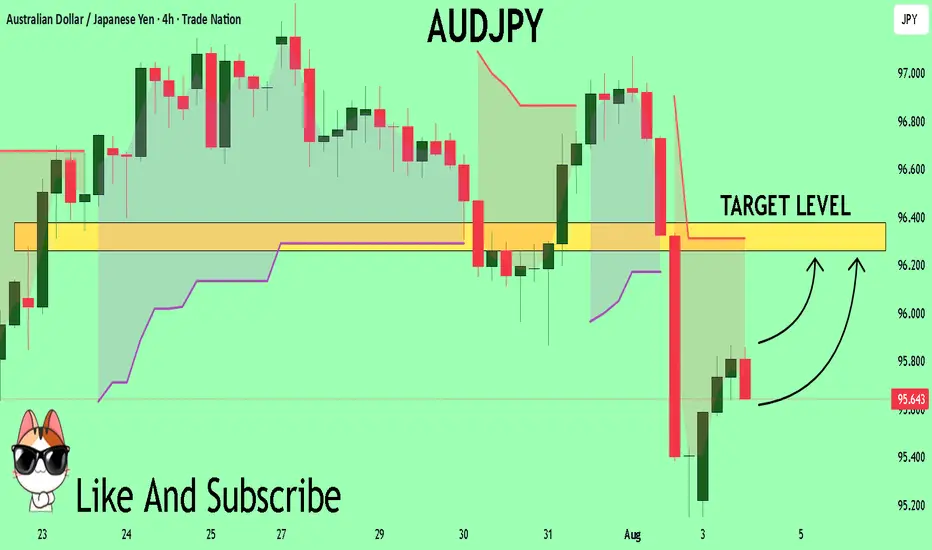
AUDJPY Set To Grow! BUY!
My dear subscribers,
AUDJPY looks like it will make a good move, and here are the details:
The market is trading on 95.649 pivot level.
Bias - Bullish
Technical Indicators: Both Super Trend & Pivot HL indicate a highly probable Bullish continuation.
Target - 96.260
About Used Indicators:
The average true range (ATR) plays an important role in 'Supertrend' as the indicator uses ATR to calculate its value. The ATR indicator signals the degree of price volatility.
Disclosure: I am part of Trade Nation's Influencer program and receive a monthly fee for using their TradingView charts in my analysis.
———————————
WISH YOU ALL LUCK
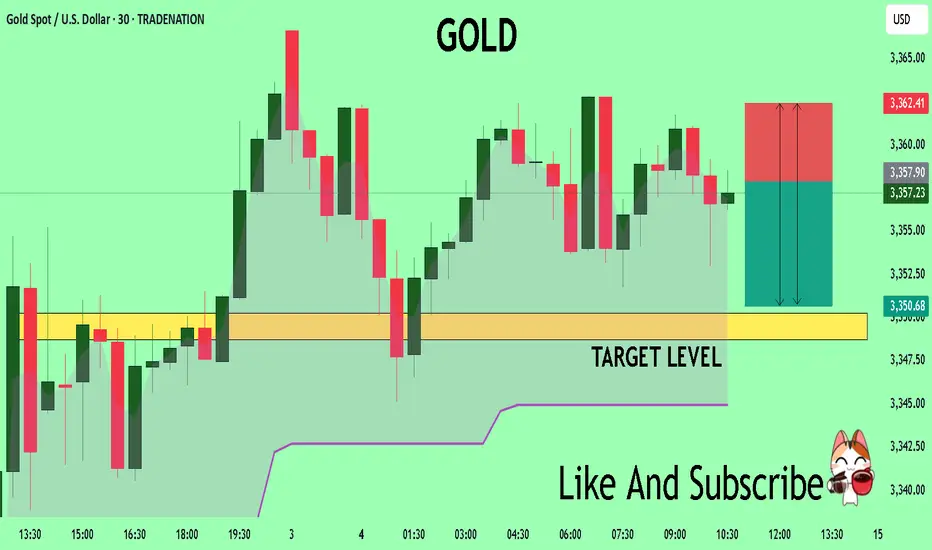
GOLD A Fall Expected! SELL!
My dear subscribers,
My technical analysis for GOLD is below:
The price is coiling around a solid key level - 3358.0
Bias - Bearish
Technical Indicators: Pivot Points Low anticipates a potential price reversal.
Super trend shows a clear sell, giving a perfect indicators' convergence.
Goal - 3350.7
My Stop Loss - 3362.4
About Used Indicators:
By the very nature of the supertrend indicator, it offers firm support and resistance levels for traders to enter and exit trades. Additionally, it also provides signals for setting stop losses
Disclosure: I am part of Trade Nation's Influencer program and receive a monthly fee for using their TradingView charts in my analysis.
———————————
WISH YOU ALL LUCK
Gold on the edge: Will 3,270 break as Fed pressure builds?Hello traders, what’s your view on XAUUSD?
Yesterday, gold remained under pressure as a series of fresh U.S. economic data reinforced expectations that the Federal Reserve will keep interest rates higher for longer. As a result, U.S. Treasury yields surged, the dollar strengthened, and gold came under renewed selling pressure. Currently, XAUUSD is trading around 3,288 USD, down 0.04% on the day.
From a technical standpoint, gold is clearly trading within a well-defined downward-sloping channel, confirming the dominance of bearish momentum. Moreover, both the EMA34 and EMA89 are acting as dynamic resistance levels, repeatedly rejecting any short-term recovery attempts—highlighting the strength of the current downtrend.
If a pullback occurs before the next leg lower, the confluence of resistance and the EMA zone will be crucial to watch. It could offer ideal conditions for potential short setups in line with the trend.
Looking ahead, the next key support lies at 3,270 USD. A break below this level could open the door for a deeper move toward the 32XX area.
What do you think? Will gold continue to drop further?
Good luck and trade safe!

EURUSD – price retest in motion, will the selloff resume?After a decisive break below key support, EURUSD is now retesting that zone in a classic break–retest setup. While familiar to many traders, this structure can be deceptive if the reaction is misread.
Currently, price action remains cautious. Buyers have pushed price back toward the former support – now acting as resistance – but we haven’t seen any strong bullish candle closes. If clear rejection signals emerge (such as a bearish engulfing candle or increasing downside momentum), EURUSD is likely to resume its decline toward TP1 at the Fibonacci extension near 1.1288, or even further down to TP2 at the 1.618 extension.
On the flip side, a convincing break and hold above 1.1580 would invalidate the short-term bearish outlook. That would signal a potential shift in market sentiment – and flexibility will be key.
I’m currently waiting for more confirmation.
What about you – how are you reading this reaction? Let me know your take in the comments!

Gold Trading Strategy XAUUSD August 4, 2025Gold Trading Strategy XAUUSD August 4, 2025:
Gold prices rose more than 2% last Friday, hitting a one-week high, as weaker-than-expected US non-farm payrolls data boosted hopes for a Federal Reserve rate cut and the announcement of new tariffs fueled safe-haven demand for gold.
Fundamental news: The non-farm payrolls report showed only 73,000 jobs added in July, well below market expectations of 110,000. The unemployment rate rose to 4.2%, indicating a cooling labor market.
Technical Analysis: Gold prices are rising strongly after a strong candle in the 3285 - 3300 area as previously predicted. The bullish pattern on the H1 frame has shown that the buyers are returning very strongly. Currently, the price is showing signs of sideway at the 336x area, our strategy today will be to wait for trading at the support zones of the gold price. Important price zones today: 3315 - 3320 and 3330 - 3335.
Today's trading trend: BUY.
Recommended orders:
Plan 1: BUY XAUUSD zone 3330 - 3332
SL 3327
TP 3335 - 3345 - 3355 - 3370.
Plan 2: BUY XAUUSD zone 3318 - 3320
SL 3315
TP 3323 - 3333 - 3343 - 3363.
Plan 3: SELL XAUUSD zone 3370 - 3372
SL 3375
TP 3367 - 3357 - 3347 - 3337 (small volume).
Wishing you a safe, smooth and profitable trading week.💗💗💗💗💗

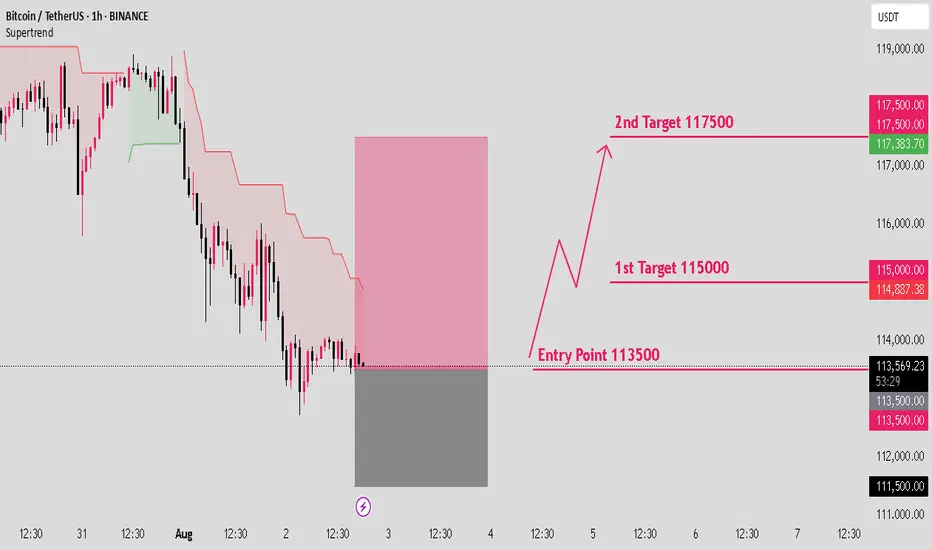
BTCUSD long setup: Targeting the next bull move.Hello IGT FOLLOWERS
Here is my BTCUSD overview, Bitcoin is showing bullish momentum after holding strong support near $112,000. A breakout above the $115000 resistance suggests buyers are regaining control. RSI is turning upward, and volume is increasing on green candles signaling demand. As long as price holds above $113,000, bulls may push toward the $117,500 target.
Key points :
Entry point : 113500
1st Target : 115000
2nd Target : 117500
Follow me for more latest updates and signals
BTC Potential Bullish continuation to a new ATH BTC Looking Bullish after the Pull back .we anticipating a bullish continuation from 114.600 to the high 122k and above. If you trade risk management is a must so you don't get caught up in the volatility of the crypto Market. #Btcusd

#AN023: US Tariffs and Jobs Data Sinking the Dollar
Today I want to talk to you about the latest relevant news of the week, focusing on US tariffs and the jobs data sinking the dollar and their overall impact on forex. Hello, I'm Forex Trader Andrea Russo, an independent trader and prop trader with $200,000 in capital under management. Thank you in advance for your time.
Let's get started:
1. Disappointing US jobs & new Trump tariffs
The Non-Farm Payrolls report (July) shows only 73,000 new jobs (+unemployment rates at 4.2%), with negative revisions for May-June: -258,000 jobs.
President Trump immediately signed executive orders imposing reciprocal tariffs (10–41%) on 68 countries, including Canada, Switzerland, India, and Taiwan.
The US dollar has lost ground, Treasury yields have fallen sharply, and the market is now pricing in a 90% rate cut as early as September.
FOREX Impact:
USD weak across all major crosses (EUR/USD, GBP/USD, AUD/USD).
Emerging currencies such as MXN, TRY, and INR could stabilize or gain against the USD.
JPY and CHF gain safe-haven appeal; USD/JPY and USD/CHF face possible reversals.
2. Return of $5 billion RBI swap, impact on Indian liquidity
RBI swap expiration of ₹43,000 cr (~$5 billion) scheduled for August 4: possible drain of liquidity from the Indian banking system.
FOREX Impact:
Potential downside pressure on the INR, volatility on USD/INR.
Monitor capital flows: USD/INR gains possible if trade roles remain balanced.
3. IMF Improves Forecasts but Beware of Tariff Risks
The IMF revised global growth for 2025 to 3.0%, but warns of persistent risks from high tariffs and geopolitical tensions.
FOREX Impact:
Commodity currencies (AUD, CAD, NZD) benefit from a moderately positive tone.
USD weak, but emerging markets vulnerable if growth weakens further.
4. 🇺🇸 Fed Maintains High Rates and Delays Cuts
The FOMC left Fed rates at 4.25–4.50%, adopting a wait-and-see approach. Internal disagreements on potential anticipated cuts.
FOREX Impact:
USD gains limited in the short term.
If Powell remains wait-and-see, the dollar will tend to remain weak or stagnant.
5. 📉 Correct Treasury rise and rate cut expectations
2-year bond yields -25 bps, pricing in 65–100 bps of cuts by the end of the year. Markets are losing confidence in jobs data, and the credibility of the BLS is being questioned.
FOREX Impact:
USD under pressure, especially on EUR/USD and GBP/USD.
Higher-yielding currencies such as AUD and NZD may gain carry trade flows.
6. 🌏 Asia-Pacific markets nervous on US pressure and strong yen
Asian stocks mixed: Nikkei -2%, MSCI Asia +0.3%. Strong yen penalizes Japanese exports.
FOREX Impact:
JPY strengthens, USD/JPY may compress below 150.
AUD/JPY and NZD/JPY are sensitive to risk-on/off flows into the JPY.
7. Rising country risk, emerging markets under stress
Experts recommend currency and sovereign hedging due to US volatility, impacting international portfolios.
Strengthening CHF, JPY, and possible weakness in less liquid thermal currencies.
Interest remains high in the USD compared to high-risk emerging currencies.
8. Key events expected: Jackson Hole Symposium (August 21–23)
Powell and other regulators expected to deliver a speech. No Fed/ECB meeting soon, increasing the importance of Jackson Hole as a catalyst.
FOREX Impact:
Potential flash volatility in the USD, EUR, and GBP following forward guidance.

#015: USD/CHF SHORT Investment OpportunityHello readers, I'm Forex Trader Andrea Russo, and today I'd like to share this SHORT investment opportunity I've identified in the USD/CHF pair.
In recent days, USD/CHF has exhibited typical technical exhaustion behavior near key dynamic resistance. The area between 0.81300 and 0.81650 represented a significant supply zone, previously tested with an extended spike and immediately rejected.
The price violated the 200 EMA with an apparent breakout, but without real institutional volume to support the move. This was followed by a rapid retracement below the mean and a sideways movement, suggesting ongoing manipulation and liquidity building.
Meanwhile, global retail sentiment shows a significant anomaly: over 70% of retail traders are long. This imbalance increases the likelihood that market makers are preparing a bearish reversal to target the most fragile positions and restore equilibrium.
The 0.81420 level has been identified as a key point for a possible price reversion to the manipulative zone before the actual directional move. If the price reverts to this level, a technical spike is likely to be executed to complete the hunt for stops before the downtrend begins.
The trade targets a decline towards the 0.80000 area, which represents the first significant level of technical support and a realistic target if the reversal is confirmed.

GBPJPY: More Growth is Coming! 🇬🇧🇯🇵
GBPJPY will likely bounce from a key daily support,
following a formation of a double bottom pattern
on an hourly time frame.
I think that the price will reach 196.7 level soon.
❤️Please, support my work with like, thank you!❤️
I am part of Trade Nation's Influencer program and receive a monthly fee for using their TradingView charts in my analysis.

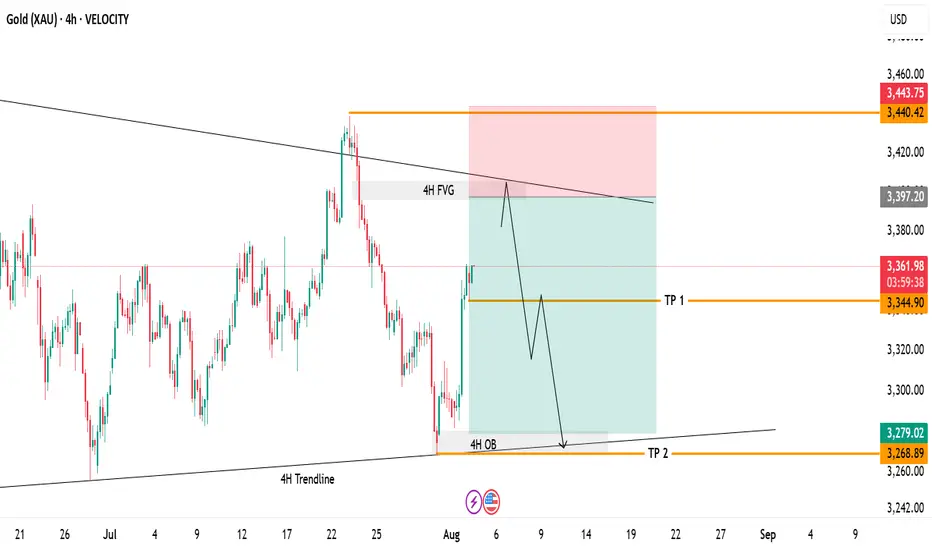
Gold 4H Swing Trade Setup!Currently watching price action as it approaches the 4H Fair Value Gap and descending trendline resistance. Price has not tapped this zone yet, and a move higher into this area could set up a potential reversal.
Setup Highlights:
4H FVG: 3,397–3,400 – Main area of interest.
Trendline Resistance: Confluence zone to watch for rejection.
Plan: Waiting for price to fill the imbalance and test the resistance before considering short entries.
Targets if Rejection Occurs:
TP1: 3,344 – First partial target.
TP2: 3,268 – 4H OB retest.
Invalidation:
A clear breakout and hold above 3,440 would invalidate the bearish scenario.