CADHF for next periods still bullish to expect
Hi viewers, CADCHF price is break zone, here now after todays CAD rate cut still bullish continuation in next periods expecting
TP1: 0.68750 (75)
TP2: 0.69200 (120)
Forexanalysis

EURNZD for next periods bearish cont. from here expecting to see
Hi viewers, EURNZD price break first zone, strong volumen showed, currently here bearish continuation for next periods to expect
TP1: 1.74300 (120)
TP2: 1.73600 (190)
TP3: 1.73000 (250)

EUR/USD expected reversal ✅Price formed new higher low and continued to go up. We can see now that price broke and retested previous high and I expect bullish continuation.

AUDUSD new bullish push to expect
Hi viewers, AUDSD price is break/bounce on zone, here now bullish continuation in next periods to expect
TP1: 0.68000 (90)
TP2: 0.68400 (130)
TP2: 0.68750 (165)

NZDUSD, H4 | Fibonacci confluence reversalWe're seeing big resistance at 0.6182 which is a pullback resistance + 50% Fibonacci retracement and a 61.8% Fiboancci retracement. A reversal from here could see prices drop to 0.6149 which is our intermediate support - breaking that level could see a further bearish acceleration down to 0.6119.
Please be advised that the information presented on TradingView is provided to FXCM (‘Company’, ‘we’) by a third-party provider (‘Name of third party provider). Please be reminded that you are solely responsible for the trading decisions on your account. There is a very high degree of risk involved in trading. Any information and/or content is intended entirely for research, educational and informational purposes only and does not constitute investment or consultation advice or investment strategy. The information is not tailored to the investment needs of any specific person and therefore does not involve a consideration of any of the investment objectives, financial situation or needs of any viewer that may receive it. Kindly also note that past performance is not a reliable indicator of future results. Actual results may differ materially from those anticipated in forward-looking or past performance statements. We assume no liability as to the accuracy or completeness of any of the information and/or content provided herein and the Company cannot be held responsible for any omission, mistake nor for any loss or damage including without limitation to any loss of profit which may arise from reliance on any information supplied by Name of third party provider.
The speaker(s) is neither an employee, agent nor representative of FXCM and is therefore acting independently. The opinions given are their own, constitute general market commentary, and do not constitute the opinion or advice of FXCM or any form of personal or investment advice. FXCM neither endorses nor guarantees offerings of third party speakers, nor is FXCM responsible for the content, veracity or opinions of third-party speakers, presenters or participants.
High Risk Investment Warning
Trading Forex/CFDs on margin carries a high level of risk and may not be suitable for all investors. Leverage can work against you.
Forex Capital Markets Limited (www.fxcm.com):
CFDs are complex instruments and come with a high risk of losing money rapidly due to leverage. 71% of retail investor accounts lose money when trading CFDs with this provider. You should consider whether you understand how CFDs work and whether you can afford to take the high risk of losing your money.
FXCM EU LTD (www.fxcm.com):
CFDs are complex instruments and come with a high risk of losing money rapidly due to leverage. 76% of retail investor accounts lose money when trading CFDs with this provider. You should consider whether you understand how CFDs work and whether you can afford to take the high risk of losing your money.
FXCM Australia Pty. Limited (www.fxcm.com): **
Trading FX/CFDs carries significant risks. FXCM AU (AFSL 309763), please read the Financial Services Guide, Product Disclosure Statement, Target Market Determination and Terms of Business at www.fxcm.com
FXCM Markets LLC (www.fxcm.com):
Losses can exceed deposits.

BluetonaFX - GBPUSD Triangle FormationHi Traders!
There is a symmetrical triangle formation here on the GBPUSD 1D chart, and we are awaiting a breakout on either side.
There is strong resistance at the 1.26800 level; there must be a break and close above this level for a possible continuation to 1.27000.
To the downside, we have strong support at the 1.22746 level, and we must break below this level for a possible continuation down to 1.22000.
This trading week will be very busy with all of the upcoming fundamental announcements, and there are bound to be big market moves, so make sure you trade safely and responsibly.
Please do not forget to support us by liking, following, and commenting on our posts; this helps us greatly.
Thank you for your support.
BluetonaFX

EurGbp could rise back to resistanceAfter Friday's break under the recent low, EurGbp reversed yesterday leaving a strong bullish engulfing on our daily chart exactly in 0.8550 zone support.
This bullish engulfing could be an indication that more gains are coming and the target for bulls could be 0.8720 resistance.
In the case of a new low, this outlook is negated.

GoldViewFX - MARKET UPDATE
Hey Everyone,
Great start to the week with our Bullish target at 1966 HIT as stated yesterday. Price then failed to break and close above 1966 weighted level, which then followed with the rejection. Perfect EXIT!! We are now seeing price head into the support structure and now seeing another bounce up.
There is room for more movement down to complete the retracement range. We need to keep this in mind when planning entries. We will continue to see price play between these structures until one of the weighted level crosses and locks with ema5 to open the new range.
We will need to see EMA5 cross and lock above 1966 to open the upper bullish levels to complete the previous gap at 1979. We expect a volatile week ahead with lots of high volatility news and events during the week.
We will continue with our plans to buy dips and track the movement level to level.
Our long term projection still remains Bullish.
BULLISH TARGETS
1966 - DONE
EMA5 CROSS AND LOCK ABOVE 1966 WILL OPEN 1979
BEARISH TARGETS
1957
1947
1937
EMA5 CROSS AND LOCK BELOW 1937 WILL OPEN THE SWING RANGE
SWING RANGE
1918 - 1904
As always, we will keep you all updated with regular updates throughout the week and how we manage the active ideas and setups. Please don't forget to like, comment and follow to support us, we really appreciate it!
GoldViewFX
XAUUSD TOP AUTHOR

USDCHF for next days bullish push expecting
Hi viewers, USDCHF price currently on zone, here break expecting and short bullish push for next days
TP1: 0.91550 (55)
TP2: 0.91900 (90)

BluetonaFX - EURUSD KEY LEVELSHi Traders!
Please see our new levels for EURUSD below.
Vector Level: 1.08047
Vector Level: 1.09298
Anchor Level: 1.04833
Apex Level: 1.10956
The recent price action on the 1D chart is telling us that EURUSD is looking for a direction to continue in. We have been stuck in a range (highlighted on the chart) for the past two weeks or so, and key decisions and announcements this week from the ECB and the Federal Reserve will most likely take us in a certain direction.
To the upside, if there is any USD weakness or EUR strength, our first vector level is at 1.08047; we have not been above this level for almost a month. If the market breaks and closes above this level, then we have the next vector level at 1.09298 and then our apex level at 1.10956.
If there is EUR weakness or USD strength and we stay below 1.08047, then it is very likely that we will target our anchor level of 1.04833. This anchor level is a very important level, as we have not been below it this year.
This trading week will be very busy with all of the upcoming fundamental announcements, and there are bound to be big market moves, so make sure you trade safely and responsibly.
Please do not forget to support us by liking, following, and commenting on our posts; this helps us greatly.
Thank you for your support.
BluetonaFX

AUDJPY new bullish push expected
Hi viewers, AUDJPY price currently on zone, here break expecting to see and higher bullish continauton in next periods
TP1: 94.200 (70)
TP2: 94.600 (110)
TP3: 95.000 (150)

GoldViewFX - 1H CHART UPDATED LEVELS & TARGETSHey Everyone,
Please see our 1H chart with updated levels and targets.
Price has broken out of the descending channel and found support on the channel top for the break out. We are now seeing price range sideways, right in the middle of both support and resistance structure. All MA's are also converging together gearing up for a breakout. The retracement structure has been holding well as support providing a nice bounce up every time, working inline with our plans to buy dips.
We remain Bullish with our next Bullish target at 1966. We will need to see EMA5 cross and lock above 1966 to open the upper bullish levels to complete the previous gap at 1979. We expect a volatile week ahead with lots of high volatility news and events during the week. The retracement range is measured accordingly to support any swings. Unless we see EMA5 lock below the retracement range this structure should hold well. A break below the retracement range and we are likely to see the swing range open up.
We will manage the range and swings accordingly using our EMA5 cross and lock to navigate level to level.
We will continue with our plans to buy dips and track the movement level to level.
Our long term projection still remains Bullish.
BULLISH TARGETS
1966
EMA5 CROSS AND LOCK ABOVE 1966 WILL OPEN 1979
BEARISH TARGETS
1957
1947
1937
EMA5 CROSS AND LOCK BELOW 1937 WILL OPEN THE SWING RANGE
SWING RANGE
1918 - 1904
As always, we will keep you all updated with regular updates throughout the week and how we manage the active ideas and setups. Please don't forget to like, comment and follow to support us, we really appreciate it!
GoldViewFX
XAUUSD TOP AUTHOR

GoldViewFX - 4H CHART UPDATED LEVELS & TARGETSHey Everyone,
Please see our 4H chart with updated levels and targets.
Price has broken out of the channel and looking for a retest on the channel top. Support here and we are likely to see a push up to hit 1982. We will need ema5 cross and lock above 1963 to solidify this target.
We are likely to expect big swings next week due to high volatile news releases during the week. Any swings down will likely test the retracement range, also inline with the channel half-line.
A break below the retracement range will open the swing range also, inline with the channel bottom.
We will manage the range and swings accordingly using our EMA5 cross and lock to navigate level to level.
We will continue with our plans to buy dips and track the movement level to level.
Our long term projection still remains Bullish.
BULLISH TARGETS
1963
EMA5 CROSS AND LOCK ABOVE 1963 WILL OPEN
1982
BEARISH TARGETS
1942
EMA5 CROSS AND LOCK BELOW 1942 WILL OPEN THE SWING RANGE
SWING RANGE
1918 - 1899
As always, we will keep you all updated with regular updates throughout the week and how we manage the active ideas and setups. Please don't forget to like, comment and follow to support us, we really appreciate it!
GoldViewFX
XAUUSD TOP AUTHOR

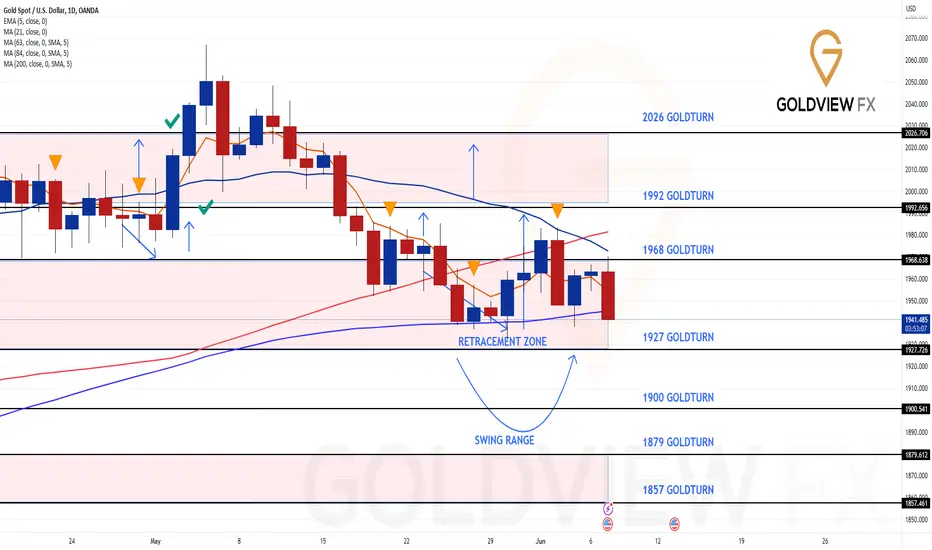
GoldViewFX - DAILY CHART UPDATEHey Everyone,
Please see our updated daily chart idea. Price has been testing the retracement zone support structure once again.
We have a candle body close above 1968 opening a longer range gap above at 1992. As long as price remains supported above the retracement range, we can continue to buy dips in this range. A break below the retracement range will open the lower range and therefore we will adapt our risk to manage the range below when extending the dip range to buy from.
As always, we will keep you all updated with regular updates throughout the week and how we manage the active ideas and setups. Please don't forget to like, comment and follow to support us, we really appreciate it!
GoldViewFX
XAUUSD TOP AUTHOR
LAST UPDATE ON THIS CHART
Hey Everyone,
We had another piptastic day today catching the move up from support for a perfect exit at 1968 resistance level before the drop.
Price is now heading back to the retracement range and as long as this retracement level holds, we should see another push to the upside to test the resistance structure. We are likely to see bounces between support structure to resistance structure until one breaks. A break below the retracement range and we will look for a deeper move down into the swing range.
We are buying dips from support levels using our smaller timeframe chart ideas and taking early exits using our Goldturns before any swings like today.
As always, we will keep you all updated with regular updates throughout the week and how we manage the active ideas and setups. Please don't forget to like, comment and follow to support us, we really appreciate it!
GoldViewFX
XAUUSD TOP AUTHOR

GoldViewFX - WEEKLY CHART UPDATEHey Everyone,
Please see update on our weekly chart idea. Playing out as projected with another retest on the retracement range, which has held well so far with a nice Bullish candle finish last week. If we finish with another Bullish candle this coming week, we will have a new Goldturn support created, making another Axis trendline test above likely.
We will track the movement level to level on the smaller timeframes inline with our plans to buy dips. Using the right entries and exits is crucial to even buy in a bearish market effectively.
As always, we will keep you all updated with regular updates throughout the week and how we manage the active ideas and setups. Please don't forget to like, comment and follow to support us, we really appreciate it!
GoldViewFX
XAUUSD TOP AUTHOR
LAST UDPATE
Hey Everyone,
This is our weekly chart mid to long term projections we have been tracking for a while now. We saw the rejection at the axis trendline with ema5 failing to break the trendline creating a new resistance Goldturn at 1999.
We stated last week that overall our weekly chart idea shows the target level for this drop into the retracement range, which played out perfectly. We are now looking for this retracement range to hold, as support for another push up.
This retracement area on the weekly chart is a crucial test at support structure. A break below this level and the range will be opened up to include the swing range into the 1858 range.
We will stick with our long term trend buying dips but manage swings for entries on the mid term bearish trend.
We will use our multi timeframe analysis to navigate the range up and down and pick our sweet entries and exits in between.
PREVIOUS WEEKLY UPDATE
Price is now sitting below the axis trendline and also a new Goldturn has formed below the axis trendline making this chart Bearish. We already saw price head towards the retracement range last week with room still left for more - THIS PLAYED OUT EXACTLY HOW WE SAID ON SUNDAY
As always, we will keep you all updated with regular updates throughout the week and how we manage the active ideas and setups. Please don't forget to like, comment and follow to support us, we really appreciate it!
GoldViewFX
XAUUSD TOP AUTHOR

GoldViewFX - MARKET UPDATEHey Everyone,
And we finish off another great week of collecting positive pips buying dips, as per our long term trend target. We used our smaller timeframe chart ideas to navigate the week.
As you can see from the last updates below, this week we completed the small detachment that was due completing the retracement. This provided the dynamic support needed for the push up, which we captured buying dips on the smaller timeframe ideas.
We will now come back Sunday with our multi timeframe analysis and trading plans and ideas for the coming week.
Hope you all have a great weekend with family and loved ones.
GoldViewFX
XAUUSD TOP AUTHOR
LAST UPDATE
Please see update on the monthly chart idea that we have been tracking. We now have a new candle for the month with a small ema5 detachment below highlighted with the circle also inline with the channel half line support. Chart look bearish short term with a long term bullish outlook, as both bearish target (detachment and channel half-line) areas have potential for a nice bounce up.
We will continue to monitor and track this chart.
LAST UPDATE
Our long term projection on the monthly chart looks Bullish with ema5 cross above 1878 Goldturn opening the range above. Price and ema5 is also sitting above the channel half line further supporting the bullish structure. However, start of the month had a big detachment below opening room for retracement below, highlighted by the blue circle. This detachment is now nearly complete and only a small gap left, which is not worth chasing but just to keep in mind when managing swings on the smaller timeframes.
Our plans long term to buy dips is still in play and we will continue to use the smaller timeframes to track and trade the range level to level.
As always, we will keep you all updated with regular updates throughout the week and how we manage the active ideas and setups. Please don't forget to like, comment and follow to support us, we really appreciate it!
GoldViewFX
XAUUSD TOP AUTHOR

EURUSD 05/06/2023 TRADING LEVELS UPDATEHi Traders,
PLEASE SEE LINK TO ORIGINAL IDEA BELOW.
Rounding off the week with an update to our forecasted EURUSD levels on the 1D chart. After the bounce from the 78.6% Fibonacci support level, there was a bullish push upwards (highlighted on the chart) and we have now pulled back near our forecasted Vector Resistance 1 level at 1.08047.
The trading range on EURUSD was quite small this week as we have traders waiting for both the ECB & Federal Reserve interest rate decision announcement next week.
We will continue to analyse the markets and will have new levels for you for the upcoming trading week.
Please do not forget to like, comment and follow.
Thank you for your support.
BluetonaFX

USDCAD, H4 | Could we see a bounce?Price is testing a major support level at 1.3319 which is a triple swing low support and also a trend line support. A bounce from here could see prices being nudged up to the 1.3400 level which is an overlap resistance and a 23.6% Fibonacci retracement.
Please be advised that the information presented on TradingView is provided to FXCM (‘Company’, ‘we’) by a third-party provider (‘Name of third party provider). Please be reminded that you are solely responsible for the trading decisions on your account. There is a very high degree of risk involved in trading. Any information and/or content is intended entirely for research, educational and informational purposes only and does not constitute investment or consultation advice or investment strategy. The information is not tailored to the investment needs of any specific person and therefore does not involve a consideration of any of the investment objectives, financial situation or needs of any viewer that may receive it. Kindly also note that past performance is not a reliable indicator of future results. Actual results may differ materially from those anticipated in forward-looking or past performance statements. We assume no liability as to the accuracy or completeness of any of the information and/or content provided herein and the Company cannot be held responsible for any omission, mistake nor for any loss or damage including without limitation to any loss of profit which may arise from reliance on any information supplied by Name of third party provider.
The speaker(s) is neither an employee, agent nor representative of FXCM and is therefore acting independently. The opinions given are their own, constitute general market commentary, and do not constitute the opinion or advice of FXCM or any form of personal or investment advice. FXCM neither endorses nor guarantees offerings of third party speakers, nor is FXCM responsible for the content, veracity or opinions of third-party speakers, presenters or participants.
High Risk Investment Warning
Trading Forex/CFDs on margin carries a high level of risk and may not be suitable for all investors. Leverage can work against you.
Forex Capital Markets Limited (www.fxcm.com):
CFDs are complex instruments and come with a high risk of losing money rapidly due to leverage. 71% of retail investor accounts lose money when trading CFDs with this provider. You should consider whether you understand how CFDs work and whether you can afford to take the high risk of losing your money.
FXCM EU LTD (www.fxcm.com):
CFDs are complex instruments and come with a high risk of losing money rapidly due to leverage. 76% of retail investor accounts lose money when trading CFDs with this provider. You should consider whether you understand how CFDs work and whether you can afford to take the high risk of losing your money.
FXCM Australia Pty. Limited (www.fxcm.com): **
Trading FX/CFDs carries significant risks. FXCM AU (AFSL 309763), please read the Financial Services Guide, Product Disclosure Statement, Target Market Determination and Terms of Business at www.fxcm.com
FXCM Markets LLC (www.fxcm.com):
Losses can exceed deposits.

GBPUSD, H4 | Potential Bearish Reversal?GBPUSD is seeing major resistance at the 1.2577 level which is an overlap, 100% projection and is seeing bearish divergence vs price. A reversal from here could see prices being pushed all the way down to 1.2477.
Please be advised that the information presented on TradingView is provided to FXCM (‘Company’, ‘we’) by a third-party provider (‘Name of third party provider). Please be reminded that you are solely responsible for the trading decisions on your account. There is a very high degree of risk involved in trading. Any information and/or content is intended entirely for research, educational and informational purposes only and does not constitute investment or consultation advice or investment strategy. The information is not tailored to the investment needs of any specific person and therefore does not involve a consideration of any of the investment objectives, financial situation or needs of any viewer that may receive it. Kindly also note that past performance is not a reliable indicator of future results. Actual results may differ materially from those anticipated in forward-looking or past performance statements. We assume no liability as to the accuracy or completeness of any of the information and/or content provided herein and the Company cannot be held responsible for any omission, mistake nor for any loss or damage including without limitation to any loss of profit which may arise from reliance on any information supplied by Name of third party provider.
The speaker(s) is neither an employee, agent nor representative of FXCM and is therefore acting independently. The opinions given are their own, constitute general market commentary, and do not constitute the opinion or advice of FXCM or any form of personal or investment advice. FXCM neither endorses nor guarantees offerings of third party speakers, nor is FXCM responsible for the content, veracity or opinions of third-party speakers, presenters or participants.
High Risk Investment Warning
Trading Forex/CFDs on margin carries a high level of risk and may not be suitable for all investors. Leverage can work against you.
Forex Capital Markets Limited (www.fxcm.com):
CFDs are complex instruments and come with a high risk of losing money rapidly due to leverage. 71% of retail investor accounts lose money when trading CFDs with this provider. You should consider whether you understand how CFDs work and whether you can afford to take the high risk of losing your money.
FXCM EU LTD (www.fxcm.com):
CFDs are complex instruments and come with a high risk of losing money rapidly due to leverage. 76% of retail investor accounts lose money when trading CFDs with this provider. You should consider whether you understand how CFDs work and whether you can afford to take the high risk of losing your money.
FXCM Australia Pty. Limited (www.fxcm.com): **
Trading FX/CFDs carries significant risks. FXCM AU (AFSL 309763), please read the Financial Services Guide, Product Disclosure Statement, Target Market Determination and Terms of Business at www.fxcm.com
FXCM Markets LLC (www.fxcm.com):
Losses can exceed deposits.

GoldViewFX - MARKET UPDATEHey Everyone,
Our chart idea and levels have been respected perfectly with our retracement range holding once again and supporting the price again for a nice push up today. We caught the move inline with our plans to buy dips for a nice finish back to benchmark move.
EMA5 has also broken the weighted level leaving a gap to 1979. As always we only take entries from dips using our levels and don't chase targets from the top.
We will continue with our plans to buy dips and track the movement level to level.
Our long term projection still remains Bullish.
BULLISH TARGETS
1952 - DONE
1963 - DONE
EMA5 CROSS AND LOCK ABOVE 1963 WILL OPEN 1979
19798 -
BEARISH TARGETS
1937 - DONE
EMA5 CROSS AND LOCK BELOW 1941 WILL OPEN THE SWING RANGE
SWING RANGE
1918 - 1895
As always, we will keep you all updated with regular updates throughout the week and how we manage the active ideas and setups. Please don't forget to like, comment and follow to support us, we really appreciate it!
GoldViewFX
XAUUSD TOP AUTHOR

GoldViewFX - DAILY CHART UPDATEHey Everyone,
We had another piptastic day today catching the move up from support for a perfect exit at 1968 resistance level before the drop.
Price is now heading back to the retracement range and as long as this retracement level holds, we should see another push to the upside to test the resistance structure. We are likely to see bounces between support structure to resistance structure until one breaks. A break below the retracement range and we will look for a deeper move down into the swing range.
We are buying dips from support levels using our smaller timeframe chart ideas and taking early exits using our Goldturns before any swings like today.
As always, we will keep you all updated with regular updates throughout the week and how we manage the active ideas and setups. Please don't forget to like, comment and follow to support us, we really appreciate it!
GoldViewFX
XAUUSD TOP AUTHOR
GOLD is still consolidatingPrice is still moving between our significant zone and support zone. It is currently consolidating and moves are very slow. I advise you to wait for a breakout.

GoldViewFX - MARKET UPDATEHey Everyone,
Another great day on the charts today with our final bullish target hit at 1963.
1963 is a weighted Goldturn level and therefore will need a EMA5 cross and close above this level to open remaining targets above. Failure to cross and lock and we are likely to see another support re-test below.
We will continue with our plans to buy dips and track the movement level to level.
Our long term projection still remains Bullish.
BULLISH TARGETS
1952 - DONE
1963 - DONE
EMA5 CROSS AND LOCK ABOVE 1963 WILL OPEN 1979
BEARISH TARGETS
1937 - DONE
EMA5 CROSS AND LOCK BELOW 1941 WILL OPEN THE SWING RANGE
SWING RANGE
1918 - 1895
As always, we will keep you all updated with regular updates throughout the week and how we manage the active ideas and setups. Please don't forget to like, comment and follow to support us, we really appreciate it!
GoldViewFX
XAUUSD TOP AUTHOR
