EURJPY CHART ANALYSIS POSTED ON SUNDAY 01 JANUARY 2023EURJPY CHART ANALYSIS !!!
HAPPY NEW YEAR TO YOU ALL!!!
LET'S START NEW YEAR JOURNEY.
Make sure you do your research and based on your confluence please look for the entry.
Trade safe use proper risk management always.
Forexanalysis

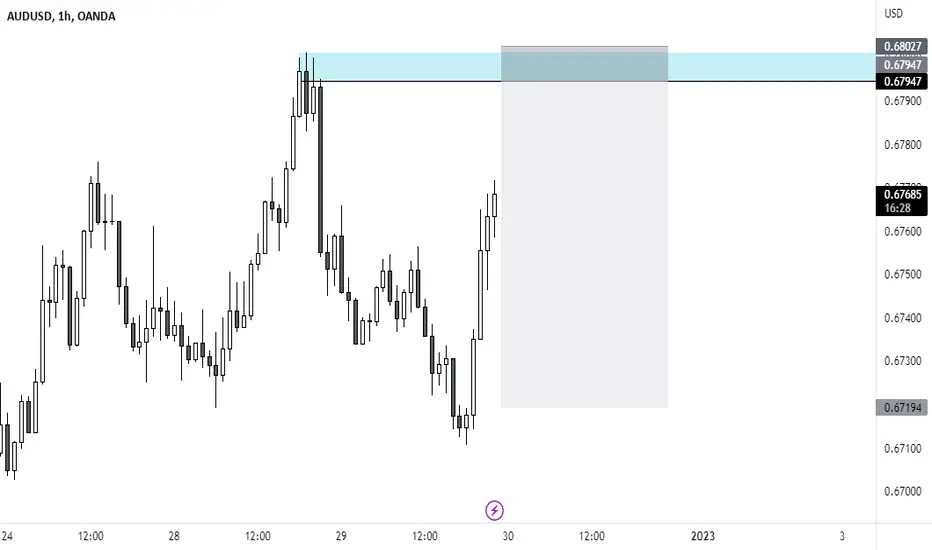
💵Australian Dollar/U.S.Dollar💵 Analyze (01/02/2023)!!!Australian Dollar/U.S.Dollar is making a rising wedge pattern near the resistance zone.
When I saw the hanging man candlestick pattern near the upper line of the rising wedge (also some other tips), I opened a short position with RR=2.00 & 5.68.
I expect the Australian Dollar/U.S.Dollar will go down at least to the lower line of the rising wedge pattern (RR=2.00).
🔅Australian Dollar/U.S.Dollar Analyze ( AUDUSD ) Timeframe 4H⏰.
Do not forget to put Stop loss for your positions (For every position you want to open).
Please follow your strategy, this is just my idea, and I will be glad to see your ideas in this post.
Please do not forget the ✅' like '✅ button 🙏😊 & Share it with your friends; thanks, and Trade safe.

GoldViewFX - HEAD AND SHOULDERS PATTERNREPOST ON CHART PATTERNS.
Hey Everyone,
In 2023 we plan to also make more time to post basic educational posts for our newbies learn and level up.
HEAD AND SHOULDERS PATTERN
The head and shoulders pattern is a formation of 3 peaks with the head being the highest peak (Lowest on inverse). The entry should be below the neckline (Above on inverse). The measure of take profit can be taken by measuring the peak of the head from neckline and using this range, as an indicator of the take profit level.
Please do give us a like, comment and follow to support us.
GoldViewFX
XAUUSD TOP AUTHOR

audjpyaudjpy
A suitable trading opportunity can be seen in Time Daily in the medium term in this currency week.

BASIC MONEY MANAGEMENT - LOT SIZE VS REVERSAL AND ACCOUNT SIZEHey Everyone,
We see too many new traders trade with random lot sizes with no understanding on the impact it has on account sizes, which result in not only losses but BLOWN accounts. This post is by no means a risk or money management strategy but more so just basics on the movement of reversals and how the lot sizes impact the value of your account during this reversal.
Trading with the right lot sizes allows a trader to manage their account/money when the trade goes against them. The right size allows a trader to move a range without blowing their account and without seeing their account reverse to the point of no equity. This type of trading gives traders anxiety and in return this anxiety impacts trading psychology . This then has a ripple effect and impacts your trading decisions and analysis.
The example we show on the chart is an entry of SELL that reverses by 380 PIPs. This movement happened in literally 2 candles (1hour candles) , so in two hours the price from entry reversed by 380 pips. This example then shows what this equates to in monetary value dependent on lot sizes.
The example shows that anyone with a £500 account trading this movement with a lot size of 0.20 would have blown their account.
Lot size usage should be based on the size of your account for example;
£500 size account - we will only use 0.01 size lot sizes with maximum deployed total no more than 0.02. This will allow an account to survive volatile movements.
£1000 size account - we will use 0.02 lot sizes with maximum deployed total no more then 0.05 any given time.
£2000 size account - we will use 0.03 lot sizes with maximum deployed total no more then 0.10 any given time.
£5000 size account - we will use 0.5 sizes with maximum deployed total no more then 0.20 any given time.
Basically staying below 0.05 for every £1000, as the total deployed usage allows us enough flexibility of movement on the chart for Gold and then using stop losses on top of this, gives us further control of our money management.
Many traders who cannot control their greed and do not bother understanding risk/money management will bung on a 0.50 lot size on a 2K GBP account, as an example, and then when it reverses, even if it's within the swing range, you know what will happen next. ACCOUNT BLOWN! MIND BLOWN!
You will have mastered the art of risk/money management when your entry reverses and you a) expected that reversal within the range before it resumes to hit the TP and b) you look at that red figure during reversal without it worrying you in the least.
We hope this quick basic insight helps some of our newbies better understand how to manage their risk with range.
Please like, comment and follow to support our work, we really appreciate it!
GoldViewFX
XAUUSD TOP AUTHOR

USDJPY | Detail Analysis | DecryptersHi people Welcome to team Decrypters
We are expecting short term bounce from usd jpy and than big fall

Gold Detail Analysis | XAUUSD ForecastHi people Greetings & Welcome to Decrypters
Gold making bullish flag in 1 Month & if Gold break out We can see 2500 level

GoldViewFX - MONTHLY CHART LONG TERM GOLD OUTLOOKHey Everyone,
We have been tracking this monthly chart since OCTOBER 16TH.
As you can see this is playing out as analysed by us for our long-term plans for Gold . MA50 provided the dynamic support for the push up with more than half the targets already done and, as you can see from our projected bars, this is playing out, as analysed and planned.
There is a EMA5 detachment on this chart, which has moved up from 1750 to 1760. We need to keep in mind for a potential retracement zone when planning buys from dips on our smaller time frames. 1865 is our mid to long-term projection on the monthly chart and our projected BARS that we drew on this chart 3 months ago is following the route like we projected.
Using our smaller timeframes allows us to measure the momentum for the levels and range using our Goldturns. This measurement allows us to pick the sweet entries and exits to manage any range swings.
As always, we will keep you all updated with regular updates throughout the week and how we manage the setups. Please don't forget to like, comment and follow to support us, we really appreciate it!
GoldViewFX
XAUUSD TOP AUTHOR

GBPUSD CHART ANALYSIS POSTED ON SUNDAY 01 JANUARY 2023GBPUSD CHART ANALYSIS !!!
HAPPY NEW YEAR TO YOU ALL!!!
LET'S START NEW YEAR JOURNEY.
Let's see how this pair will perform based on the analysis.
Make sure you do your research and based on your confluence please look for the entry.
Trade safe use proper risk management always.

BULLISH ON EURCAD. SWING TRADEEntry: 1.4455
TP 1.4665
SL 1.4380
Vice-President of the European Central Bank Luis de Guindos stated that he believes the actions taken by the ECB so far has not been sufficient. ECB policymaker, Peter Kazimir pointed our that restrictive rates and strong action are necessary and should be in place for a longer period. At least in the first half of 2023. Also said that any recession resulting from this plan will be short and manageable. The current sentiment is mixed. As increasing rates for the euro may contribute to the recent uptrend, but it is uncertain whether markets are completely pricing in the hawkish tone

GoldViewFX - Market UPDATEHey Everyone,
And we close off the year on a high, we've had quite the booming year in 2022 here at GVFX. To have an industry-leading hit rate for winning trade ideas and ROI for the accounts that we personally trade, whilst sharing that success with novice traders and followers. What a fantastic finish to the year for us.
All our chart ideas for this week once again have played out according to our analysis. This chart was updated yesterday for today and once again we had a nice push up into our highlighted target area. BOOOM!
We will now come back on Monday with our multi timeframe analysis and trading plan for the coming week. We have some exciting developments for 2023 and wish everyone a successful trading journey in the new year regardless of whether you are part of the GVFX team or not
BULLISH TARGETS
1802 - DONE
1807 - DONE
EMA5 CROSS AND LOCK ABOVE 1807 WILL OPEN 1817, 1822 and 1828 - DONE
Please don't forget to like, comment and follow to support us, we really appreciate it!
GoldViewFX
XAUUSD TOP AUTHOR

GoldViewFX - How to draw support and resistance levelsHey Everyone,
This is a repost for our newbies.
As promised alongside our analysis and reports we will also be posting basic educational posts to help newbies. Today we show you how to draw support and resistance levels the GoldViewFX way.
There are so many ways to draw and establish support and resistance levels. Typically this is an area where price stabilizes and fails to break providing support or resistance to price. Visually this can be represented by drawing a line to identify those areas. This can be drawn and identified in different ways. The 3 ways we draw support and resistance levels are as follows;
Firstly we identify where price is stabilized, this is likely to show a collection of candles side by side or by a candle or wick touch to a price and then a big retracement.
1 - We draw a line on the top or bottom of the candle body close of an area that price fails to break. Typically the highest or lowest wick from the collection of candles.
2 - We draw a line on the top or bottom of the candle body close of an area price fails to break. Typically the highest candle from the collection of candles.
3 - We identify the turning point of our moving average line (EMA5 IN OUR CASE). We then draw a line on the top or bottom of this turn (This is unique to us, so don't forget if you see it anywhere else).
Please don't forget to like, comment and follow to support us, we really appreciate it!
GoldViewFX
XAUUSD TOP AUTHOR

GoldViewFX - Market UPDATEHey Everyone,
As you can see once again our updated idea posted yesterday has once again HIT perfectly as shown by the arrows.
Price is still within the range and with the upper level structure open once again for a challenge at 1822 and 1828.
However, We will continue to buy from support levels and not chase the upper structure without support tests, like we have been, to protect us from swings and provide safe entries. Taking extra caution now due to month and year end potential profit taking...
If we see the channel bottom broken with a EMA5 cross and lock below 1793 then we will potentially see the full swing range. Failure to break below the channel floor and 1793 Goldturn support and we should see price head back up to test the channel top.
BULLISH TARGETS
1802 - DONE
1807 - DONE
EMA5 CROSS AND LOCK ABOVE 1807 WILL OPEN 1817, 1822 and 1828 - DONE
BEARISH TARGETS
1793
EMA5 CROSS AND LOCK BELOW 1793 WILL OPEN 1785, 1779 and 1772
SWING RANGE
1772 - 1779
As always, we will keep you all updated with regular updates throughout the week and how we manage the setups. Volumes will be small over the holidays, but rest assured we will have eyes on the charts with updates throughout. Please don't forget to like, comment and follow to support us, we really appreciate it!
GoldViewFX
XAUUSD TOP AUTHOR

AUDUSD shortAUDUSD seems to follow the monthly direction as its the end of the quarter closes,
With that being said we look here for a sell based on the Daily candle wick fill.
Setup looks nice with good r:R,worth a shot!
Nzdusd Short IdeaThe price has broken its support range and put a pullback in that range, we are expected to fall from this range

AUDUSD | Watching for a reversal The price on AUDUSD fell to new lows Tuesday, December 20, 2022. If this is a true price reversal, price can potentially stay below 0.68921 and decline back down to 0.66281. What will invalidate this analysis is if price pushes back past the high price of 0.68921.
If this analysis does not work out
The invalidation of the analysis can lead us back up to true weekly timeframe to analyze the true bearish trend of AUDUSD. However, we are not there so following the current trend on the daily is more valid.
This is a beautiful 2.15 risk to reward trade. It’s worth the look.
I’d love to read your thoughts on this pair. Also, thanks for the likes and support!

BUYING DIPS/SELLING TOPS - KEEPING A CLEAN PSYCHOLOGICAL PROFILEHey Everyone,
Here at GVFX, we are currently buying dips. What that means is that we buy on the dips and therefore only concentrate on long positions/buys with the odd sells for fun. As mentioned before, having both sell and buy positions open in your account will affect your psychology and in turn, your trading decisions.
Now a question that typically arises here is why would it still be advisable to buy when the market is pushing down? Firstly, let me assure you that the same algorithms, experience and strategies that we use to achieve a 97% hit rate with our bullish directional bias also gives us the heads up, or down if you will, on when the market is going down. Don't think for a moment that we only know how to analyse a bull market or up trends. We share targets/signals for both buys and sells but choose not to hedge out of choice. Our published results remain consistently profitable month in month out!!
In my experience, in the current market conditions, it is much safer to get out of a stuck buy position than a stuck sell position. That's not to mention the clean PSYCHOLOGICAL PROFILE that is achieved when trading in just one direction. And although hedging can in theory work, it requires years of experience and in the end, is simply not worth the effort. I am more than capable of hedging effectively but the fact that I do not should tell you something.
Let us look at an example to further answer the question highlighted above. When you have short-term bearish momentum down, we take buys from key supports or MAs which act as dips. Remember that the market does not go up or down in a straight line (with the rare exception of short-lived parabolic moves). So, when the market is going down and hits one of our key levels, a buy from that point will go back up for 20 to 30 or 30 to 40 pips (this number of pips has been calibrated based on back testing) before resuming back down.
You can think of it like this. The market moves in a zigzag manner. The zig is that part of the leg which is going down to create lower lows (if the downward trend is continuing). The zag is that part of the leg which takes a breather and pushes back up with momentum for our entry and quick pip-take range to create a lower high (if the downward trend is continuing) before heading back down again. We catch the right and safest waves (buys) in and out and surf to success. When price hits a key structural support or stops creating lower lows and lower highs, we then reassess for entries with a wider range of pip capture.
Hope this post helps our followers to understand how we keep our psychology strong!!
GoldViewFX
XAUUSD TOP AUTHOR

GoldViewFX - Market UPDATEHey Everyone,
As you can see our 4H chart idea has been playing out well with Bullish targets now all Hit, including our extended targets we shared yesterday to 1822 and 1828 - BOOOM!
Price retraced down and found support at our channel floor, where we confidently took our long position for a perfect exit at 1809 confirmed with our algo.
Price is now back in the range and therefore our chart idea is now back in play to track and trade using EMA5 cross and lock, as we continue to buy dips from support levels.
If we see the channel bottom broken with a EMA5 cross and lock below 1793 then we will potentially see the full swing range open. Failure to break below the channel floor and 1793 Goldturn support and we should see price head back up to test the channel top.
BULLISH TARGETS
1802 - DONE
1807 - DONE
EMA5 CROSS AND LOCK ABOVE 1807 WILL OPEN 1817, 1822 and 1828 - DONE
BEARISH TARGETS
1793
EMA5 CROSS AND LOCK BELOW 1793 WILL OPEN 1785, 1779 and 1772
SWING RANGE
1772 - 1779
As always, we will keep you all updated with regular updates throughout the week and how we manage the setups. Volumes will be small over the holidays, but rest assured we will have eyes on the charts with updates throughout. Please don't forget to like, comment and follow to support us, we really appreciate it!
GoldViewFX
XAUUSD TOP AUTHOR

GBPCAD AnalysisI just follow the structure in the current timeframe
and i draw crucial area to limit myself
goodluck!

GoldViewFX - Market UPDATEHey Everyone,
Our 4H chart setup is also playing out perfectly with 1802 and 1807n now HIT completing the setup.
We are now looking for EMA5 to cross and lock above 1707 on this chart to confirm 1817, 1822 and 1828. Although 1807 has locked on the 1H chart it will strengthen the direction further by also locking on the 4H chart by extending the targets to 1822 and 1828
If we see the channel bottom broken with a EMA5 cross and lock below 1793 and we will potentially see the full swing range open. Failure to break below the channel floor and 1793 Goldturn support and we should see price head back up to test the channel top.
BULLISH TARGETS
1802 - DONE
1807 - DONE
EMA5 CROSS AND LOCK ABOVE 1807 WILL OPEN 1817, 1822 and 1828
BEARISH TARGETS
1793
EMA5 CROSS AND LOCK BELOW 1793 WILL OPEN 1785, 1779 and 1772
SWING RANGE
1772 - 1779
As always, we will keep you all updated with regular updates throughout the week and how we manage the setups. Volumes will be small over the holidays, but rest assured we will have eyes on the charts with updates throughout. Please don't forget to like, comment and follow to support us, we really appreciate it!
GoldViewFX
XAUUSD TOP AUTHOR

GBPCHF Analysisit is very clear that the structure of the market is bear in the current time frame,
I took a sell entry there ( on "lower high" area ) and the limit of my profit area is at the support
My trade risk is 1 : 2
goodluck!

GoldViewFX - Market UPDATEHey Everyone,
As you can see both our targets, we highlighted on this idea are now complete. We trailed tis up from 1800 banking profits at 1807 and trailed to 1810.
Price closed last week testing 1798 Goldturn just below the MA200 moving average. We had a EMA5 cross and lock above 1795 last week above the structure opening 1803 and 1807. We saw 1803 HIT and rejected leaving 1807 still open. We need to keep this 1807 target in mind. - BOOOOOM THIS PLAYED OUT TO PERFECTION.
EMA5 has now crossed and locked above 1807 leaving 1814 and 1819 open.
We will track and trade this movement level to level keeping in mind when levels and structures are open with EMA5 to strategically place our entries, as we continue to buy from dips.
BULLISH TARGETS
1803 - DONE
1807 - DONE
EMA5 CROSS AND LOCK ABOVE 1807 WILL OPEN 1814 AND 1819
BEARISH TARGETS
1795
1791
1786
EMA5 CROSS AND LOCK BELOW 1786 WILL OPEN 1783, 1780, 1777
SWING RANGE 1773 -1777
As always, we will keep you all updated with regular updates throughout the week and how we manage the setups. Volumes will be small over the holidays, but rest assured we will have eyes on the charts with updates throughout. Please don't forget to like, comment and follow to support us, we really appreciate it!
GoldViewFX
XAUUSD TOP AUTHOR

GoldViewFX - BENEFITS OF USING SMALL LOTS TO MANAGE RANGESThe temptation of using bigger lot sizes is something all traders experience in some parts of their trading journey. Yes, the wins can be nice, but the losses can be even greater and damaging. The benefits outweigh every time!!!
MOVE BIG RANGE
We cannot emphasize enough the benefits of breaking down lot sizes to micro lots to learn how to move and manoeuvre the range in a volatile market. Using small lots allow you to do this.
MORE FLEXIBILITY
The flexibility to add to existing positions or get better entries is only possible when account is not over exposed. Smaller lots give you the flexibility to chop and change and add to positions, allowing you to move big ranges and making changes throughout the move.
POWER OVER FEAR
Bigger lots exposes our accounts, which makes decision making very hard due to fear of loss and blown accounts. Small lots allow you to control and manage fear throughout the process.
STRONG PSYCHOLOGY
Having power over your fears is the greatest feeder to a strong psychology for a traders mindset. Strong psychology allows a trader to build consistent performance and profits.
LIVE TO FIGHT ANOTHER DAY
The ability to get second chances is something everyone can appreciate in life. Smaller lots allow you to make mistakes and try again.
Hope some of our new traders find this information useful. Please don't forget to like, comment and follow to support our work. We really appreciate it!
GoldView
