USDCHF Technical Analysis – Potential Rejection from Resistance USDCHF Technical Analysis – Potential Rejection from Resistance
🔍 Chart Overview:
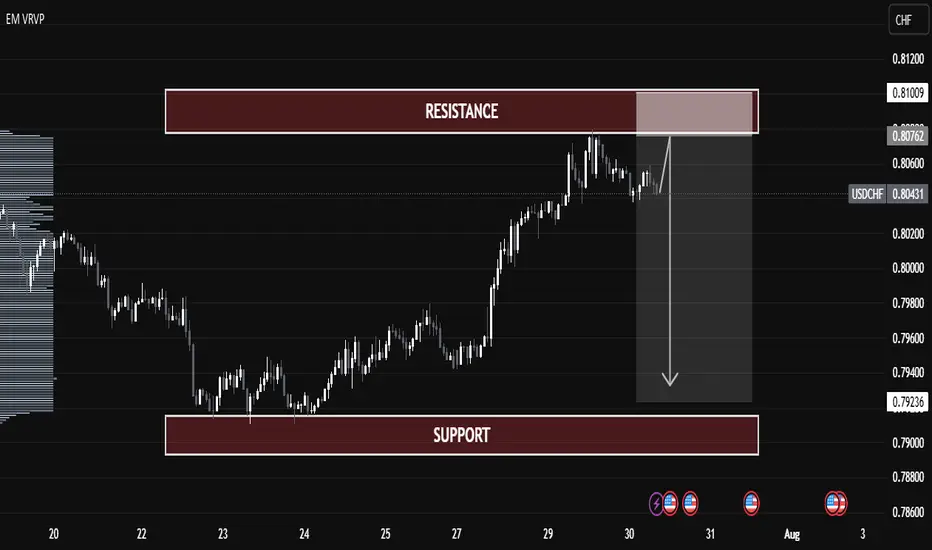
Current Price: 0.80456
Resistance Zone: 0.80760 – 0.81009
Support Zone: 0.79000 – 0.79236
Price Action: The pair has rallied into a strong resistance zone but is showing signs of exhaustion.
📌 Key Observations:
Volume Profile Insight:
Price has entered a low-volume area near resistance, indicating potential weakness in demand above 0.80800.
Resistance Rejection:
Price tested the 0.80760–0.81009 resistance range and failed to break through decisively.
A potential fake breakout or bull trap could be forming.
Bearish Projection:
If price confirms rejection from resistance, we may see a drop toward the support zone (0.79000 – 0.79236).
This would complete a classic resistance-to-support rotation.
Bearish Confirmation:
A bearish candle formation or break below 0.80350 can trigger short entries.
Ideal risk-reward favors a short setup here.
📉 Trade Plan (Educational Purpose Only):
Entry Zone: 0.80750 – 0.80950
Stop Loss: Above 0.81100
Take Profit Target: 0.79250
Risk-Reward: Approx. 1:2.5
🔻 Summary:
USDCHF is trading near a major resistance zone with weak bullish momentum. If confirmed, a sharp reversal toward support is expected, making this a potentially strong short opportunity.
Forexeducation
EUR/GBP Technical Analysis – Range-Bound Structure EUR/GBP Technical Analysis – Range-Bound Structure with Potential Rebound
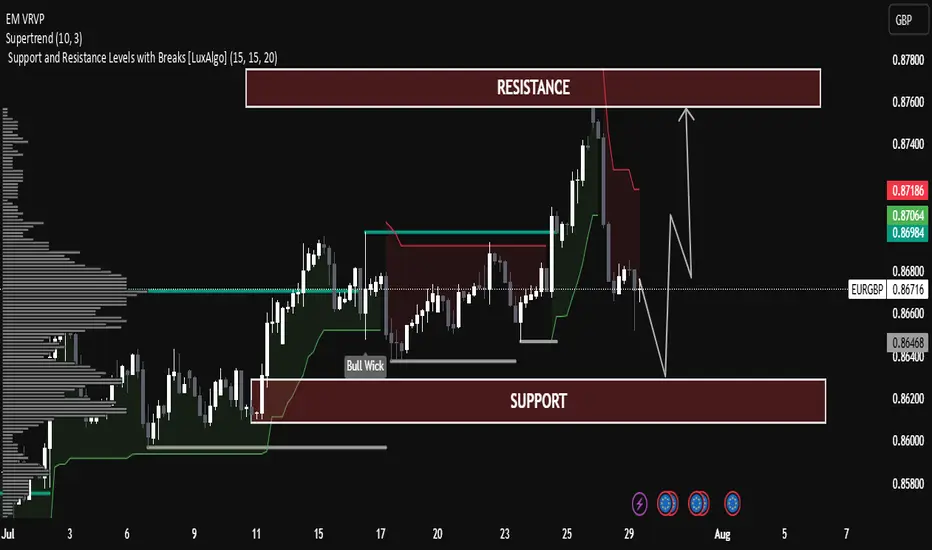
The pair is currently trading within a well-defined horizontal channel between:
Support Zone: 0.86400 – 0.86200
Resistance Zone: 0.87800 – 0.87600
Price is currently near the mid-level (0.86756), showing consolidation after a rejection from resistance.
Supertrend Indicator:
The Supertrend (10,3) is currently bearish (red line above the price), indicating short-term downward pressure.
Price recently broke below the Supertrend line near the highs, suggesting a correction is underway.
Volume Profile (Left Side):
Significant volume has been transacted around the current market range (Point of Control).
This indicates strong interest and fair value, often leading to sideways movement before the next breakout.
Bull Wick Highlight (Mid-July):
Indicates buying pressure from lower levels, acting as historical demand near 0.86400.
🔄 Price Projection & Scenario Planning:
✅ Scenario A: Bullish Rejection from Support
If price retests the support zone (0.86400 – 0.86200) and forms a bullish rejection (e.g., pin bar or engulfing), a bounce is likely.
Target: Resistance zone 0.87600 – 0.87800
Confirmation: Bullish candle + break of 0.86900 resistance.
❌ Scenario B: Bearish Breakout Below Support
A break and close below 0.86200 may trigger a deeper correction.
Next possible downside target: 0.85800
Volume drop and strong red candles would support this.
🔧 Technical Summary:
Indicator Status
Structure Sideways / Range-bound
Supertrend Bearish (Short-term)
Support Zone 0.86200 – 0.86400
Resistance Zone 0.87600 – 0.87800
Bias Neutral-to-Bullish (above support)
🧠 Educational Note:
This chart is a great example of range trading—where traders look to buy near support and sell near resistance, especially when there is no strong trend. Patience and confirmation signals (like wick rejections or volume spikes) are key in such setups.
USD/JPY Chart Analysis (Educational Breakdown)📊USD/JPY Chart Analysis (Educational Breakdown)
🗓 Date: July 28, 2025
⏰ Timeframe: 2H (2-Hour Candles)
🧠 Concepts: Liquidity | Fair Value Gap | Order Block | Structure | Support/Resistance
⸻
1. Market Structure Overview
• The pair has been bullish, making higher highs and higher lows.
• Recently, price tapped into a resistance zone (~148.40–149.00) and sharply rejected, suggesting a potential short-term reversal.
• The price may now aim to sweep liquidity below support before a possible rebound.
⸻
2. Key Levels
🟥 Resistance Zone (148.50–149.00)
• Marked by a previous supply zone where sellers stepped in aggressively.
• Current Bearish Order Block sits just below this resistance, confirming institutional interest in selling this level.
🟫 Bearish Order Block
• Last bullish candle before sharp drop acts as a bearish order block (around 148.30–148.50).
• This is a high-probability sell-side reaction area — ideal for liquidity grabs and reversals.
🟦 Fair Value Gap (FVG)
• Between mid-17th–18th July, an imbalance was left after strong bullish momentum.
• Price returned to this zone, partially filled the gap, and then dropped again — confirming its importance.
🟥 Support Zone (145.80–146.30)
• Long-standing demand area where buyers previously stepped in.
• This area aligns closely with sell-side liquidity (SSL).
⸻
3. Liquidity Zones
🔵 Buy-Side Liquidity (BSL) – Above resistance (149.00+)
• Stop-loss clusters above previous swing highs.
• Liquidity for institutional sell positions.
🟣 Sell-Side Liquidity (SSL) – Below 146.00
• Positioned right under support.
• Ideal liquidity target for smart money to trigger stop hunts and fill positions before reversing.

EURUSD Analysis : Rejection at Demand – Institutional Buy Setup🔍 Technical Storyline – What the Chart Tells Us:
🔸 1. Previous Bearish Structure – Descending Channel:
Price has been moving within a well-respected bearish channel, signifying structured sell-side liquidity control.
This channel served as a trap zone, where retail sellers were induced while institutions accumulated buy-side positions below the range.
The controlled movement inside the channel ended with a breakout to the upside, signaling a disruption in bearish control.
🔸 2. QFL Zone Formation – Manipulation & Liquidity Grab:
QFL (Quasimodo Failure Level) is evident in two phases here:
The first QFL acts as a reaction point where the market dropped to test demand and rallied aggressively.
The second QFL near the highs shows price swept previous liquidity before dumping, hinting at institutional profit-taking and possible redistribution into discount areas.
🔸 3. Central Reversal Zone (CRZ):
Price reversed sharply from this CRZ, which acted as a major supply level. The CRZ marks the top of the manipulation range.
This was a liquidity sweep targeting trapped long positions that entered too late at the highs.
🔸 4. Demand Revisit + Positive Rejection Pattern (Current Phase):
Price has now reached the MMC-validated demand zone, which previously launched a strong bullish move.
The long lower wick in the latest candle shows buyer absorption, suggesting early signs of a Positive Reversal Pattern.
This area is marked with high probability for bullish continuation, as it aligns with both technical support and smart money logic.
💡 Trading Plan & Market Mindset:
🔸 📈 Bullish Scenario (High-Probability Play):
Wait for bullish confirmation, such as:
Bullish engulfing on 1H/4H
Break of minor intraday structure (e.g., break of internal LH)
Strong volume surge from the zone
Entry zone: Within the demand block – 1.15500 to 1.15750
Stop-loss: Just below the demand zone (1.15250)
Target 1 (TP1): 1.16500 – minor intraday resistance
Target 2 (TP2): 1.17500–1.18000 – retest of QFL high and Central Reversal Zone
🔸 ❌ Bearish Invalidator:
A 4H candle close below 1.15250 would break the demand zone structure.
Invalidation of MMC reversal – move toward deeper liquidity (1.14500–1.14800)
🧠 Trader’s Psychology & Institutional Mindset:
Institutions often induce price spikes to trap both buyers and sellers.
This entire structure reflects classic accumulation → manipulation → distribution → reaccumulation.
The retest of the original demand zone allows institutions to re-enter at discount before pushing price back toward the highs.
“In MMC, patterns are not just shapes – they are footprints of institutional intent.”

BTC Breaks Structure After Liquidity Grab! Massive Move Loading…BTC/USD Technical Analysis – July 25, 2025
Structure Overview:
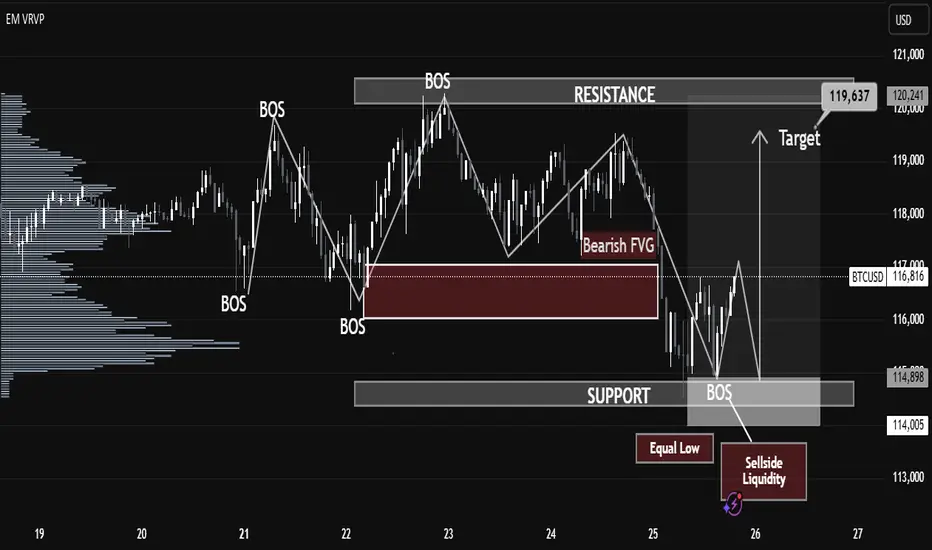
The current BTC/USD price action showcases a classic market structure shift, with multiple Breaks of Structure (BOS), liquidity grabs, and a clear intent to revisit premium pricing zones. The chart follows a Smart Money Concepts (SMC) methodology, identifying key supply and demand areas.
Key Highlights:
🔹 Break of Structure (BOS):
Several BOS events indicate momentum shifts and short-term trend reversals. The most recent BOS near the support zone suggests a potential bullish move after liquidity sweep.
🔹 Sell-Side Liquidity & Equal Lows:
BTC swept the Equal Low level near $114,000, triggering Sell-side Liquidity. This liquidity grab is often a manipulative move by institutional players to collect orders before driving price higher.
🔹 Support Zone:
The support zone near $114,900–$114,000 is holding strong. Price wicked into this area, collected liquidity, and reacted with bullish intent.
🔹 Bearish Fair Value Gap (FVG):
A Bearish FVG exists around $117,500–$118,000, which may act as short-term resistance. Price could partially fill this gap before resuming direction.
🔹 Target Zone:
Projected target lies at $119,637, aligning with the prior resistance zone and offering a high-probability area for price delivery based on the current bullish market structure.
🔹 Volume Profile Support:
The volume profile suggests high volume accumulation in the current range, further supporting the possibility of a bullish expansion phase.
Forecast Summary:
Bias: Bullish (Short-term)
Entry Zone: Confirmed after BOS and liquidity sweep near support
Target: $119,637 (resistance zone)
Invalidation Level: Sustained break below $114,000
⚠️ Risk Note:
A rejection from the Bearish FVG or failure to break above $117,800 may cause a deeper pullback. Monitor reactions around key levels before continuation.
Understanding Market Structure: GBPJPY Trendline Support 📊 GBPJPY Technical Analysis — 15-Min Chart (As of July 24, 2025)
Trend Structure & Price Action
The chart shows a clear ascending trendline, connecting higher lows across the last sessions.
Multiple Break of Structure (BOS) points confirm bullish market behavior, with price consistently forming higher highs and higher lows.
The most recent BOS and price rejection from the lower boundary of the cloud band indicate bullish intent is still active.
Indicators Used
Custom Cloud Band (EMA Based 20, 1.5 settings):
Price is oscillating within and around the cloud band.
Recent candles are attempting to reclaim the upper band, suggesting building bullish momentum.
Volume Profile (VRVP) shows strong volume support around the 198.200–198.500 range, aligning with the trendline.
Support & Resistance
Support Zone: 198.200 (trendline confluence + volume shelf)
Immediate Resistance: 198.800–199.000
Major Resistance: 199.400 (next psychological level and prior high)
Forecast & Trade Idea (Educational Purpose)
If price continues to respect the ascending trendline and breaks above the recent local high (~198.750), we could see a bullish breakout toward 199.200+.
A bullish flag or small consolidation above the trendline before breakout is likely, as illustrated by the arrow.
Invalidation occurs if price breaks and closes below the trendline and 198.200, which may trigger a short-term correction.
✅ Conclusion
GBPJPY is currently in a bullish market structure with support from both trendline and volume profile. A clean breakout above 198.800 with volume confirmation could fuel continuation toward 199.200 and beyond. Risk management is crucial — watch for false breakouts or a shift in structure below the rising trendline.

THE KOG REPORT THE KOG REPORT:
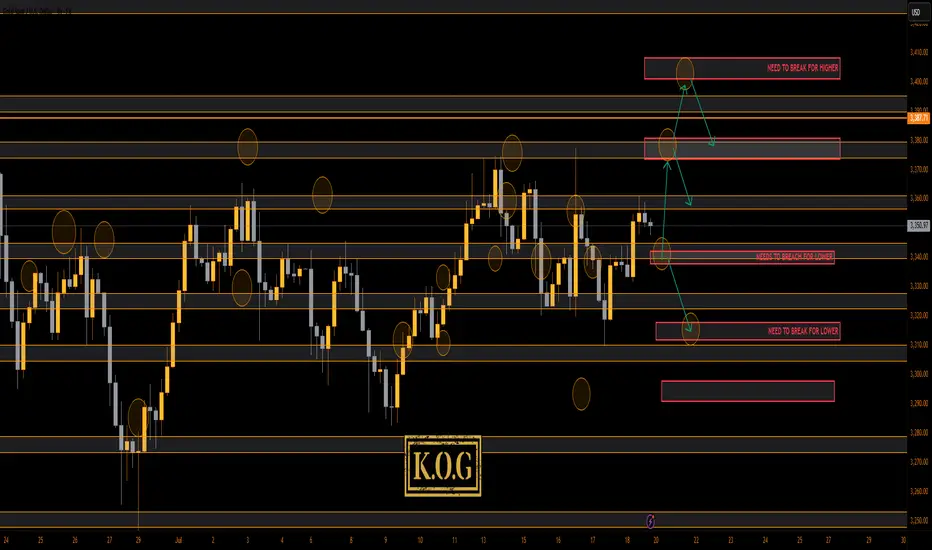
In last week’s KOG Report we said we would be looking for a price to attempt the higher level red box sitting around the 3370-75 region and if not breached, we felt an opportunity to short would be available from that region. We said if that failed and the move commenced, we would be looking at a complete correction of the move back down into the 3330-35 region, where we would then monitor price again in anticipation of a long from there or the extension level of 3310 which was also a red box short target (move complete). As you can see from the above, not only did we get that higher red box, we rejected, completed the move downside and then our traders managed to get that long trade all the way back up into the Excalibur target, red box targets and the hotspots shared in Camelot.
A decent week again, not only on Gold but also the numerous other pairs we trade, share targets on and analyse.
So, what can we expect in the week ahead?
For this week we can expect more ranging price action, but due to the previous range from last week being so tight, it looks like we’ll see a breakout coming in the latter part of the week unless there is news to bring us unexpected volume.
We have the key level below 3335-40 support and above that resistance and a red box sitting at 3375-80. This is the region that needs to watched for the break, and if broken we should hit the range high again at 3400-10. However, if rejected, we could again see this dip to attack that lower order region 3310-6 before attempting to recover.
Last week we wanted to see that curveball and although we did see some aggressive price action, I think we will see something extreme for this week. It’s that lower level 3310-6 that is a key region for bulls, if broken we can see a complete flush in gold taking us down into the 3250’s before we start the summer run. That for us would be the ideal scenario going into the month end, but, we’ll play it how we see and as usual, we go level to level and update any changes as we go along.
KOG’s Bias for the week:
Bullish above 3340 with targets above 3355, 3361, 3368, 3372 and above that 3385
Bearish below 3340 with targets below 3335, 3330, 3322, 3316, 3310 and below that 3304
RED BOX TARGETS:
Break above 3350 for 3355, 3361, 3367, 3375 and 3390 in extension of the move
Break below 3340 for 3335, 3330, 3320, 3310 and 3306 in extension of the move
Please do support us by hitting the like button, leaving a comment, and giving us a follow. We’ve been doing this for a long time now providing traders with in-depth free analysis on Gold, so your likes and comments are very much appreciated.
As always, trade safe.
KOG
XAUUSD Price Analysis — Support Zone Reaction & Potential XAUUSD Price Analysis — Support Zone Reaction & Potential Bullish Reversal
🔍 Market Structure Overview
The chart shows a clear bullish market structure characterized by multiple Breaks of Structure (BOS) and a strong upward trend that recently corrected into a key support zone around 3360–3340.
This correction phase may be coming to an end as price reaches a high-probability demand area, with bullish reaction forming at the support level.
🧠 Smart Money Concept (SMC) Breakdown
📌 Break of Structure (BOS) confirms institutional activity and directional bias.
🔄 After a strong uptrend and BOS on July 22–23, a healthy retracement has taken place toward a major demand zone.
The support level is aligning with past consolidation and previous BOS zones, providing confluence for a bullish bounce.
📊 Technical Confluence
✅ Volume Profile (VRVP) shows strong buyer activity at current levels.
✅ The price is reacting within the support box with a small bullish candle, indicating potential accumulation.
✅ A clean liquidity sweep may have occurred just below minor lows, shaking out weak hands before a move upward.
🎯 Forecast
If price holds above the 3360 level, and bullish confirmation continues (e.g., break above minor lower highs), we can expect:
Short-term target: 3400
Major target: 3440 (marked resistance zone)
⚠️ Invalidation: A clean break and close below 3340 may lead to deeper correction or change in structure.
📘 Educational Title Suggestion
"Smart Money Reaction at Demand: XAUUSD Poised for Reversal from Key Support"

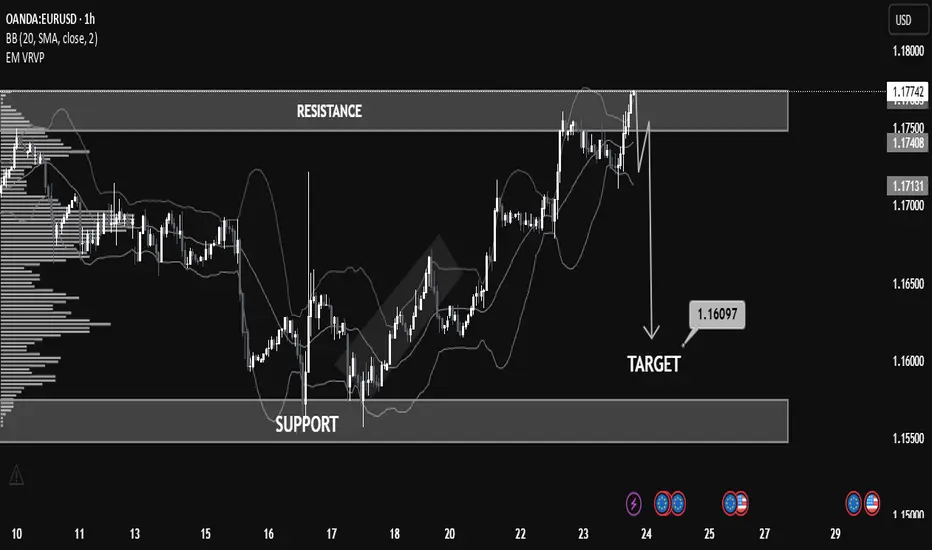
Educational EUR/USD Chart Breakdown – Price Action at Key LevelsEducational EUR/USD Chart Breakdown – Price Action at Key Levels
This EUR/USD (1-hour) chart provides a great example of how support and resistance zones, combined with price action and indicators like Bollinger Bands, can help anticipate market moves.
🔹 Resistance Zone Tested:
The pair recently approached the 1.17500–1.17800 resistance zone. This level had previously acted as a supply zone, and price once again showed rejection here, indicating selling pressure.
🔹 Bollinger Band Overextension:
Notice how the price extended beyond the upper Bollinger Band—this often signals that the market is overbought in the short term, leading to a potential reversal or correction.
🔹 Bearish Reaction & Target:
After rejection from resistance, the chart outlines a bearish move with a target at 1.16097. This level lies just above the next strong support zone (1.15500–1.16100), offering a realistic area for price to stabilize if the downtrend continues.
🔹 What to Learn:
Support & Resistance: Prices often react at key zones; previous resistance can turn into support and vice versa.
Confluence Tools: Use indicators like Bollinger Bands with price structure to increase confidence.
Target Planning: Identify likely reaction zones for risk management and profit-taking.
📚 Summary
This setup is a clean example of trading within a range and using technical confluence to plan entries and exits. If price breaks below 1.17130 with strong momentum, the probability increases for the market to reach the 1.16097 target.
BTC/USD Technical Analysis — Educational BreakdownBTC/USD Technical Analysis — Educational Breakdown
🧠 Key Observations:
🔹 Market Structure: Break of Structure (BOS) Confirmations
The chart highlights multiple BOS points, showing clear transitions in market structure – a strong indication of bullish momentum building up after prior consolidation and retracements.
🔹 Support Zone (Demand Area): 115,355 – 117,403
This area has acted as a liquidity pool where buyers previously stepped in, forming the base for new BOS formations. A retest of this level could offer a high-probability long entry.
🔹 Resistance Zone (Supply Area): 123,375 Region
This marked level is a prior high and expected profit-taking or potential short-trigger zone. Price is likely to target this level if bullish momentum continues.
⸻
📈 EMA Analysis (20/50/100/200)
• Stacked Bullishly: EMAs are layered with the shorter-term EMAs (20/50) above the longer-term ones (100/200), suggesting trend continuation to the upside.
• Price reclaiming above all EMAs signals momentum is shifting from accumulation to expansion.
⸻
🔮 Potential Scenario:
1. Bullish Retest Play
A pullback toward the demand/support zone (116k–117.4k) can present a high-RR entry.
2. Continuation Toward Resistance
If price holds above the EMAs and structure, we could see a push toward 123,375, where profit booking may occur.
⸻
📌 Market Sentiment Bias: Bullish
• Structure: Bullish BOS
• Momentum: Above all EMAs
• Volume Profile: High acceptance near

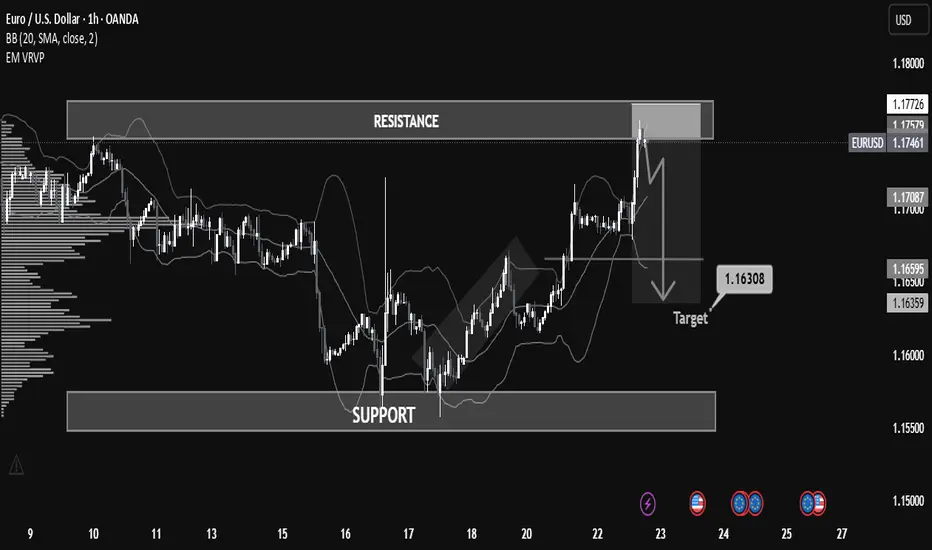
Why EUR/USD Dropped: A Step-by-Step Breakdown for Learners📉 Overview:
The EUR/USD has recently approached a key resistance zone near 1.17726, showing signs of a potential rejection after a bullish rally. The price is currently hovering around 1.17468, forming a short-term bearish setup that could lead to a retracement or reversal.
⸻
⚙ Key Technical Zones:
• 🔼 Resistance: 1.17500 – 1.17726
Price was strongly rejected after testing this area. This level has historically acted as a supply zone.
• 🔽 Support: 1.15500 – 1.16000
This is a historically significant demand zone, where price previously consolidated and reversed.
• 🎯 Target Zone: 1.16308
Marked as a potential take-profit level based on prior price structure and volume profile imbalance.
⸻
🧠 Indicators & Tools:
• Bollinger Bands: Price touched the upper band in overbought conditions, suggesting a possible mean reversion.
• Volume Profile (VRVP): Indicates declining volume near resistance, pointing to weak buyer momentum.
• Price Action: Bearish engulfing candle and strong rejection wick at resistance, confirming selling pressure.
⸻
🧭 Market Bias:
📌 Short-Term Bearish
A short opportunity is forming based on the rejection from resistance and overextension of price.
⸻
🧩 Possible Scenario:
1. Breakdown below 1.17061 (mid-level support) could trigger acceleration to the downside.
2. 1.16500 and 1.16308 are ideal short targets before reevaluation for continuation or bounce.
⸻
🛑 Risk Management Tips:
• Consider SL above 1.17800 (previous high).
• Monitor for confirmation before entry (e.g., bearish candle close below 1.17000).
• Adjust size and risk-reward ratio appropriately.
NZD/USD Technical Analysis | Smart Money Perspective🧠 NZD/USD Technical Analysis | Smart Money Perspective
On the current NZD/USD chart, price is trading around 0.5960, positioned between a clearly defined resistance zone (0.6130–0.6150) and a support zone (0.5890–0.5900).
We can observe the following key technical elements:
🔹 1. Liquidity Sweep
Price recently broke below the previous swing low near 0.5900, tapping into a pool of sell-side liquidity. This movement is commonly interpreted as a liquidity grab, where institutions manipulate price to trigger retail stop losses before reversing.
🔹 2. Double Bottom Formation
The chart indicates a potential double bottom forming at the support level — a classic accumulation signal. This pattern suggests buyers may be stepping in after liquidity has been taken out, anticipating a reversal.
🔹 3. Fair Value Gap (FVG)
An FVG (imbalance) is visible in the range of 0.5985 to 0.6015. This inefficiency was created by a sharp bearish move, leaving price action unbalanced. Price is now expected to retrace into this area to rebalance orders — a common smart money behavior.
🔹 4. Market Structure Outlook
If the double bottom confirms with a bullish break of structure above 0.5980, we could expect a continuation toward:
First Target: FVG zone around 0.6015
Second Target: Major resistance near 0.6150, where past distribution occurred.
✅ Conclusion
This setup combines key smart money concepts:
Liquidity grab below support
Accumulation phase at demand
FVG as target
Potential bullish market structure shift
Traders should monitor price action around the support zone for confirmation (e.g., bullish engulfing or break of short-term highs) before entering long positions. Targets remain at the FVG and resistance zones, but risk management is essential in case of a deeper sweep or macroeconomic catalyst.

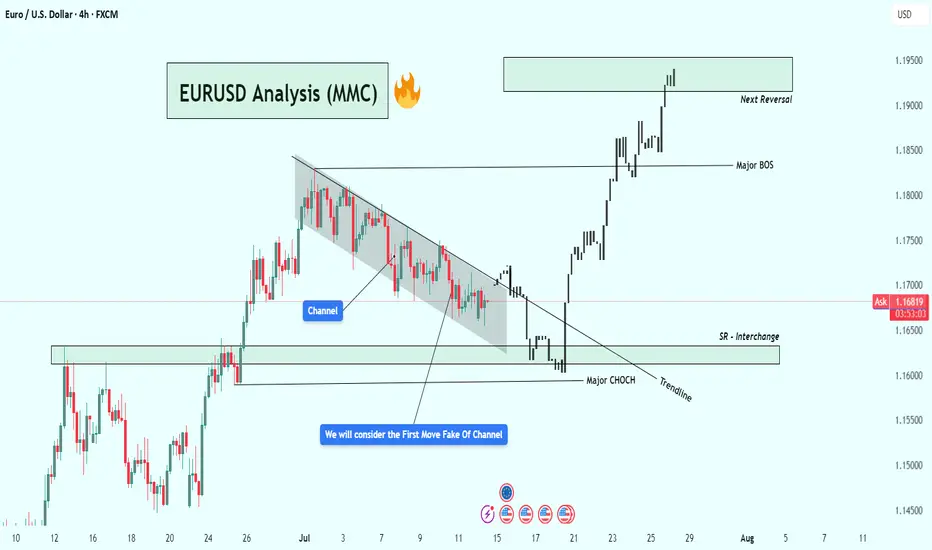
EURUSD Analysis – Smart Money Breakout + Reversal Zone in Play🔹 1. Bearish Channel & Liquidity Trap Setup
Price action from late June into mid-July formed a clearly defined descending channel, with consistent lower highs and lower lows. This structure likely attracted retail traders into short positions, expecting continued downside.
💡 Key Insight: The initial breakout of the channel was a fake move — often referred to as a liquidity grab or inducement. This is typical in smart money models where institutions trap early traders before the real move begins.
🔹 2. Major CHoCH (Change of Character)
Shortly after the fakeout, price sharply reversed and broke a major internal structure level, giving us our first CHoCH confirmation. This is a critical event in SMC, signaling a possible trend reversal from bearish to bullish.
Why it matters: A CHoCH after a channel + fakeout combo is a strong reversal signal, especially when supported by volume and aggression.
Visual cue: Look at the bullish engulfing momentum candle post-fakeout — this was the moment smart money entered.
🔹 3. Trendline Break + SR Interchange (Support/Resistance Flip)
Following the CHoCH, price broke the trendline and came back down to test a high-probability SR Interchange Zone — an area where previous resistance turned into fresh support.
This zone also aligns with the order block and inefficiency area, making it a premium entry for institutions.
Notice how price respected the zone before launching aggressively upward.
🧠 Note: This was the cleanest entry point in this setup — combining structure break, liquidity, and a demand zone.
🔹 4. Major BOS (Break of Structure)
After the retest, EURUSD broke the last major lower high, confirming a Bullish BOS (Break of Structure). This is where many traders realized the trend had shifted.
Market sentiment flipped from bearish to bullish.
Momentum increased, indicating institutional buying pressure.
🔹 5. Next Target: Reversal Zone (Supply Area)
Price has now reached a critical supply zone (1.1930 – 1.1970) where the next major reaction is likely to occur. This area was previously a strong rejection point, and it aligns with a potential higher timeframe supply zone.
⚠️ Watch for:
Bearish rejection wicks
Liquidity sweeps above highs
Bearish engulfing or mitigation patterns
CHoCH on lower timeframes (1H, 15m)
✅ Key Trading Takeaways:
Liquidity Trap: Retail was trapped inside a clean channel.
Fakeout Move: Induced shorts were wiped out.
CHoCH & BOS: Clear reversal pattern with momentum.
Perfect Retest Entry: Price retested demand and launched.
Current Area = Supply/Distribution: Great place to look for shorts or take profits.
📌 Possible Trading Plans:
🔸 Plan A: Reversal Short (Countertrend)
Entry: Inside 1.1930–1.1970 zone
Confirmation: Bearish PA + LTF CHoCH
TP1: Previous BOS (~1.1830)
TP2: Demand zone retest (~1.1650)
SL: Above 1.1980–1.2000
🔸 Plan B: Continuation Long (Breakout Bias)
Entry: Break + Retest above 1.2000 psychological level
SL: Below breakout wick
TP1: 1.2100
TP2: 1.2200+
🔖 Concepts Applied:
Smart Money Concepts (CHoCH, BOS, liquidity sweep)
Price Action Structure
Trendline break and retest
Supply & Demand Zones
Support/Resistance Flip (SR Interchange)
Volume + Momentum Confirmation
🔄 Conclusion:
This chart demonstrates a classic Smart Money narrative:
“Trap the retail, shift the structure, drive price into premium, then reverse.”
We're now at a make-or-break supply zone. Watch price behavior carefully — this is where smart traders either secure profits or prepare for the next leg.
Is Gold Ready for a Breakout or Pullback? | Weekly ForecastIn this video, we dive deep into the gold market analysis for the week of July 7 to July 11, 2025. I break down everything you need to know from last week’s price action — including the surge to $3,360, the impact of the U.S. tax cut and spending bill, and the 2.2% weekly gain despite consolidation.
We also look ahead at what to expect this week, including:
📅 July 9 Trade Tariff Deadline
📉 Key U.S. labor data (Initial Jobless Claims)
🏦 Market sentiment around Fed rate cut speculation
📊 Strategic insights based on technical and macro confluence
👉 If you find this content valuable, don’t forget to Vote, Comment, and Subscribe for weekly market breakdowns.
💬 Drop your thoughts in the comments:
Do you think gold will break above $3,360 this week? Or are we gearing up for a deeper pullback?
Disclaimer:
Based on experience and what I see on the charts, this is my take. It’s not financial advice—always do your research and consult a licensed advisor before trading.

Overtrading – The Silent Threat to Consistent PerformanceTrader Psychology | Part 1: Overtrading – The Silent Threat to Consistent Performance
In trading, more does not mean better. One of the most common and damaging psychological pitfalls traders fall into is overtrading — executing too many trades, often without clear setups, simply to stay active in the market.
It’s subtle, it feels productive… but it quietly erodes both your capital and your discipline.
💡 What Is Overtrading?
Overtrading occurs when a trader opens excessive positions, often outside of their strategy or plan. It’s driven by emotions rather than logic, and usually shows up in one of the following forms:
Taking trades without confirmation
Trying to "make back" previous losses (revenge trading)
Forcing trades during low-volume market conditions
Trading simply out of boredom or anxiety about missing out
It’s not just about the number of trades — it’s about why you’re taking them.
⚠️ How to Know You're Overtrading
You're entering trades that don’t meet your criteria
You feel uncomfortable not having an active position
You trade aggressively after a loss
You switch strategies frequently
Your trading feels more like activity than decision-making
You’re losing more in fees/spread than on price movement
🧠 Why Overtrading Happens
🔹 The Need to Be "Active"
Traders often equate activity with productivity. But the truth is, patience is a trading skill — doing nothing is sometimes the most profitable move.
🔹 Pressure to Perform Daily
Some traders feel they must generate daily profits. This mindset leads to forcing trades during uncertain or low-probability conditions.
🔹 Overconfidence After Wins
A short winning streak can create the illusion of control, pushing traders to increase frequency and risk — usually without real setups to back it up.
🔻 The Cost of Overtrading
Rapid Drawdowns: Frequent small losses and transaction costs add up quickly
Emotional Fatigue: Decision-making becomes reactive instead of rational
Loss of Trust in Your System: Not because the system failed — but because it wasn’t followed
Increased Costs: Spreads, commissions, and swaps eat into your margin
Overtrading doesn’t just hurt your balance. It damages your confidence, focus, and mental capital.
✅ How to Stop Overtrading – Practical Fixes
1. Set a Daily Trade Limit
Commit to a maximum number of trades per session (e.g., 2–3 trades). This forces you to wait for the best opportunities.
2. Track Your Trades in a Journal
Log each trade: the setup, your reasoning, emotions, and outcome. Over time, this reveals emotional patterns and helps you regain discipline.
3. Trade Only During Key Market Hours
Avoid trading during illiquid sessions. Focus on London and New York overlaps, where structure and volatility are present.
4. Accept That Flat Is a Position
Not being in a trade is often a smart decision. Staying out preserves capital and prepares you for higher-probability setups.
🎯 Final Thoughts
Overtrading is not a technical flaw — it’s a psychological leak.
If you want longevity in this game, you must master more than charts — you must master yourself.
“The market doesn’t reward activity. It rewards patience, precision, and emotional control.”
Next time you feel the urge to trade "just because" — pause, breathe, and ask yourself: Is this trade part of my edge?
📌 Coming Up Next:
Trader Psychology | Part 2: FOMO – Why Fear of Missing Out Can Destroy Good Traders
🔔 Follow this profile to be notified when the next chapter is live.

AUDJPY 1D: breakout toward 100–105AUDJPY has confirmed an inverse head and shoulders breakout on the daily chart, with a strong move above the neckline. All key moving averages, including MA50 and MA200, remain below the current price — confirming bullish momentum. Volume increased on the breakout, and price has held above the 95.6 neckline zone. As long as that level holds, the setup remains valid. Targets are set at 100.36 (1.618 Fibo) and 105.19 (2.0 Fibo).

GOLD (XAUUSD) Technical Analysis – MMC Strategy Breakdown🧠 Conceptual Foundation:
This analysis is rooted in Market Maker Concepts (MMC), focusing on how smart money manipulates liquidity, traps retail traders, and shifts structure before making big moves. The GOLD market today gave us a high-probability setup that combined several key technical elements: SR interchanges, structure shifts, trendline breaks, and a major arc pattern.
Let’s dissect it step-by-step:
1️⃣ Initial Downtrend & Liquidity Sweep
In the early part of the chart, GOLD was in a clear bearish trend, forming lower highs and lower lows, consistently respecting a descending trendline. This downtrend attracted retail sellers who kept entering shorts, reinforcing the bearish sentiment.
🔻 However, right before the reversal, GOLD made a sharp move down to grab liquidity below previous lows near the $3,361–$3,364 support zone. This is a classic MMC liquidity trap — clearing out stop-losses of early buyers before initiating a reversal.
2️⃣ SR Interchange Zones (Smart Money Play)
Around the levels of $3,361 and $3,364, we noticed strong Support-Resistance Interchange (SR Flip) behavior:
These zones were first used as support during the initial decline.
Once broken, they acted as resistance, and again flipped to support post-breakout.
This flip signals institutional involvement — smart money often builds positions in these zones.
These interchanges also acted as the base of accumulation, preparing for a bullish breakout.
3️⃣ Trendline Breakout – Early Reversal Confirmation
As the price consolidated and coiled around the SR zones, it finally broke the descending trendline — a major reversal signal.
This breakout was accompanied by strong bullish candles, showing a sudden shift in momentum. It's likely that smart money stepped in aggressively, initiating a structure shift.
4️⃣ Arc Pattern Formation – Visual Clue of Accumulation
The most eye-catching part of this chart is the arc pattern — a rounded bottom formation. This type of pattern typically indicates accumulation phase, where institutions quietly enter positions while retail sentiment is confused or bearish.
🟡 The arc acts like a pressure cooker: as price coils and liquidity builds, it eventually explodes in the direction of accumulation — in this case, bullish.
5️⃣ Structure Shift – Confirmation of Bullish Intent
Once price broke above the internal structure (previous lower highs), it confirmed a structure shift from bearish to bullish.
📈 This is one of the most critical elements in MMC:
It tells us that smart money has reversed the flow.
The shift often leads to expansive moves in the new direction (as we saw here).
6️⃣ Next Reversal Area (Key Supply Zone)
Price continued surging upward and reached a predefined Reversal Area around $3,405–$3,410. This zone is likely to contain historical supply and institutional sell orders.
As expected:
Price showed early rejection signs from this level.
A potential short-term pullback or distribution phase may now be underway.
If bulls reclaim this zone, it may lead to further upside toward $3,420–$3,430.
📌 Key Technical Highlights:
Component Observation
Trendline Clean break signals momentum shift
SR Interchange Zones Strong demand re-entry near $3,361–$3,364
Arc Pattern Indicates bottoming and accumulation phase
Structure Shift Broke prior lower highs confirming bullish bias
Reversal Zone $3,405–$3,410 acting as resistance; possible rejection/pullback point
🔮 What to Expect Next?
If price rejects the $3,405–$3,410 zone again and forms a lower high, expect a pullback to $3,375–$3,380.
A break above the reversal zone with strong volume may open the door to new highs, targeting $3,420+.
Use caution around news events or high-impact fundamentals (e.g., USD data releases).
💡 Trading Strategy Ideas:
✅ Long Scenario (Already Played Out):
Entry: Post-trendline break + arc confirmation
TP1: Reversal Zone at $3,405
SL: Below $3,361 SR Flip
🔁 Potential Short Setup:
Entry: On bearish confirmation from $3,405–$3,410
TP1: $3,375
TP2: $3,364
SL: Above $3,412 (reversal zone high)
📢 Final Thoughts:
This chart is a great example of how MMC (Market Maker Concepts), when combined with clean price action tools like trendlines, SR zones, and structure shifts, can offer high-accuracy trades.
Don't chase price. Wait for zones to react. Let the market show its hand before taking action.

Multi-Time Frame Analysis (MTF) — Explained SimplyWant to level up your trading decisions? Mastering Multi-Time Frame Analysis helps you see the market more clearly and align your trades with the bigger picture.
Here’s how to break it down:
🔹 What is MTF Analysis?
It’s the process of analyzing a chart using different time frames to understand market direction and behavior more clearly.
👉 Example: You spot a trade setup on the 15m chart, but you confirm trend and structure using the 1H and Daily charts.
🔹 Why Use It?
✅ Avoids tunnel vision
✅ Aligns your trades with the larger trend
✅ Confirms or filters out weak setups
✅ Helps you find strong support/resistance zones across time frames
🔹 The 3-Level MTF Framework
Use this to structure your chart analysis effectively:
Higher Time Frame (HTF) → Trend Direction & Key Levels
📅 (e.g., Daily or Weekly)
Mid Time Frame (MTF) → Structure & Confirmation
🕐 (e.g., 4H or 1H)
Lower Time Frame (LTF) → Entry Timing
⏱ (e.g., 15m or 5m)
🚀 If you’re not using MTF analysis, you might be missing critical market signals. Start implementing it into your strategy and notice the clarity it brings.
💬 Drop a comment if you want to see live trade examples using this method!

EURUSD Weekly Analysis (MMC) – Bearish Path to Target Zone📈 Market Narrative – Understanding EURUSD's Path with MMC
The EURUSD pair is currently navigating a critical phase in its macro price structure, aligning closely with the Mind Market Concept (MMC) methodology — a trading framework rooted in institutional price behavior, psychological arcs, and structured market mapping.
This chart reveals a story of accumulation, expansion, manipulation, and rebalancing — classic smart money behavior playing out on the higher timeframe. The current move is not just price action — it's a strategic delivery of price toward imbalance, guided by volume vacuums, liquidity zones, and engineered traps.
🧩 Phase-by-Phase Technical Analysis
🔷 1. Arc Accumulation Zone – The Beginning of Institutional Positioning
In the latter half of 2024, EURUSD entered a rounded arc formation, which marks a textbook accumulation phase.
This "bowl-like" curve represents gradual absorption of sell-side liquidity by institutions.
The lows became progressively higher, indicating demand stepping in while supply weakened.
Volume during this time was suppressed — another smart money tactic to accumulate without causing price spikes.
📌 Why This Matters: Arcs often precede explosive breakouts, particularly when aligned with time-based liquidity cycles (quarterly/yearly rebalancing). This zone gave birth to the breakout that followed.
🔷 2. The Central Zone – Consolidation Before Expansion
Once the arc base was complete, price broke out impulsively, then pulled back into what is labeled the Central Zone.
This zone acts as a mid-range liquidity pocket — where orders are stacked and reaccumulation occurs.
It also became the launchpad for the final markup wave that tapped the previous target around 1.1250.
🔍 This move was the realignment phase, where smart money took price above key highs to:
Hit their internal targets.
Trap breakout traders.
Induce euphoria before distribution.
🔷 3. Major BOS – Break of Macro Structure
The breakout through 1.1150–1.1200 confirmed a Major Break of Structure (BOS).
This BOS acted as a signal for:
Trend reversal confirmation for many retail traders.
A "green light" to buy — which was anticipated and exploited by institutions.
But here’s the twist:
Price rejected the SR Interchange Zone (support turned resistance), signaling that the breakout was engineered to trap liquidity.
🔷 4. Distribution & Manipulation – The Trap Layer
The chart clearly shows two critical supply areas:
Minor Resistance (around 1.1400s)
Major Resistance (around 1.1550–1.1600s)
Price briefly approached these zones but failed to hold, forming a complex distribution range.
This is where:
Smart money distributed their long positions.
Retail buyers got trapped.
Volume increased during sell-side preparation.
📌 The rejection from these zones sent price into a clean markdown, forming lower highs and confirming the bearish structure mapping.
🔷 5. Structural Mapping – Downtrend Control
Price action is now clearly in a bearish delivery phase, as shown by:
Lower highs & lower lows
Repeated rejections from minor resistance
Large red candles with little retracement (showing momentum)
This phase is often misunderstood by retail traders. But within MMC, it’s identified as the delivery to imbalance — a controlled descent into unmitigated demand.
🔷 6. Target + Reversal Zone – Where the Real Opportunity Begins
We are approaching the most important area on the chart:
🟡 Target + Reversal Zone (around 1.0950–1.1000)
This zone is not randomly drawn:
It's the origin of the arc breakout, a high-volume node.
It's a discounted price level where institutions may re-engage.
It’s untapped demand from the earlier accumulation — meaning no major reaction has occurred here yet.
If price slows down here, forms a liquidity sweep, or gives a bullish engulfing on the lower timeframe — this could be the reversal point.
But:
If price slices through with strong momentum, it may signal macro weakness, opening room to test the 1.0800 region.
🧭 Trade Plan & Execution Guide
Setup Type Actionable Guidance
📉 Bearish Pullback Entry Short entries near 1.1300–1.1350 with stop above minor resistance
🟡 Demand Reversal Watch Wait for reaction in 1.0950–1.1000, assess volume & candle response
📊 Structure Confirmation Use lower timeframe BOS for entry alignment
🛡️ Risk Management Keep risk below 1% per trade, avoid chasing mid-zone prices
💬 Key Takeaways
EURUSD has completed its accumulation → expansion → manipulation cycle.
We are now entering the rebalancing phase, where the market returns to fair value (demand).
Smart money flow is visible — from engineered highs to controlled selloffs.
The Target + Reversal Zone will likely dictate the next macro direction.

JPYUSD Weekly Analysis (MMC) – Smart Structure & Target Zones🧠 Market Sentiment & Technical Landscape
The JPYUSD currency pair has entered a decisive phase in its multi-week bullish run, driven by structural integrity, smart money behavior, and market psychology. This chart captures a strategic trade progression using the Mind Market Concept (MMC) approach — a hybrid strategy blending curve dynamics, volume imprints, and structural flow to track institutional intent.
We're seeing a powerful alignment of structure, momentum, and volume signals, all pointing to a potential high-probability completion near the upper target/reversal zone.
🔍 In-Depth Technical Breakdown
🔹 1. Curve Support Foundation – The Psychological Bedrock
At the heart of this bullish move lies the Black Mind Curve Support — a dynamic, rounded trendline support based on momentum cycles and structural lows. This curve is not arbitrary; it’s a reflection of where smart money has repeatedly absorbed sell-side liquidity before marking up the price.
Multiple rejections from this zone around 0.00640 – 0.00650 provided confirmation of intent.
The rounded nature of this curve support mimics market accumulation patterns — think of it as a “loading zone” before explosive movement.
🔹 2. Structural Breakout – A Clean Bullish Sequence
Price respected a multi-month resistance line and finally broke out in April–May 2025. The breakout wasn't just technical — it occurred after:
A liquidity sweep below the February-March higher low
A retest of the curve
A sharp bullish engulfing formation on the weekly chart
This combination confirms a high-confidence shift in market structure — transitioning from ranging accumulation to directional markup.
🔹 3. Volume Imprints – Institutional Footprints
The chart highlights a Needed Volume area — this is where previous institutional order blocks likely existed. The strong bullish move into that zone confirms:
Buyers were active and aggressive
The area served as both resistance and a breakout retest
This volume footprint now acts as a supportive launchpad, reaffirming trend continuation logic.
🔹 4. Target + Next Reversal Zone
As price continues climbing, it’s now approaching a critical confluence zone around 0.00720 – 0.00725. This zone is projected using:
Fibonacci extension of the last impulse
Measured move symmetry
Historical supply and resistance (Q3 2024 highs)
This is not just a target — it’s a high-probability reversal area. Expect:
Potential exhaustion candles
Momentum divergence
Institutional profit-taking
📊 MMC Strategy Approach – Trade Blueprint
Parameter Detail
Bias Bullish (until reversal confirmation)
Current Price ~0.00694
Buy Zone 0.00685–0.00690 (pullback entry)
Target Zone 0.00720–0.00725
Curve Support 0.00650–0.00660
Invalidation Clean break below curve or engulfing bear momentum
This MMC-based setup emphasizes patience, psychological precision, and proper confirmation for both entry and exit. The idea is to buy smart (on structure), and exit smarter (at institutional interest zones).
⚠️ Key Trader Insights
Don’t chase — wait for clean entry signals near structure (curve or trendline retest).
Use volume confirmation — don’t trade against low-volume rejections at resistance.
Watch emotional extremes — FOMO at targets often precedes reversal.
Plan for both scenarios:
Continuation → scale partial profits at target
Reversal → shift bias if bearish confirmation aligns with momentum loss
🔖 Summary Outlook
✅ Trend: Bullish continuation, respecting structure
🎯 Immediate Focus: Reaching the 0.0072 Target + Next Reversal Zone
🔄 Actionable Tip: Monitor for rejection/absorption candles in the upper blue zone
💼 Risk Management: Use curve break or engulfing reversal as an exit trigger
This setup reflects high technical confluence and fits into a longer-term institutional roadmap. Whether you're swing trading or intraday scaling within this wave — the logic remains powerful.

EUR/GBP – Bearish Triangle Breakdown in Play (Long-Term Setup)This EUR/GBP weekly chart is flashing a long-term bearish triangle pattern that has finally broken down, signaling potential for a major move to the downside. This setup is packed with high-confluence signals that traders should not ignore.
🔍 Pattern Breakdown:
📐 Bearish Triangle Pattern
The pair has been forming lower highs while maintaining a relatively flat support base, forming a descending triangle, a classically bearish continuation pattern.
The pressure has been building for over 6 years, with buyers failing to make new highs while sellers stepped in aggressively at lower levels.
The triangle support has now been broken, and price is entering a retest phase, which is critical for confirming the breakdown.
🟧 Black Mind Curve Resistance
A unique visual tool here is the Black Mind Curve — a curved trendline that mirrors the psychology of long-term resistance.
This curve has consistently capped price action since the 2009 peak, reinforcing the dominance of sellers in this zone.
Every time price reached this curve, it reversed — confirming it as a dynamic resistance.
🧱 Major Horizontal Resistance Zone
The shaded blue zone around 0.92–0.93 represents a long-term resistance area, which has repeatedly rejected price for over a decade.
This zone also aligns with the Black Mind Curve, adding to the confluence.
The most recent swing high failed to break this area, and the pair rolled over again.
🔄 Retesting in Progress
After the recent breakdown of triangle support, price is currently retesting the underside of the broken support line (now acting as resistance).
This is a textbook setup: break → retest → continuation.
If this retest fails (which is likely based on history), the bearish move should resume.
🎯 Bearish Target Projection
The projected move from the triangle breakdown points to the 0.64330 area, which aligns with a major support level from early 2007 and 2008.
This level is a high-probability magnet if the pattern plays out in full — giving a long-term swing trade or position-trading opportunity.
🧠 Why This Matters (Pro Insights)
This chart is powerful because:
It’s on the weekly timeframe – high conviction and larger moves.
It shows a long-term squeeze finally breaking.
Resistance is reinforced by multiple layers (curve + horizontal zone).
Retest confirms possible continuation sell setup.
This isn’t a short-term scalp — it’s a position trade idea that could develop over months or even a couple years, with a massive risk-reward potential.
⚠️ Trade Plan Summary
Bias: Bearish
Pattern: Descending Triangle (broken)
Current Action: Retesting broken support
Entry Zone: On bearish rejection near 0.8400–0.8450
Stop Loss: Above resistance zone (around 0.9285)
Target: 0.64330
Risk/Reward: Potentially >4:1 on a swing basis

Trend Changing Pattern (TCP) ExplainedIntroduction
One of the most important skills in forex trading is learning how to read price action and understand what the market is telling you. Price is not just numbers — it’s the collective perception of traders, making it the most reliable leading indicator available.
Today, I want to explain a powerful concept known as the Trend Changing Pattern (TCP) — a crucial tool for identifying potential market reversals and shifts in trend direction.
📈 What Is a Trend Changing Pattern?
In any trending market, whether it's an uptrend or downtrend, the trend won’t change easily. The strength of the trend and the timeframe you're trading on will determine how long it takes for a true reversal to occur.
One key signal of a trend change is a shift in momentum:
In an uptrend, when a momentum low forms during a pullback, it can be a sign that the trend is beginning to reverse.
In a downtrend, a momentum high during a pullback can signal a potential bullish reversal.
These are what we refer to as Trend Changing Patterns (TCPs) — moments where the structure of the market starts to shift.
⚠️ Watch for Manipulation After the TCP
After a TCP appears, it's common to see price manipulation before the new trend fully takes hold:
In an uptrend, price may return to manipulate the previous high before continuing down.
In a downtrend, price often dips to manipulate the previous low before reversing higher.
Being aware of this common liquidity grab helps traders avoid being trapped and instead position themselves in alignment with the new trend.
🧠 Final Thoughts
Understanding how to spot and interpret a Trend Changing Pattern gives you a major edge in forex trading. It helps you stay ahead of the market and make informed decisions based on price action, not emotion.
🎥 In the video, I go into more detail about momentum highs and lows, and how to recognize these key patterns in real time. Be sure to check it out if you want to sharpen your trend reversal strategy.
Wishing you success on your trading journey! 🚀

THE KOG REPORT THE KOG REPORT:
In last week’s KOG Report we said we would anticipate a potential curveball and that being that price may just support on the open at the immediate support level and give the move upside into the 3010 and above that 3020 region which was achieved. We then updated traders with the FOMC report suggesting a further move upside into the 3050-55 region which is where we suggested the potential short will come from.
After the push up into the level and then some accumulation, Friday gave us the volume we needed to break away from the range and complete the move downside to end the week.
Again, nearly all of our bias level targets were completed, the bias level worked well, Excalibur performed well and the red box indi’s worked a dream, even in the choppy market conditions.
So, what can we expect in the week ahead?
We have an issue with gold at the moment, although it’s broken the immediate range, it’s still above 3000 with a larger range low around the 2990 and below that 2970-75 region. That potential swing point below is an area of interest for us this week and leading up towards the end of the month. For that reason, if we can support at the first red box below, and continue the move that started on Friday up into those 3025, 3030 and above that 3035-7 price points we’ll want to monitor this careful for a reversal to form. If we can get it, an opportunity to add or take the short may be available to traders, this time in attempt to break below the 3000 level into those lower support level mentioned and shown on the chart, which also correspond with the red boxes. As many of you have seen over the last year or so, we’ve been sharing these indicator boxes on the 4H for the wider community for free, as they are extremely powerful in identifying turning points and entry and exit points for traders. So let’s keep an eye on them this week for the break and closes, RIP’s and rejections.
We’re mostly looking for this one move to complete, however, there has to be a flip! This week, the flip is breaking above that 3035-37 level which will also be this week’s bias level. If we do breach, we’ll be looking at this to then continue higher, breaking 3050 and then resuming the move into the active Excalibur targets above which ideally, we don't want to see happen yet!
So, we know we want higher, what we do want though is better entry levels for the longs, until then, if we can capture these short trades we’ll of course gratefully take them.
KOG’s bias for the week:
Bearish below 3040 with targets below 3010, 3006, 2997, 2985 and below that 2978
Bullish on break of 3040 with targets above 3050, 3055, 3063 and above that 3067
RED BOXES:
Break above 3037 for 3040, 3047, 3050, 3055, 3063 and 3066 in extension of the move
Break below 3010 for 3006, 3000, 2997, 2990 and 2985 in extension of the move
This should give you an idea of your levels, please use them!
Please do support us by hitting the like button, leaving a comment, and giving us a follow. We’ve been doing this for a long time now providing traders with in-depth free analysis on Gold, so your likes and comments are very much appreciated.
As always, trade safe.
KOG
