EUR/NZD. Expecting to move UP to resistance.Yo Traders,
EN has formed a lovely structure to trade next week.
Price rejected the trend line and corrected till the resistance Moving down again as expected.
Price has now formed a double bottom pattern and is at the neckline rejecting it and moving down again
Expecting the price to reject the 200 EMA and break the neckline and move up to resistance which would be great RR for the swing.
Lets wait and watch
Thanks
Madtradex
Forexforecast

NAS100 .. Expecting to move downYo Traders,
Last week i had analysed the NAS100 and expected it to moved down. As soon as the price broke through the wedge i was short on the pair with profits being taken at the support. The price moved exactly as expected with great RR.
Next week as you can see the price has now broken through the channel/support and presently retesting on the 1H TF.
Lets wait and watch if the price moves down and respects the new resistance.
Thanks
Madtradex

GBP/ NZD - Expected downwave in the Long termYo Traders,
Having a look at the GN daily TF it looks like it is forming the sloping down Head and Shoulders pattern. The right shoulder is still being formed almost approaching the neckline.
This is a long term play but from the looks of it price would be headed down for the next couple of weeks if this pattern completes.
I would be looking to go short based on the smaller TF and see how price moves
Lets wait and watch
Thanks
Madtradex

NAS100 .. Expecting to move downYo traders,
Today i thought of trading one of the Indices.
NAS 100 has been on a downtrend and is presently moving in a corrective channel.
As you can see the Swing DE is a rising wedge swing and hence i believe that the price will respect the resistance and move downward.
I will be going short when the price breaks the wedge.
Please like, share and comment
Thanks
Madtradex


Don't miss the great sell opportunity in GBPUSDShort-Term Forecast:
Trading suggestion:
". There is still a possibility of temporary retracement to suggested resistance line (1.3033).
if so, traders can set orders based on Price Action and expect to reach short-term targets."
Technical analysis:
. GBPUSD is in a downtrend and the continuation of downtrend is expected.
. The price is below the 21-Day WEMA which acts as a dynamic resistance.
. The RSI is at 25.
Take Profits:
TP1= @ 1.2802
TP2= @ 1.2733
TP3= @ 1.2609
TP4= @ 1.2525
TP5= @ 1.2259
SL: Break Above R2
❤️ If you find this helpful and want more FREE forecasts in TradingView
. . . . . Please show your support back,
. . . . . . . . Hit the 👍 LIKE button,
. . . . . . . . . . . Drop some feedback below in the comment!
❤️ Your Support is very much 🙏 appreciated! ❤️
💎 Want us to help you become a better Forex trader ?
Now, It's your turn !
Be sure to leave a comment let us know how do you see this opportunity and forecast.
Trade well, ❤️
ForecastCity English Support Team ❤️

Don't miss the great buy opportunity in USDSGDMidterm forecast:
. While the price is above the support 1.3430, beginning of uptrend is expected.
. We make sure when the resistance at 1.3754 breaks.
. If the support at 1.3430 is broken, the short-term forecast -beginning of uptrend- will be invalid.
Technical analysis:
. The RSI downtrend #1 is broken, so the probability of beginning of uptrend is increased.
. A peak is formed in daily chart at 1.3985 on 06/22/2020, so more losses to support(s) 1.3550 and minimum to Major Support (1.3430) is expected.
. Price is below WEMA21, if price rises more, this line can act as dynamic resistance against more gains.
. Relative strength index (RSI) is 50.
Take Profits:
TP1= @1.3754
TP2= @1.3885
TP3= @1.4035
TP4= @1.4270
TP5= @1.4635
TP6 Free
❤️ If you find this helpful and want more FREE forecasts in TradingView
. . . . . Please show your support back,
. . . . . . . . Hit the 👍 LIKE button,
. . . . . . . . . . Drop some feedback below in the comment!
❤️ Your Support is very much 🙏 appreciated! ❤️
💎 Want us to help you become a better Forex trader ?
Now, It's your turn !
Be sure to leave a comment let us know how do you see this opportunity and forecast.
Trade well, ❤️
ForecastCity English Support Team ❤️

GBPJPY price at trend line Supportprice holding support if we hold this support than it can go higher


EUR/USD... Price moving in ascending channelYo Traders,
Price is presently moving in an ascending channel. The price seems to have rejected the support line and moving upwards.
Price seems bullish at the moment but lets wait and watch how this turns out
Please like and comment your thoughts for this pair
Thanks
Madtradex


EURGBP long term short signalThis pair will be falling soon.
Look further down towards 0 88920
Stop loss 0.89520


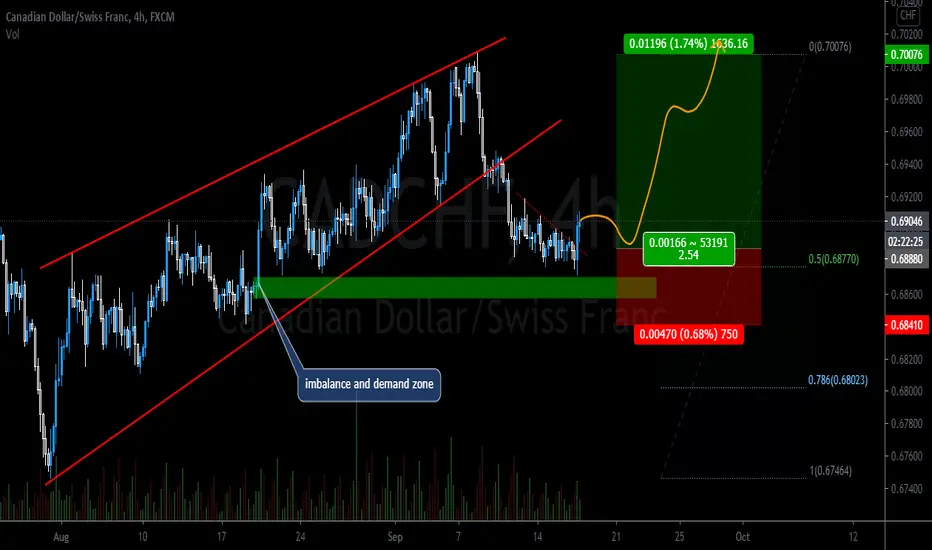
cadchf price at trend line supportprice back to trend line support
waiting for proper movement than add this one into account

GBP/CAD - buying opportunity with strong GBP momentumGBP/CAD has been trading within a respected weekly trend channel since Late-2019. The last touch of this trend channel was on the lower boundary with current expectations now that price will return to the upper boundary. Price has been consistently trading above the 50 and 100 DAY EMA and the posting of an extremely bullish weekly candle last week means that we are looking for long positions this week.
With the current bullish momentum for the British Pound we are expecting at least a re-test of the strong resistance at 1.7718. If price holds above this level a good secondary target would be 1.8040.


GBP/USDHello traders, here is the analysis from our team :
GBPUSD
buy: 1.30998
target : 1.31998
stop : 1.30889
Let us know in the comment section below if you have any questions.😉


USDCAD AB=CD Pattern Forecast Up DirectionWe will wait for Touch Fibonacci 127.20% extension (D point)

EURO/USDHello traders, here is the analysis from our team :
sell @ 1.18017
tp-1 @ 1.18007
tp @ 1.17917
stop @ 1.18117
Money management @ 1.18007
Let us know in the comment section below if you have any questions.😉
