#EURCAD 4HEURCAD 4-Hour Analysis
The EURCAD pair has formed an ascending triangle pattern on the 4-hour chart, but the price has broken down below the triangle's trendline support. This breakdown signals potential bearish momentum, making it a viable sell opportunity.
Technical Outlook:
Pattern: Ascending Triangle and Breakdown Trendline Support
Forecast: Bearish (Sell Opportunity)
Entry Strategy: Enter a sell position following confirmation of bearish momentum, such as a retest of the broken support acting as resistance or continuation of lower highs.
Traders should look for additional confirmation through bearish candlestick patterns and supporting indicators like RSI or MACD. Proper risk management is crucial, with stop-loss orders placed above the retest level and profit targets set at the next key support zones.
Forexmarket

#EURUSD 1HEURUSD 1-Hour Analysis
The EURUSD pair is trading within a downtrend channel on the 1-hour chart and is approaching a key support area near the lower boundary of the channel. This support zone presents a potential buy opportunity as it may act as a reversal point for a short-term bullish move.
Technical Outlook:
Pattern: Downtrend Channel and Support
Forecast: Bullish (Buy Opportunity)
Entry Strategy: Consider entering a buy position near the channel's support line, confirming with bullish price action signals such as a bullish engulfing candlestick or a bounce from the support level.
Traders should ensure proper risk management by placing stop-loss orders below the support level to account for potential breakdowns. Profit targets can be set at the midline or upper boundary of the channel for optimal returns.

TradeCityPro EURJPY Analysis Key Opportunities Ahead👋 Welcome to TradeCityPro Channel!
Let’s move beyond crypto and analyze the popular EUR/JPY currency pair from both fundamental and technical perspectives, preparing for potential triggers in the days ahead.
🌍 Fundamental Overview
Monetary Policy: The ECB’s hawkish stance strengthens the Euro, while the BoJ’s dovish policies weaken the Yen.
Economic Data: Eurozone GDP and inflation drive the Euro, while Japan's industrial performance and exports influence the Yen.
Risk Sentiment: The Yen gains during risk-off scenarios as a safe haven, while the Euro thrives on Eurozone stability.
Geopolitical Events: The Euro reacts to EU political shifts, while the Yen benefits from global tensions, such as those in the Middle East.
Yield Differentials: Higher bond yields in the Eurozone compared to Japan attract capital flows to the Euro.
Current dynamics show the Euro is stronger, but shifts in risk sentiment or changes in BoJ policy could favor the Yen.
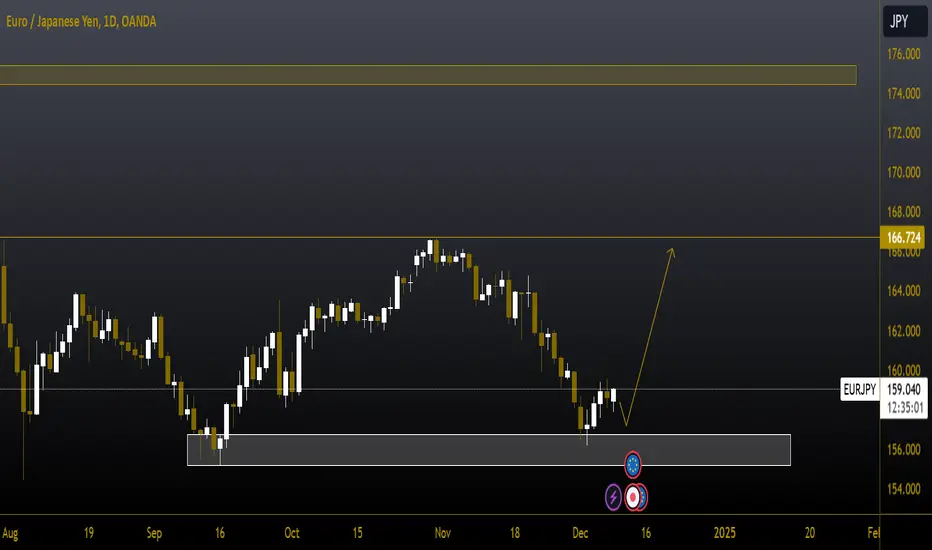
🕒 4-Hour Time Frame
On the 4-hour timeframe, we’ve seen price rejection from the 166.63 resistance level, followed by a downward move. After breaking the descending trendline, the price retraced to the 50% Fibonacci level, creating potential setups:
📈 Long Position Trigger
After breaking the 159.849 level and Fibonacci resistance, a long entry is viable, targeting 162.104. An RSI breakout into overbought territory could add momentum.
📉 Short Position Trigger
If rejected at resistance and breaking below 159.331, a short position is possible, targeting 157.80 or the significant support at 155.119.
Stay alert for confirmations to act on these scenarios.
📝 Final Thoughts
This analysis reflects our opinions and is not financial advice.
Share your thoughts in the comments, and don’t forget to share this analysis with your friends! ❤️

Daily Analysis of GBP to USD - Issue 168The analyst forecasts a rise in the rate of GBP/USD within the next 24 hours. This prediction is based on a quantitative analysis of recent price trends

Daily Analysis of Gold Ounce to USD – Issue 168The analyst forecasts a rise in the price of gold ounces within the next 24 hours. This prediction is based on a quantitative analysis of recent price trends

#USDAUD 1DAYUSDAUD Daily Analysis
The USDAUD pair is trading within an uptrend channel on the daily chart and is currently approaching the resistance line of the channel. This resistance area is a critical zone where selling pressure may emerge, making it a potential sell opportunity if the price shows signs of rejection.
Technical Outlook:
Pattern: Uptrend Channel and Resistance
Forecast: Bearish (Sell Opportunity)
Entry Strategy: Enter a sell position if the price confirms rejection at the resistance line with bearish price action signals.
Traders should monitor for reversal patterns, such as bearish engulfing candlesticks or indicators like RSI signaling overbought conditions. Proper risk management is essential, with stop-loss orders placed above the resistance line and profit targets set near the channel's midline or lower boundary.

#USDCAD 4HUSDCAD 4-Hour Analysis
The USDCAD pair is forming a wedge pattern on the 4-hour chart, with price action showing signs of bearish pressure near the resistance area. Additionally, a sell engulfing candlestick has appeared, reinforcing the likelihood of a downside move. This confluence of bearish signals provides a potential sell opportunity.
Technical Outlook:
Pattern: Wedge and Sell Engulfing Area
Forecast: Bearish (Sell Opportunity)
Entry Strategy: Enter a sell position upon confirmation of continued bearish momentum, such as a break below the wedge's lower boundary.
Traders should watch for additional confirmation through bearish indicators like RSI showing overbought conditions or MACD signaling a bearish crossover. Implement proper risk management by placing stop-loss orders above the sell engulfing area and targeting key support zones below the wedge.

#USDCHF 4HUSDCHF 4-Hour Analysis
The USDCHF pair has broken above a significant trendline on the 4-hour chart, signaling a shift in momentum to the upside. Additionally, a buy engulfing candlestick in the breakout area reinforces the bullish outlook, presenting a potential buy opportunity.
Technical Outlook:
Pattern: Trendline Breakout and Buy Engulfing Area
Forecast: Bullish (Buy Opportunity)
Entry Strategy: Enter a buy position above the breakout level, confirming with bullish price action signals.
Traders should monitor for continued bullish momentum with supportive indicators like RSI or MACD trending upward. Proper risk management is essential, with stop-loss orders placed below the breakout level and profit targets set at higher resistance zones.

#GBPCAD 1DAYGBPCAD Daily Analysis
The GBPCAD pair has broken below a key trendline on the daily chart, signaling potential bearish momentum. After the breakdown, the price is now retesting the trendline from below, which could act as resistance. This setup presents a potential sell opportunity if the price faces rejection at the retest level.
Technical Outlook:
Pattern: Trendline Breakdown and Retest
Forecast:** Bearish (Sell Opportunity)
Entry Strategy:** Enter a sell position if the price confirms rejection at the retested trendline with bearish price action signals.
Traders should look for confirmation such as bearish candlestick patterns (e.g., shooting star or bearish engulfing) or indicators like RSI indicating bearish divergence. Proper risk management is crucial, with stop-loss orders placed above the retested trendline and profit targets set at the next support zones.

#GBPNZD 1DAYGBPNZD Daily Analysis
The GBPNZD pair is trading near the resistance line of an uptrend channel on the daily chart. This level marks a key area where selling pressure could emerge, presenting a potential sell opportunity if the price shows signs of rejection.
Technical Outlook:
Pattern: Uptrend Channel Resistance
Forecast: Bearish (Sell Opportunity)
Entry Strategy: Enter a sell position if the price rejects the channel resistance with bearish confirmation signals.
Traders should watch for reversal patterns, such as bearish engulfing candlesticks or indicators like RSI showing overbought conditions. Implement proper risk management by placing stop-loss orders above the resistance line, with profit targets set at the midline or lower boundary of the channel.

AUDCAD SELLING OPPORTUNITYOANDA:AUDCAD
Audcad is in bearish trend , possible short opportunity.broke stracture to the downside.

Daily Analysis of GBP to USD – Issue 167The analyst forecasts a rise in the rate of GBP/USD within the next 24 hours. This prediction is based on a quantitative analysis of recent price trends

Daily Analysis of Gold Ounce to USD – Issue 167The analyst forecasts a rise in the price of gold ounces within the next 24 hours. This prediction is based on a quantitative analysis of recent price trends

December 11 2024 - Buy Limit Activated GBPJPY TRADEAs I checked one of my favorite pair in forex, I noticed that gbpjpy moving a bullish direction. One thing is certain here I will ride the pullback if supply was introduced in this market aiming for buy limit pending order in important swing low with demand. If you will noticed my chart during london session supply was introduced to mitigate Demand zone with validity. I like to trade demand and supply area with "PROOF". Please check my charts for additional information.
RR: 1:4
Intraday (London-New york Session )
ATR: during that time = 10
#wyckoff
#supplyand demand

#EURCHF 1DAYEURCHF Daily Analysis
The EURCHF pair is approaching a key support level on the daily chart, a zone where buying interest has consistently emerged. This support area offers a potential bullish setup, with the likelihood of a price rebound if the level holds.
Technical Outlook:
Pattern: Support
Forecast: Bullish (Buy Opportunity)
Entry Strategy: Look for confirmation of support holding with bullish price action signals before entering a buy position.
Traders should monitor for reversal candlestick patterns, such as bullish engulfing or hammer formations, and supportive indicators like RSI signaling oversold conditions. Employ proper risk management by placing stop-loss orders below the support level and targeting resistance zones for potential profit.

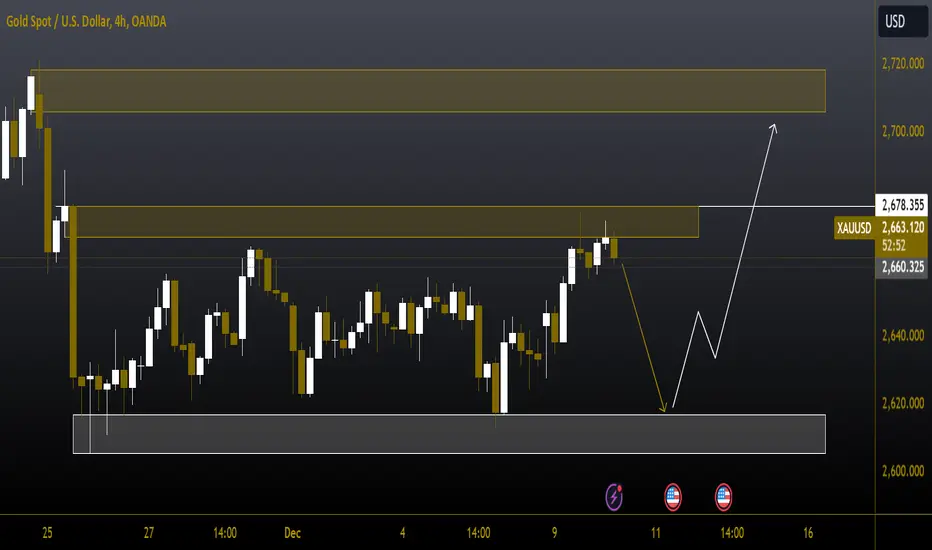
#XAUUSD 4HXAUUSD 4-Hour Analysis
The XAUUSD pair has formed a bearish engulfing candlestick pattern on the 4-hour chart, indicating strong selling pressure. This pattern suggests a potential downside move, especially if the price breaks below nearby support levels, confirming the bearish sentiment.
Technical OutloOK
Pattern: Sell Engulfing
Forecast: Bearish (Sell Opportunity)
Entry Strategy: Enter a sell position after confirmation of further bearish momentum, such as a break below immediate support.
Traders should watch for continued selling pressure supported by indicators like RSI or MACD showing bearish divergence. Proper risk management is crucial, with stop-loss orders placed above the high of the engulfing candlestick. Profit targets can be set at the next key support zones for optimal returns.
AUDUSD 1DAYAUDUSD Daily Analysis
The AUDUSD pair is trading near a significant support level on the daily chart, where buyers have historically stepped in to drive prices higher. This key zone suggests a potential bullish reversal, making it an attractive area for a buy opportunity.
Technical Outlook:
Pattern: Support
Forecast: Bullish (Buy Opportunity)
Entry Strategy: Enter a buy position near the support level after confirming bullish price action signals.
Traders should monitor for reversal patterns such as a bullish engulfing candlestick or indicators like RSI signaling oversold conditions. Proper risk management is essential, with stop-loss orders placed below the support level to guard against potential breakdowns. Targets can be set at the next resistance levels for potential profit.

#AUDCAD 4HAUDCAD 4-Hour Analysis
The AUDCAD pair has broken above a key trendline on the 4-hour chart, signaling a potential shift in momentum to the upside. Additionally, the presence of a buy engulfing candlestick in the breakout area reinforces the bullish outlook. This combination of technical signals presents a strong opportunity for a buy position.
Technical Outlook:
Pattern: Trendline Breakout & Buy Engulfing Area
Forecast: Bullish (Buy Opportunity)
Entry Strategy: Enter a buy position above the trendline breakout level, confirming with bullish price action signals.
Traders should look for additional confirmation such as continued bullish candlesticks or supportive indicators like RSI and MACD trending upwards. Place stop-loss orders below the breakout level to manage risk, and target higher resistance zones for potential profit.

#USDDKK 4HUSDDKK 4-Hour Analysis
The USDDKK pair is forming a descending triangle pattern on the 4-hour chart, a bearish continuation pattern that indicates the potential for further downside. The price is consolidating near the support line, and a breakout below this level would confirm the bearish setup.
Technical Outlook:
Pattern: Descending Triangle
Forecast: Bearish (Sell Opportunity)
Entry Strategy: Enter a sell position after a confirmed breakout below the triangle’s support line.
Traders should look for confirmation such as a strong bearish candlestick closing below the support level or increased selling volume. Proper risk management is crucial, with stop-loss orders placed above the upper boundary of the triangle. Profit targets can be set at the next key support levels, aligning with the measured move from the triangle’s height.

#USDCHF 4HUSDCHF 4-Hour Analysis
The USDCHF pair is forming a head and shoulders pattern on the 4-hour chart, aligning with a trendline resistance level. This confluence of bearish signals suggests potential downside momentum if the price breaks below the neckline of the pattern. The trendline resistance strengthens the case for a sell position.
Technical Outlook:
Pattern: Head & Shoulders and Trendline Resistance
Forecast: Bearish (Sell Opportunity)
Entry Strategy: Sell upon a confirmed break below the neckline of the head and shoulders pattern.
Traders should look for confirmation such as bearish candlestick patterns (e.g., bearish engulfing) or indicators like RSI showing bearish divergence. Place stop-loss orders above the trendline resistance to manage risk effectively. Profit targets can be set at lower support levels or based on the measured move from the head and shoulders pattern.

#EURUSD 4HEURUSD 4-Hour Analysis
The EURUSD pair is forming a head and shoulders pattern on the 4-hour chart, which is typically a bearish reversal signal. However, in this case, the price action suggests a potential invalidation of the pattern, favoring a bullish breakout scenario. If the neckline resistance is broken, it could provide a buy opportunity.
Technical Outlook:
Pattern: Head and Shoulders (Potential Breakout)
Forecast: Bullish (Buy Opportunity)
Entry Strategy: Enter a buy position upon a confirmed breakout above the neckline resistance with strong bullish momentum.
Traders should monitor for bullish confirmation such as a breakout candlestick with increased volume or indicators like MACD signaling upward momentum. Proper risk management is crucial, with stop-loss orders placed below the neckline and profit targets set at the next resistance levels.

#EURJPY 4HEURJPY 4-Hour Analysis
The EURJPY pair is trading near a key support level on the 4-hour chart, a zone where buyers have previously stepped in to push prices higher. This support area presents a potential buying opportunity if the price shows signs of holding above this level.
Technical Outlook:
Pattern: Support
Forecast: Bullish (Buy Opportunity)
Entry Strategy: Enter a buy position near the support level, confirming with bullish price action.
Traders should look for confirmation such as bullish candlestick patterns (e.g., bullish engulfing or pin bar) or indicators like RSI signaling oversold conditions. Proper risk management is essential, with stop-loss orders placed below the support level and profit targets set at the next resistance zone.
#GBPJPY DAILYGBPJPY Daily Analysis
The GBPJPY pair is approaching a significant resistance level on the daily chart, where selling pressure has historically emerged. This zone indicates a potential reversal area, providing an opportunity for a sell position if the price fails to break above the resistance.
Technical Outlook:
Pattern: Resistance
Forecast: Bearish (Sell Opportunity)
Entry Strategy: Enter a sell position if the price shows rejection at the resistance level.
Traders should monitor for bearish signals such as reversal candlestick patterns (e.g., shooting star or bearish engulfing) or indicators like RSI reflecting overbought conditions. Proper risk management is essential, with stop-loss orders placed above the resistance level and targets set at nearby support zones.
