EURO-USD BUY STRONG 1. "EUR/USD Strong Buy Alert 🚀 | Key support zone holding firm – bulls eyeing the next leg up!"
2. "Strong Buy Zone ✅ | EUR/USD showing bullish momentum from this support level – eyes on 1.09+"
3. "EUR/USD Reversal Zone 💥 | Buyers stepping in strong – potential rally ahead!"
4. "Watch this zone! EUR/USD strong buy setup forming – bullish confirmation underway 📈"
5. "EUR/USD bouncing from key demand zone 🔥 | Technicals align for a strong buy signal!"
Forexmarket

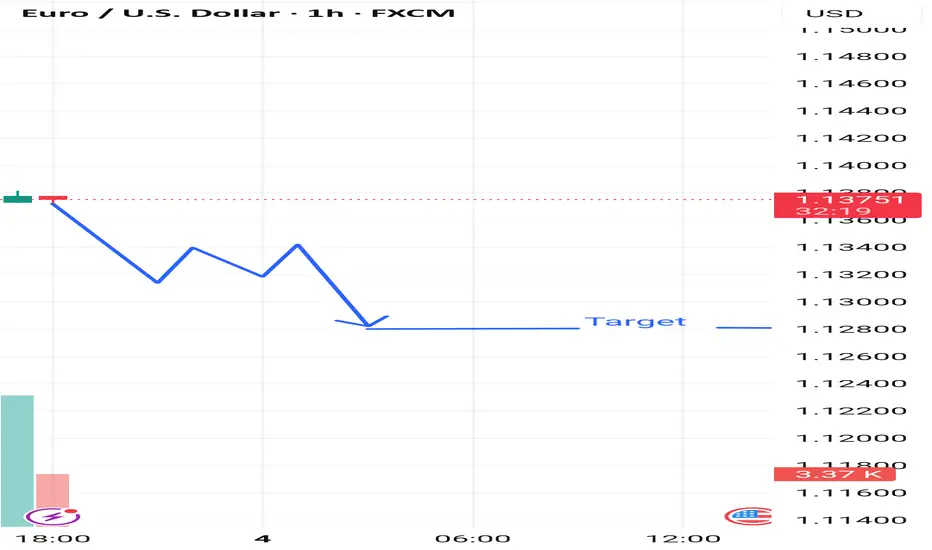
Market next move Disruption of the Downtrend Analysis
The chart currently suggests a bearish breakout with a downside target near 1.12900. Let’s challenge that:
---
🟩 Bullish Reversal Possibility
1. Support Zone Near 1.1370:
Price has shown signs of stabilizing around the 1.1370 level.
Multiple wicks below the candles suggest buyer interest at this level.
2. Low Volume on Recent Red Candles:
A decreasing volume trend on recent red candles can indicate weak bearish momentum.
Bulls may be waiting to enter on a breakout above the 1.1380–1.1390 zone.
3. Potential for Fakeout:
The sharp expected drop might be a bear trap.
If price breaks back above 1.1385 with strong volume, it could invalidate the bearish thesis.
4. RSI/Momentum Divergence (Assumed):
If momentum indicators (not shown) display bullish divergence, this strengthens the case for a reversal
USDCAD Rebound from Key Support – Bullish Setup in PlayUSDCAD pair has reached a technical inflection point at key support around 1.3700, where it is attempting a rebound after several days of bearish momentum. With recent Canadian data showing underlying economic strain and the U.S. dollar reacting to rate expectations and tariff news, this area becomes crucial for the next directional move.
🔍 Technical Analysis
Support Level: Price has respected the horizontal support at 1.3700–1.3685, forming a possible double-bottom structure on the 4H chart.
Bullish Reversal Zone: The latest candle shows a strong rejection wick at the support zone, suggesting bullish interest. The structure aligns with a classic bullish reversal pattern.
Target Zones:
First TP: 1.3849 (previous high / supply zone).
Second TP: 1.3860–1.3870 (Fibonacci extension + minor resistance).
Invalidation (SL): Below 1.3685, further downside may open to 1.3632.
🧠 Fundamental Context
U.S. Side:
GDP and NFP data have recently come out mixed, reducing the immediate pressure on the Fed to hike rates further.
Tariff uncertainty and appeal plans by the Trump administration are increasing near-term USD volatility.
US bond yields are firming again, giving the dollar mild support.
Canada Side:
Canadian Q1 GDP disappointed at 0.1%, lower than expected.
BoC is likely to hold rates steady, but the economy shows weak business investment and softening consumption growth.
Crude oil, Canada’s key export, is still under pressure, slightly weakening CAD.
✅ Conclusion
This setup favors a short-term long on USDCAD from current levels, targeting the upper resistance zone at 1.3849–1.3860. A break and close above 1.3870 could extend toward 1.3900. However, caution should be exercised with upcoming U.S. labor and trade data that may fuel volatility.

XAUUSD: Break or Bounce at ResistanceGold has reached a critical technical zone near a long-term descending trendline and horizontal resistance around $3360–3380. Price action suggests a make-or-break moment is unfolding.
Key Technical Structure:
Descending Trendline Resistance from the April high capped the rally.
Current move has formed a rising wedge — typically bearish if broken.
Price is testing resistance confluence — a rejection could send Gold lower.
Scenarios to Watch:
🔹 Bullish Breakout:
Clean breakout and close above $3380 confirms trendline invalidation.
Upside projection points to $3500 — previous high and psychological level.
🔹 Bearish Rejection:
Failure to break the trendline + wedge breakdown can drag price to:
$3280 (38.2% Fib)
$3160–3200 zone (61.8% Fib + demand area)
Macro Factors to Watch:
Tariff escalation between US–EU could trigger risk-off → bullish for Gold.
FOMC policy pause, weak job data, or inflation rebound also support upside.
Stronger USD or yield spike may trigger wedge breakdown → bearish.
Conclusion:
XAUUSD is at a key inflection point. Wait for confirmation: either a clean breakout or a clear reversal rejection. Trade the resolution, not the anticipation.

DXY Short-Term Reversal Zone in SightUS Dollar Index (DXY) is approaching a strong support zone at 98.90–98.00, which has historically acted as a base for bullish reversals. The price is now testing the lower bound of this zone after a steady downtrend from the 101.94 high.
Key Technical Structure:
Support Zone: 98.90–98.00 (tested 3+ times)
Double Bottom Potential forming if bulls hold the zone
Upside Targets:
101.94: Key horizontal resistance
103.50: Swing high from early April
Scenarios to Watch:
🔹 Bullish Rebound:
Price bounces off 98.90–98.00 support
Confirmation: Break and close above 100.50 near-term resistance
Could fuel move back to 101.94, possibly 103.50
🔹 Bearish Breakdown:
Daily close below 98.00 would invalidate bullish setup
Opens downside to 97.00 and even 95.50
Macro Drivers to Watch:
FOMC speakers and interest rate guidance
US jobless claims or inflation surprise
Risk-off sentiment (benefits USD) vs. continued global risk appetite
Conclusion:
DXY is trading at a make-or-break support zone. Watch for clear bullish reaction or bearish breakdown before committing. The setup favors a bounce unless 98.00 fails.

Can Potentially move upwards from here?Bitcoin just created an inducement and it has been hunted. Now the structure is also broken and the inducement is also taken out. The market is in a discount zone, and there's an overlap of a Breaker Block and FVG (Fair Value Gap), which indicates that the market can potentially move upwards from here.
Wait for bullish confirmations here, such as MSS (Market Structure Shift), CISD (Change in Character/Continuation of Internal Structure Dynamics), and failed selling PD Arrays!
Do Your Own Research (DYOR)! This is not financial advice.

EURNZDHello Traders! 👋
What are your thoughts on EURNZD?
The EURNZD pair is currently trading below a key resistance zone, showing signs of hesitation near this level.
We expect the price to consolidate briefly within this area, and then decline toward the specified support level if the resistance holds.
As long as the pair remains below resistance, the bearish bias remains intact, and a move lower is likely.
Don’t forget to like and share your thoughts in the comments! ❤️

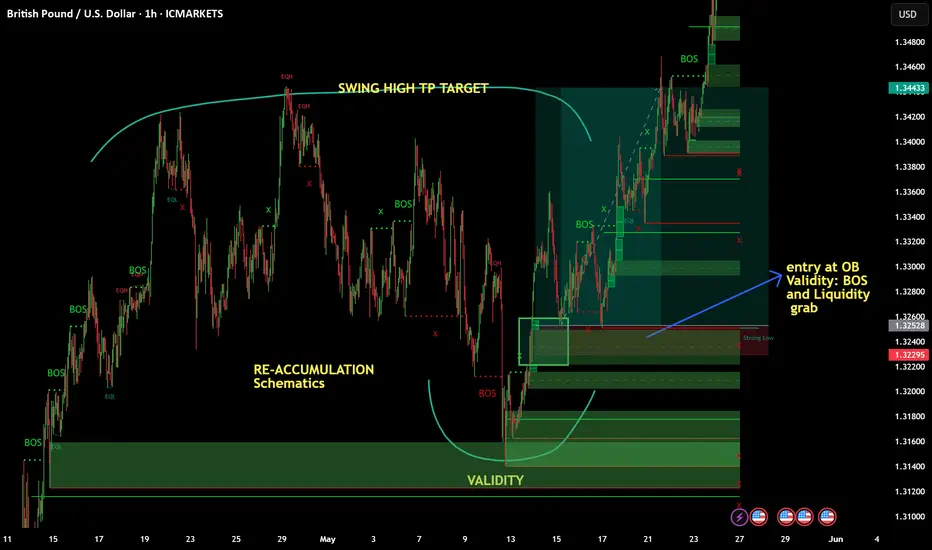
May 25 2025- BUY TRADE LIMIT order activated GBPUSDHi folks!
-Been busy lately so I dont consistently post. Attached here is the chart of GBPUSD, A classic re-accumulation in 1H timeframe. Before I got this trade It took me 1 week to monitor the schematics of this wyckoff re-accumulation. It came to fruition last Thursday so I monitor for buy Limit order entry within 1H to 15 min. charts. Validity here was the liquidity grab of re-accumulation ( check the image for clear caption).
TP: 8RR
Risk: 0.05% of Account
-Proprietary Trader
#wyckoff
#supplyanddemand
#refinement
How to Rob the Bank (of Canada) – Legally! (USD/CAD Swing Trade)🌍 Hello Global Traders! 🌟
Money Makers, Risk Takers, and Market Shakers! 🤑💸✈️
Dive into our USD/CAD "The Loonie" Forex heist, crafted with the signature 🔥Thief Trading Style🔥, blending sharp technicals and deep fundamentals. Follow the strategy outlined in the TradingView chart, focusing on a long entry targeting the high-risk MA Zone. Expect a wild ride with overbought conditions, consolidation, and potential trend reversals where bearish players lurk. 🏆💰 Celebrate your wins, traders—you’ve earned it! 💪🎉
Entry 📈: The vault’s open! Grab bullish opportunities at any price, but for precision, set buy limit orders on a 15 or 30-minute timeframe near swing lows or highs for pullback entries.
Stop Loss 🛑:
📍 Place your Thief SL at the recent swing low on the 4H timeframe (1.38500) for scalping or day trades.
📍 Adjust SL based on your risk tolerance, lot size, and number of open orders.
Target 🎯: Aim for 1.42500
💵 USD/CAD "The Loonie" is riding a bullish wave, fueled by key market drivers. ☝
Unlock the full picture—dive into Fundamentals, Macro Insights, COT Reports, Quantitative Analysis, Sentiment Outlook, Intermarket Trends, and Future Targets. Check 👉🌎🔗.
⚠️ Trading Alert: News & Position Management 📰🚨
News can shake the market hard. Protect your trades by:
Avoiding new entries during news releases.
Using trailing stops to lock in profits and shield running positions.
📌 Markets move fast—stay sharp, keep learning, and adapt your strategy as conditions evolve.
💖 Power up our heist! 🚀 Tap the Boost Button to amplify our Thief Trading Style and make stealing profits a breeze. Join our crew, grow stronger, and conquer the markets daily with ease. 🏆🤝❤️
Catch you at the next heist, traders—stay ready! 🤑🐱👤🤩

GBP/AUD Forex Heist - Bearish Breakout Blitz!🔥 Thief Trading Style: GBP/AUD Bearish Heist Plan 🔥
Hello, Profit Pirates & Market Marauders! 🤑
Get ready to raid the GBP/AUD (Pound vs. Aussie) forex market with a slick bearish strategy! 📊 Our Thief Trading Style fuses technical precision and fundamental insights to target a sharp downside move. Follow this charted plan to hit the high-risk Blue MA Zone and slip away with profits. Let’s make this heist count! 💪🎯
---
📊 Heist Blueprint: Trade Setup
- Market: GBP/AUD (Forex) 🌐
- Bias: Bearish Breakout 🌟
- Timeframe: 4H (Scalping/Day Trade) ⏰
Entry 📉:
- Breakout Move: Wait for a confirmed break below the Neutral Level at 2.05300. Place Sell Stop orders just below 2.05300 to ride the bearish wave. 🚀
- Pullback Play: For safer entries, set Sell Limit orders at the nearest 15M/30M swing high (e.g., 2.05600-2.05800) after a support break for pullback trades. 📍
- Trader Tip: Set a TradingView alert for the 2.05300 breakout to catch the action live! 🔔
Stop Loss 🛑:
- Breakout Traders: After the break confirms, place your Stop Loss above the recent 4H swing high at 2.08000 to shield against reversals. ⚠️
- Pullback Traders: Adjust Stop Loss based on your risk (e.g., 1-2% of account). Factor in lot size and multiple orders for precision. 📏
- Risk Alert: This is a high-octane heist! Keep position sizes tight to protect your capital. 🔥
Target 🎯:
- Aim for 2.03200, near the risky Blue MA Zone (an oversold area with potential consolidation or reversal). 🏴☠️
- Exit Strategy: Take profits early if bullish signals (e.g., pin bars, high volume) appear near 2.03200. 💸
Scalpers 👀:
- Focus on short-side scalps with tight trailing stops. Pair with day traders for the full heist or snag quick pips if your account supports it. 💰
---
📡 Why This Heist Could Pay Off
GBP/AUD is showing bearish momentum, fueled by:
- Technicals: A break below 2.05300, backed by lower highs on the 4H chart, signals strong downside potential. 📊
- Fundamentals: Weak UK economic data and Aussie strength (check COT reports) support a bearish outlook. 📰
- Seasonal Trends: GBP/AUD often softens in Q2 due to macroeconomic shifts. 📅
- Intermarket Factors: AUD’s correlation with commodity prices could pressure GBP lower. 🌎
---
⚠️ Risk Management: Guard Your Loot
- News Caution: Avoid new trades during high-impact events (e.g., UK CPI, RBA minutes) to sidestep volatility spikes. 🗞️
- Trailing Stops: Use trailing Stop Loss to secure profits as price approaches 2.03200. 🔒
- Position Sizing: Cap risk at 1-2% of your account per trade to stay in the game. 🚨
---
💥 Fuel the Heist! 💥
Join our Thief Trading Style crew by liking, commenting, and following for more electrifying trade plans! 🚀 Your support powers our market raids, helping us score profits with flair. Let’s dominate GBP/AUD together! 🤝🏆🎉
Hashtags: #GBPAUD #Forex #Bearish #DayTrading #Scalping #Breakout
Stay Alert: Another heist is brewing. Keep your charts primed, traders! 🐱👤😎

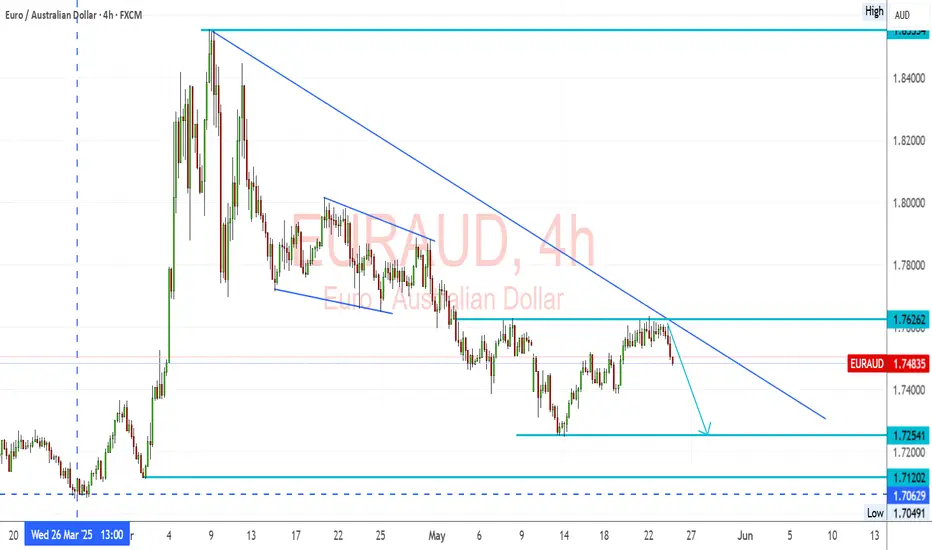
EURAUD – Trendline Holds, Bearish Setup Below 1.7626EURAUD Trend: EURAUD pair remains in a strong downtrend, marked by consistent lower highs and a descending trendline.
Resistance: 1.7626 has been retested and rejected, confirming it as a short-term ceiling.
Structure: The latest rejection from both horizontal resistance and the trendline confirms bearish intent.
🔽 Bearish Targets:
1.7254 – minor support and near-term target
1.7120 – stronger support zone
1.7060 – previous low and potential extended target
A clear break below 1.7400 could confirm continuation of the trend toward those levels.
Fundamental Overview:
🔻 EUR Weakness:
The Eurozone is slowing, particularly in Germany and France.
ECB remains cautious; recent comments show concern about tight financial conditions and sticky inflation.
Political uncertainties and mixed data prints are adding pressure.
🟢 AUD Support:
The RBA remains firm with hawkish language, holding rates while global peers lean dovish.
Commodities remain stable, and Australia benefits from demand out of Asia.
Domestic data (jobs and retail) shows surprising resilience.
Summary:
Bias: Bearish below 1.7626
Break Trigger: 1.7400
Target Range: 1.7250 – 1.7060
Fundamentals: Favor AUD on stronger economic footing and RBA policy tone
📉 EURAUD looks ready for another leg lower unless we see a breakout above 1.7630 with conviction.
GBPUSD Short-Term Top Forming Target 1.3360GBPUSD has bounced slightly, but the structure remains heavy and indecisive. However, EURUSD and Gold 4H charts are starting to break down clearly.
EURUSD is dragging lower step by step.
Gold broke a key support zone.
Both are signaling that USD strength is returning — and GBPUSD is likely to follow.
🔍 Technical View
Price rejected from the 1.3465–1.3470 zone (FOMC CPI high)
Lower highs building on the 1H and 4H timeframes
Trading below the 50% retracement of the recent CPI rally
🧠 Key Observation
“A sharp drop on EURUSD from current price will confirm a top is in place on GBPUSD.”
If EURUSD breaks 1.1270 decisively, expect GBPUSD to follow with increased momentum.
🔽 Trade Bias
Bearish below 1.3435
Targets:
1.3360 (first fib cluster + liquidity pocket)
1.3330 (full wave completion)
Invalidation: Clear close above 1.3470
⚠️ Watch for:
U.S. PMI revisions or FOMC speakers to fuel USD move
GBP Retail Sales data tomorrow — potential catalyst

NZD/JPY Breaks Wedge Structure – Bearish Setup Targets 82.42NZD/JPY has broken down from a rising wedge and failed to reclaim upper support, now acting as resistance. The structure is cleanly bearish on the 4H chart, with rejection near 85.60 and a confirmed lower high. Weak New Zealand data and rising safe-haven demand for JPY add weight to this technical setup. Price looks poised to extend toward 82.42 and possibly 80.99 if momentum builds. Bearish bias is valid unless price closes above 87.17.
🔍 Technical Analysis
Chart Pattern: Rising wedge → broken → retest failed
Bear Flag: Forming below wedge base, suggesting further downside
Resistance Area: 85.60–87.17
Bearish Structure:
Lower highs and bearish candle formations
Price unable to reclaim former support trendline
Support Targets:
First TP: 84.00 – minor support, fib confluence
Second TP: 82.42 – March swing low
Final TP: 81.00 zone – next fib cluster
🌍 Macro Fundamentals
🇳🇿 New Zealand Dollar (NZD)
Retail Sales missed: 0.0% vs 0.9% forecast → consumer sector is slowing
Core Retail Sales weak: 0.7% vs 1.4%
Dairy auction (GDT Index) down -0.9% → key export underperforming
Implication: Risk of slower growth → RBNZ may shift toward neutral/dovish stance
🇯🇵 Japanese Yen (JPY)
JPY supported by risk-off flows due to:
U.S. credit downgrade
Iran-US nuclear tension
Declining global PMI forecasts
Yen strengthens as traders seek safe havens despite BoJ’s dovish baseline
🎯 Trade Plan
Bias: Bearish
Entry Zone: 85.50–85.60 (confirmation area)
Targets:
TP1: 84.00
TP2: 82.42
TP3: 81.00
Stop Loss: Above 87.17 (invalidates wedge breakdown)
⚠️ What to Watch
China sentiment or surprise stimulus (may support NZD)
Sharp equity rallies (could reduce JPY demand short-term)
If NZD/JPY closes above 86.00, reduce position or stay out
🧭 Conclusion
NZD/JPY has rolled over from a broken rising wedge, now forming a clean bearish continuation structure. Weak NZ data and macro risk flows into JPY favor downside extension. This setup offers clear levels, defined risk, and macro alignment — ideal for disciplined short entries.

At this point market successfully taped into the!Gold Market Analysis – Bullish Momentum Building
Gold has recently broken through a significant call option (CE) resistance level, signaling heightened bullish aggression among market participants. This breakout suggests that buyers are currently in control, pushing prices decisively above the CE threshold.
At this point, the market has successfully tapped into the previous swing low liquidity and appears to be forming buy-side liquidity above the current price action. With this structure, we anticipate a potential move toward the Fair Value Gap (FVG) zone marked on the chart. A clean breakout above this FVG, followed by a retest and successful hold of that level, would serve as a strong confirmation of continued bullish intent.
Should this scenario play out, our next upside targets lie in the 3320–3330 range. Traders are advised to monitor price action closely and wait for confirmation signals before making entries. Strategic decision-making is key—avoid emotional trading and prioritize high-probability setups.
Disclaimer: This analysis is for educational and informational purposes only and does not constitute financial advice. Always conduct your own research (DYOR) before making any investment decisions.

Market next move Bearish Counter-Analysis:
1. Resistance Zone Saturation:
The red box shows repeated tests of the resistance area around $33.14–$33.20. This can suggest exhaustion instead of momentum.
Multiple failed attempts to break this zone can result in bearish rejection.
2. Volume Divergence:
The volume appears to be declining even as price approaches resistance. This divergence can imply a lack of buyer strength, which is a red flag for a bullish continuation.
3. Possible Bull Trap:
A sharp move above resistance followed by a quick drop back inside (false breakout) could trap long traders.
This may be followed by a sharp sell-off toward the previous support level (~$32.60–$32.80).
4. Candlestick Patterns:
Watch closely for bearish candlestick patterns like doji, shooting star, or bearish engulfing in the red box. Their appearance would strengthen a bearish reversal case.
5. MACD/RSI (if available):
If the RSI is overbought or MACD shows a bearish crossover, it would reinforce the possibility of a downward retracement.

"Dare to Swipe EUR/USD Gains with Our Risky Heist Blueprint?"Ultimate EUR/USD Heist Plan: Snag Profits with the Thief Trading Strategy! 🚀💰
🌍 Greetings, Wealth Raiders! Ciao, Hello, Bonjour, Hola! 🌟
Fellow profit hunters, get ready to crack the EUR/USD "The Fiber" Forex vault with our slick Thief Trading Strategy! 🤑💸 This plan blends razor-sharp technicals and fundamentals to loot the market. Follow the chart’s long-entry blueprint to strike at high-risk zones like the Red MA (short-term traders) or the Red Zone Resistance (long-term traders). It’s a wild ride—overbought conditions, consolidation, and potential trend reversals mean bears are lurking! 🐻 Stay sharp, grab your profits, and treat yourself—you’ve earned it! 🎉💪
📈 Entry: Storm the Vault!
The market’s ripe for a bullish grab! 💥 Place buy limit orders within the most recent 15 or 30-minute swing low/high levels. Set alerts on your chart to stay locked in. 🔔
🛑 Stop Loss: Guard Your Loot!
Set your Thief SL at the nearest swing low on the 4H timeframe for day/swing trades. Adjust based on your risk tolerance, lot size, and number of orders. Safety first! 🔒
🎯 Targets: Claim Your Prize!
🏴☠️ Short-Term Target: 1.14700
🏴☠️ Long-Term Target: 1.17000
👀 Scalpers, Listen Up!
Stick to long-side scalps. Got deep pockets? Jump in now! Otherwise, join swing traders for the heist. Use trailing stop-loss to lock in gains and protect your stash. 💰
🐂 Why EUR/USD is Hot!
The Fiber’s bullish surge is fueled by key fundamentals. Dive into Macro, COT Reports, Quantitative Analysis, Sentiment, Intermarket trends, and future targets via the linkss below for the full scoop. 👉🔗. Stay informed to stay ahead! 📰
⚠️ Trading Alert: News & Position Management
News releases can shake the market like a heist gone wrong! 🗞️ To protect your profits:
🚫 Avoid new trades during news events.
🛡️ Use trailing stops to secure running positions.
💥 Boost the Heist!
Hit the Boost Button to supercharge our Thief Trading Strategy! 💪 Every click strengthens our crew, making it easier to swipe profits daily. Join the squad, trade smart, and let’s make money rain! 🌧️💵

USDCAD Consolidation Within Bullish Flag – Targets 1.4130USDCAD is consolidating inside a descending flag structure following a strong impulsive rally earlier in May. The current pullback is orderly and corrective, indicating potential for continuation higher. If price breaks above 1.3960, this flag breakout could extend toward 1.4130 and possibly 1.4225. With CAD weakening on soft oil prices and USD regaining strength from yield-driven flows, the bias remains bullish while price stays above 1.3870.
🔍 Technical Analysis
Pattern: Bullish flag forming after a strong rally
Support Zone: 1.3870–1.3900 → base of flag
Resistance/Breakout Zone: 1.3960–1.3980 → upper flag line
Structure:
Higher lows holding firm
Fib confluence near 1.3933 (23.6% retracement)
Target Levels:
1.4130 – 50% fib level + previous structure resistance
1.4225 – 61.8% fib zone from March–April high
📈 Bias: Bullish continuation on breakout
🌍 Fundamental Context
🇺🇸 U.S. Dollar (USD)
Supported by:
Higher bond yields
Fed expected to hold rates higher for longer
Safe-haven inflows post-Moody’s downgrade fading
USD Index recovering broadly across majors
🇨🇦 Canadian Dollar (CAD)
Oil prices softening due to global demand concerns (China slowdown, US inventories)
BoC likely done hiking — no fresh bullish catalysts
CAD correlation with crude oil adds downside risk if energy markets weaken further
🎯 Trade Plan
Entry: Break and close above 1.3960
Stop Loss: Below 1.3870 (flag support zone)
Targets:
TP1: 1.4130 (structure resistance + fib level)
TP2: 1.4225 (swing high + golden ratio)
⚠️ Risk Factors to Watch
If USD sentiment shifts (e.g., dovish Fed speaker) → breakout may fail
Crude oil rebound would support CAD and cap USD/CAD upside
False breakouts common near 1.3960 — wait for confirmation (strong candle close)
🧭 Conclusion
USD/CAD remains in a bullish consolidation phase with a clear continuation setup. A break above 1.3960 would confirm a flag breakout targeting 1.4130 and 1.4225. With the macro backdrop favoring the USD and energy-linked CAD weakening, this setup offers clean structure and potential for follow-through.

EUR/JPY "Yuppy" Heist: Sniping Swiss Profits with Thief Trading!🌍 Hello Global Traders! 🌟
Money Makers, Risk Takers, and Market Shakers! 🤑💸✈️
Dive into our EUR/JPY "Yuppy" Forex heist, crafted with the signature 🔥Thief Trading Style🔥, blending sharp technicals and deep fundamentals. Follow the strategy outlined in the TradingView chart, focusing on a long entry targeting the high-risk MA Zone. Expect a wild ride with overbought conditions, consolidation, and potential trend reversals where bearish players lurk. 🏆💰 Celebrate your wins, traders—you’ve earned it! 💪🎉
Entry 📈: The vault’s open! Grab bullish opportunities at any price, but for precision, set buy limit orders on a 15 or 30-minute timeframe near swing lows or highs for pullback entries.
Stop Loss 🛑:
📍 Place your Thief SL at the recent swing low on the 4H timeframe (163.00) for scalping or day trades.
📍 Adjust SL based on your risk tolerance, lot size, and number of open orders.
Target 🎯: Aim for 167.00
💵 EUR/JPY "Yuppy" is riding a bullish wave, fueled by key market drivers. ☝
Unlock the full picture—dive into Fundamentals, Macro Insights, COT Reports, Quantitative Analysis, Sentiment Outlook, Intermarket Trends, and Future Targets. Check 👉🌎🔗.
⚠️ Trading Alert: News & Position Management 📰🚨
News can shake the market hard. Protect your trades by:
Avoiding new entries during news releases.
Using trailing stops to lock in profits and shield running positions.
📌 Markets move fast—stay sharp, keep learning, and adapt your strategy as conditions evolve.
💖 Power up our heist! 🚀 Tap the Boost Button to amplify our Thief Trading Style and make stealing profits a breeze. Join our crew, grow stronger, and conquer the markets daily with ease. 🏆🤝❤️
Catch you at the next heist, traders—stay ready! 🤑🐱👤🤩

Market next moveBearish Disruption Scenario:
1. False Breakout Trap:
If the price breaks above the rectangle but lacks strong volume or fails to sustain above resistance, it may turn into a bull trap.
This could lead to a sharp reversal and shake out long positions.
2. Volume Divergence:
Notice that volume is decreasing during the consolidation. Without a spike in volume on breakout, the move could lack conviction.
This weakens the bullish case.
3. Resistance Zone Overhead:
There's likely a resistance zone just above the rectangle (around 3,240–3,260), where selling pressure could resume.
Price may test the zone, reject it, and fall back inside or below the range.
4. Double Top Risk:
The price action on the 18th and current range-top could form a double-top pattern if rejected.
A drop below the lower bound of the rectangle (~3,210) would confirm the pattern, suggesting bearish continuation.
5. Macro or Fundamental Risks:
Any unexpected strong U.S. dollar movement or interest rate expectations could push gold lower, invalidating bullish technical setups.

Next move Disruption Analysis: Bearish Risk Perspective
1. Sideways Consolidation (Red Box Zone):
The price is consolidating in a tight range between roughly 32.20 and 32.40, showing indecision and potential for either a breakout or breakdown.
Repeated rejections near the top of this box can signal exhaustion of buying pressure.
2. Volume Observation:
There’s no strong volume surge indicating accumulation; volume appears mixed and doesn't strongly support a bullish breakout.
A potential fakeout risk exists if the price spikes above the consolidation range only to fall back in (bull trap).
3. Potential Bearish Breakdown:
If the price breaks below the red box, especially under 32.20, it could trigger stop-losses and initiate a short-term bearish trend.
First downside target: 32.00 psychological level, followed by 31.80 support from previous lows.
4. Wick Rejection on Top:
The recent candles inside the box show long upper wicks — signs of selling pressure at higher levels.

Next move Bearish Disruption Perspective:
1. Failure to Break Above Supply
Price is struggling near 32.40–32.50, a visible resistance area from prior swing highs.
Repeated rejections here can signal seller strength or profit-taking.
2. Exhaustion Patterns
The price is forming sideways consolidation (highlighted in red).
A failure to break upward from this box and a false breakout wick would suggest buyer exhaustion.
3. Bearish Breakdown Scenario
If price breaks below the red box support (~32.30), this range could flip into resistance.
A clean drop below 32.30 would likely open the path toward 32.00 and potentially 31.80.
4. Volume Spike on Red Candle
Volume on red bars (10.64K) suggests aggressive selling pressure creeping in.
Watch for confirmation if next candles close red with high volume.

Next target Bearish Disruption Points
1. False Breakout Risk
Price is hovering near the recent highs but hasn’t made a convincing higher high.
A fakeout above 32.42 followed by a sharp rejection could trap buyers and trigger a sell-off.
2. Exhaustion at Resistance
The current level (~32.33–32.42) was a previous distribution zone on May 13–14.
Low volume follow-through may indicate weak buying interest, increasing the odds of a reversal.
3. Bearish Divergence (Potential)
If RSI or MACD shows lower highs while price pushes up, that’s a bearish divergence—a common reversal signal.
(You’d need to check indicators for confirmation.)
4. Support Flip to Resistance
If the price breaks back below the red box (~32.25), the same zone could act as resistance, turning into a supply zone.
5. Volume Clue
Volume appears lower during the recent bullish attempts, hinting at buyer fatigue.
Higher volume on red candles would validate a bearish shift.

Silver next move Weak Demand Zone Bounce
The current price action shows only a minor bounce from the demand zone.
A lack of strong bullish candles or volume confirmation may indicate weak buying interest.
2. Lower High Structure
The chart appears to be forming lower highs, suggesting a possible downtrend continuation.
If price fails to break the recent swing high near 32.70, bears might gain control.
3. Volume Concern
Recent bullish candles have decreasing volume, while the latest red candle has higher volume—this could signal a bearish divergence.
4. Bearish Trap Possibility
The current consolidation above support might turn into a distribution zone, leading to a fake breakout downward.
