EURAUD, Huge Formation, WEDGE to Setup BEARISH BREAKOUT!Hello There!
Welcome to my new analysis of EURAUD from the 4-hour timeframe perspective. In recent times the EXY, European Currency Index has shown up with crucial bearish inclinations which are pointing to a bearish market sentiment especially with massive inflation spreading like wildfire seemingly not reacting to exponential rate hikes pulled out by the ECB. Such developments could point to a major bearish setup emerging for the EURAUD also. Besides that, there are important formational structures that need to be considered here. In this case, it is necessary to determine the final completions and changes within the market before rushing to anything else.
Formational Developments, Resistance, Bearish Momentum, and Setup:
When looking at my chart now EURAUD continued to form this preceding huge bearish descending channel trend in which it already pulled back several times bearishly off the upper boundary increasing the high possibility likelihood of such pullbacks to holding on and printing the next bearish waves with continued lower lows to be determined. Especially as EURAUD already pulled back several times from the 65-EMA in red as well as the 35-EMA in grey these EMAs are substantial resistances from where continued pullbacks are more likely than anything else. Currently, EURAUD is approaching the EMAs together with the upper boundary resistance of the channel once again which is pointing to the next bearish wave to set up from here on.
Upcoming Determinations, Bearish Breakout, Target Activation, and Underlying Drivers:
Furthermore, what is the most important formation in my whole chart is this crucial descending wedge formation. Such a formation is pointing to an increased continuation toward the bearish direction in almost all of the cases. This formation will be completed with a final breakout below the lower boundary as it is marked within my chart and as EURAUD already completed the wave-count within the formation this final breakout is likely to emerge within the near future. Once the breakout has shown up as it is marked this is going to be the origin of the wave C extension and bearish momentum acceleration as it is marked. Once this wave C acceleration and bearish wave has shown up it is going to activate the final target zone as marked.
Once this final target zone has been reached further assumptions need to be made. The pair is on my watchlist to determine important changes once they have shown up here, especially with the target projections and bearish developments to be expected. Especially, a massive inflation increase together with failed monetary policies are going to fuel a bearish momentum inclination here therefore these underlying factors also need to be considered then.
In this manner, thank you everybody for watching my analysis of CHFAUD. Support from your side is greatly appreciated.
VP
Forexmarket

CHFAUD, This Major Formation to ALTER the Current Trend-Dynamic!Hello There!
Welcome to my newest idea about CHFAUD. In my recent analysis, conduction, and chart price-action I have detected important underlying trend dynamics and price action dynamics that are likely to alter the whole CHFAUD price action and trend that is currently ongoing. Currently, it is highly necessary conduction to consider if the CHFAUD current trend dynamics are going to hold on or if a massive reversal is going to convert the whole price action into a different market.
Within my analysis chart, I am considering the massive ascending triangle formation CHFAUD is likely to complete within the next times as it is going to approach this massive supply zone between the 1.8 and 1.87 level from where it already pulled back several times in the past increasing the possibility for a major pullback into the other trend direction.
Especially, within this whole price-action the most important parts are the 25-EMA, the 50-EMA, and the ascending trend line which hold the current trend, and if they are broken towards the other trend direction it is going to indicate the massive trend reversal and is going to activate the next continuations till either the bearish momentum is going to accelerate so heavily below the supports or a potential for a reversal within the supports is indicated.
When considering the whole dynamic here the major ascending triangle formation forming here is a formation that is indicating a reversal in almost all of the cases. The most important conduction once it has been completed will be on how the price action approaches the target zones because it is going to complete a much larger wave count from A to E with the finalization of the wave E. A bounce in this area is going to confirm a potential reversal otherwise a continuation is going to accelerate the bearishness to even further target zones.
In this manner, thank you everybody for watching my analysis of CHFAUD. Support from your side is greatly appreciated.
VP

USDJPY, Major Broadening-Wedge, Breakout Incoming, Targets!Hello There!
Welcome to my new analysis of USDJPY from the 2-hour timeframe perspective. As recent massive market alterations indicate major volatility is going to emerge especially for Forex Pairs trading against the USD such pairs can offer worthwhile trading opportunities when the necessary setups arise. Of course, a trader, or investor should not move into the market without the necessary advocation consideration. Especially, as the DXY recently showed great upside strength this is setting up an important volatility indication for a pair such as USDJPY, and as I detected now there are important formational structures that are likely to convert the whole setup into a primary setup opportunity as I am also monitoring the pair in the data dashboard.
Major Bullish Broadening-Wedge-Formation and Breakout-Indications:
When looking at my analysis, the most important part in my analysis is the broadening-wedge-formation USDJPY is now building up. As it is seen in my analysis the USDJPY pair already bounced to several new highs within the whole chart. This already marked a great trend-determination with further potential to increase in probability the more signs are spotted. What is so important here is that USDJPY greatly bounced above the local descending-support-line and is now building up exactly above this support matching with the 65-EMA. Above these supports USDJPY is now forming the broadening-wedge-formation as it is seen in my analysis with the wave-count within the formation already completed and the price-action to aim for a final breakout in the next times.
Upcoming Perspectives, Target-Zones, and Further Determination-Factors:
Currently, USDJPY is already bouncing several times into the upper boundary of the broadening-wedge-formation which indicates that the breakout is likely to arise. Once the breakout has shown up this will be the final completion setup of the broadening-wedge-formation as it is marked in my analysis. Once the setup has shown up this will activate two major target zones. The first target zone is within 149.25 level and the second target-zone is within the 150.71 level. Once the breakout has shown up these target zones are likely to be reached in the schedule, especially with a further declining U.S. CPI and the continuation of a massive bullish paradigm within the DXY the preceding wave-expansion will have an enormous effect on the USDJPY pair as well.
In this manner, thank you everybody for watching my analysis about USDJPY. Support from your side is greatly appreciated.
VP

EURUSD | Strong US Dollar, But Why?The value of the US dollar continues to rise
Today on September 30, one Euro cost only $1.0573 and markets have finally come to the realization that the Federal Reserve is going to continue to fight inflation till it achieves its target goals, and, to do so, it will even raise its policy rate of interest one..or, possibly two...more times! even Jamie Dimon, CEO of JPMorgan, is now saying that interest rates could hit 7.0 percent.
"Are you prepared?" Dimon asks
It seems as if market participants have doubted Fed Chairman Jay Powell ever since the Federal Reserve began to raise its policy rate of interest in the middle of March 2022.The underlying belief was that Mr. Powell and the Fed would "back off," not wanting to overdue a tight monetary policy and cause financial distress.
So, the value of the U.S. dollar remained softer than many expected and the US stock market stayed stronger than many expected.But, seemingly, that time has changed.
When did market attitudes change?
Let's say toward the end of July 2023. That is, market participants only became "believers" after 16 months of the Federal Reserve raising its policy rate of interest and maintaining its effort at quantitative tightening.
Why have I determined that market attitudes changed around the end of March?
On July 14, 20232, one Euro cost $1.1230. The price of one Euro has declined almost steadily since that time.The dollar price of the British pound took a similar path.The yield on the 10-year U.S. Treasury note on July 14, 2023, was 3.820 percent. Currently, the yield is 4.620 percent.
On July 31, the S&P 500 stock index closed at 4,589. The price has been downhill for most of the following period.The story that the markets seem to be telling us is that sometime in the middle of July 2023, market participants started taking the Federal Reserve at its word.
Since then, the value of the U.S. dollar became stronger and stronger, as investors bought into the dollar.Bond prices fell and stock prices declined as investors sold these items.
All of this is consistent with the fact that investors really started to believe that Mr. Powell and the Federal Reserve were going to do what it said it had set out to do.The Fed, market participants believed, going to continue to fight inflation and were going to bring the rate of price increases down to the level the Fed wanted...2.0 percent.
In this past week, the Federal Reserve published its latest round of forecasts for the future. This release was followed by a new set of forecasts by the U.S Commerce Department.
inflation and unemployment would approach the Fed's goals within the next year or so. The feeling expressed in both forecasts was that the Fed is succeeding in its efforts to get the economy back to a "more normal" rate of operation.
Mr. Powell and other Federal Reserve leaders continued to caution the investment community to "be patient." But, the underlying message seemed to be, we are approaching what we set out to achieve.
Bottom line, Mr. Powell and others were saying...be patient...after 18 months of quantitative tightening..we are getting there.It seems as if the markets have been right on the side of the Federal Reserve at this time.
What the Fed has done supports a strong dollar relative to other currencies throughout the world.The US dollar deserves to be strong.But, there is still a way to go.
The Fed may be getting the car in the garage, but the car is not fully in the garage yet...and the garage door has not been shut.Let's hope the job can be completed.
Unfortunately, there may be some fiscal discomfort taking place before the final chapters are written. The potential government shutdown is not good news.

USDCHF, Massive Broadening-Wedge, BREAKOUT Incoming, Targets!Hello There!
Welcome to my new analysis about USDCHF on the 2-Day Timeframe Perspective. In the recent times, as I have spotted, USDCHF is converting more and more into a determining structure that is setting up a much larger price-action volatility-breakout than already seen before. Therfore, the next finalization-steps need to be confirmed for the major determinations to emerge. Especially once the volume and momentum is aligned into this direction it is going to transform the whole chart-development into a major breakout determination. In this case I have spotted the most important parts of this whole considerations and what to expect in the upcoming times.
Formational Structure:
As when looking at my chart now USDCHF continued forming this gigantic Descending-Broadening-Wedge-Bottoming-Formation in which it formed a coherent Wave-Count within the structure to continue gradually bouncing within the lower boundary to now aim higher and test the upper boundary for a final breakout. Especially as USDCHF is building up above the 35-EMA this is offering an strong support within this whole structure and is actually forming the structure for the final breakout to emerge. Once the breakout above the upper-boundary emerged as it is seen within my chart this is going to be the first Breakout-Confirmation in a series of further continuation developments.
Upcoming Indications and Prospects:
Once the initial Breakout-Confirmation has shown up this is going to activate the target-zones as they are marked within this whole formational structure. Once the second Breakout-Confirmation has been validated it is going to increase the odds for the second target to be reached within the schedule and especially with a strong trend-acceleration those targets are likely to be reached faster than setup. The next times will be extremely important here as they are going to determine the final breakout and completion of the whole wedge-formation. According to this further assumptions to consider for the next alignments can be derived. This paramount formation and the upcoming developments are factors why we are keeping USDCHF on the watchlist and re-evaluate the situation once changes in the chart have emerged.
In this manner, thank you everybody for watching the analysis, support from your side is greatly appreciated.
VP

AUDUSD, Massive BROADENING-WEDGE, Bearish Indications Setup!Hello There!
Welcome to my new analysis about AUDUSD on several timeframe perspectives. The AUDUSD continued with continuational bearish price-action as it pulled back from several levels to continue forming lower lows. Now a major consideration here is if this trend into the bearish direction is holding on and in my chart I detected major signs that such a continuation is highly likely as there are huge formations forming that are setting up the massive volatility waves to emerge.
As when considering the local timeframe perspective AUDUSD is forming this initial broadening-wedge-formation here which is going to activate targets below the 0.616 level. Once they are reached this will be even a part of a much larger formation which is actually a major broadening-wedge-formation, the fact that the price-action will also have formed a breakout below the preceeding trend-line that had the origins within the 2020 corona supply-shock bear-market breakdown lows.
The fact that AUDUSD is going to form the breakout below the lower boundary of the gigantic large global broadening-wedge-formation as well as below the preceeding massive corona-lows trendline based in 2020 will be the contribution to a much larger bearish trend-dynamic. Furthermore, a continued high inflation within the AUD area is going to raise the interest rates for this area which is likely to put more bearishness on AUD in combination with the strong DXY this is a combination from where bearishness is elevated.
In this manner, thank you everybody for watching the analysis, support from your side is greatly appreciated.
VP

CHFJPY, DOOMSDAY BEAR-MARKET Scenario, Wedge-TRIGGER-Setup!Hello There!
Welcome to my new analysis about CHFJPY on several timeframe perspectives. The CHFJPY conditions have accelerated to an unnatural dynamic recently as the pair moved into new highs instead of the massive overbought condition and the fact that this main reversal into the bearish direction should have setup already long times before especially considering the deficit of capital flows in CHF against the JPY there is a lot of bearish pressure present for CHF.
On the broader perspective the pair is forming this gigantic ascending-wedge-formation in which it already penetrated the lower boundaries with crucial bearish momentum spikes into the lower direction. This means that once a huge bearish pressure spike below the lower boundary has setup this will lead to many long liquidation triggers down the road and will lead to further continuations into this perspective. When the bearish pressure accelerates heavily this will also lead to the massive head-shoulder-formation to be completed triggering further bearish liquidations and momentum.
Especially with a further increase of the deficit in capital flows between CHF and JPY this will lead to the main market momentum to convert into a bearish dynamic and will lead to the underlying bearish scenario perspective to be confirmed by traders and investors moving into a more bearish sentiment consideration. Once the whole head-shoulder-formation has completed the momentum is likely to accelerate to the target-zones mentioned.
In this manner, thank you everybody for watching the analysis, support from your side is greatly appreciated.
VP

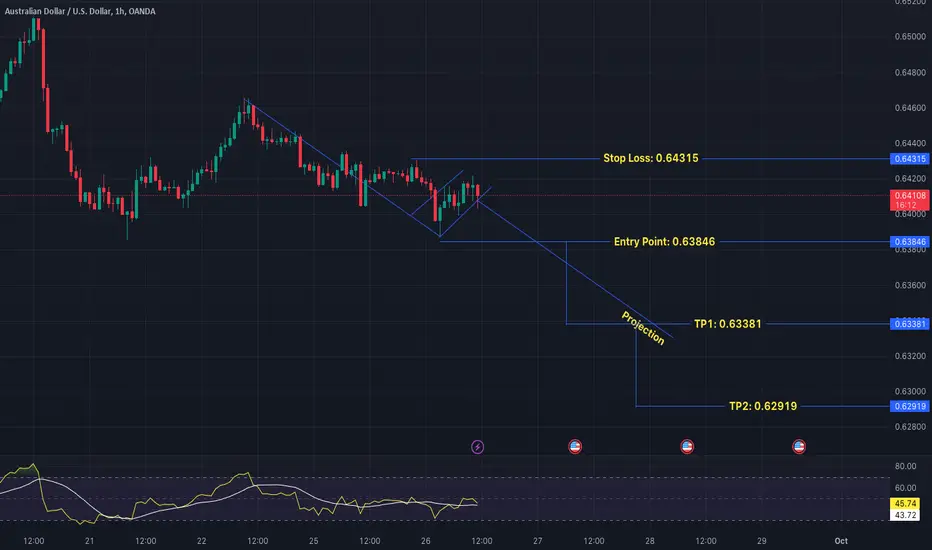
AUDUSD formed Bearish Flag 1H-TimeAUDUSD Trade Signal Timeframe: 1H
#Forex #AUDUSD #TechnicalAnalysis #CryptoSignal #TradingOpportunity #Divergence #TradingSignal #TradingwithBelieve #NASDAQ #USTECH
Hey traders! 👋 Let's dive into a potential trading opportunity on the AUDUSD pair using technical analysis. 📊
📉 Previously Bearish Trend:
Firstly, on the 1H- timeframe, we've been witnessing a Bearish trend in the AUDUSD pair. 🐻
🔄 NO Divergence on HH (Higher High):
However, it's crucial to note that recently, we have started to observe a no divergence pattern on the HH (Higher High’s). This is an important signal that the Bullish momentum might be weakening. 📉🔄
📊 Trade Opportunity:
Currently, we are looking at a potential trade opportunity with a Bullish bias.
📈 Entry Price: 0.63846
🎯 Stop Loss Level: 0.64315
🚀TP1: 0.63381
🚀TP2: 0.62919
💰 Investment Advice:
Please remember that trading carries risks, and it's essential to have a well-defined trading plan, proper risk management, and stop-loss orders in place. This analysis is for educational and informational purposes only and should not be considered as financial advice. Make sure to do your research and consider your risk tolerance before entering any trade.
Happy trading, and may the pips be in your favour! 🚀📈💰 #HappyTrading #ProfitOpportunity #TradeSmart #CryptoSignal #StockSignal #TradingwithBelieve
NASDAQ Trade Signal Timeframe: 4HNASDAQ Trade Signal Timeframe: 4H
#Forex #NDX100 #TechnicalAnalysis #CryptoSignal #TradingOpportunity #Divergence #TradingSignal #NASDAQtradingsignal #NASDAQ #USTECH
Hey traders! 👋 Let's dive into a potential trading opportunity on the NDX100 pair using technical analysis. 📊
📉 Previously Bullish Trend:
Firstly, on the 4H- timeframe, we've been witnessing a Bearish trend in the NDX100 pair. 🐻
🔄 Divergence on LL (Lower Low’s):
However, it's crucial to note that recently, we have started to observe a divergence pattern on the LL (Lower Low’s). This is an important signal that the Bearish momentum might be weakening. 📉🔄
📊 Trade Opportunity:
Currently, we are looking at a potential trade opportunity with a Bullish bias.
📈 Buy Level \ Entry Price: 14600
🎯 Stop Loss Level: 14501
🚀TP1: 14700
🚀TP2: 14760
💰 Investment Advice:
Please remember that trading carries risks, and it's essential to have a well-defined trading plan, proper risk management, and stop-loss orders in place. This analysis is for educational and informational purposes only and should not be considered as financial advice. Make sure to do your research and consider your risk tolerance before entering any trade.
Happy trading, and may the pips be in your favour! 🚀📈💰 #HappyTrading #ProfitOpportunity #TradeSmart #CryptoSignal #StockSignal #TradingwithBelieve

XAUUSD Break his Resistance might Go DownXAUUSD Timeframe: 1H Trade Signal
#Forex #XAUUSD #TechnicalAnalysis #TradingOpportunity #Divergence #TradingSignal
Hey traders! 👋 Let's dive into a potential trading opportunity on the XAUUSD pair using technical analysis. 📊
📉 Previously Bearish Trend:
Firstly, on the 1H- timeframe, we've been witnessing a bearish trend in the XAUUSD pair. 🐻
📊 Trade Opportunity:
Currently, we are looking at a potential trade opportunity with a Bearish bias.
📈 Sell Limit Level \ Entry Price: 1912
🎯 Stop Loss Level: 1926
🚀TP: 1901
💰 Investment Advice:
Please remember that trading carries risks, and it's essential to have a well-defined trading plan, proper risk management, and stop-loss orders in place. This analysis is for educational and informational purposes only and should not be considered as financial advice. Make sure to do your research and consider your risk tolerance before entering any trade.
Happy trading, and may the pips be in your favour! 🚀📈💰 #HappyTrading #ProfitOpportunity #TradeSmart #tradingwithBelieve

NASDAQ Trade Signal Timeframe: 1H NASDAQ Trade Signal Timeframe: 1H
#Forex #NDX100 #TechnicalAnalysis #CryptoSignal #TradingOpportunity #Divergence #TradingSignal #NASDAQtradingsignal #NASDAQ #USTECH
Hey traders! 👋 Let's dive into a potential trading opportunity on the NDX100 pair using technical analysis. 📊
📉 Previously Bullish Trend:
Firstly, on the 1H- timeframe, we've been witnessing a Bullish trend in the NDX100 pair. 🐻
📊 Trade Opportunity:
Currently, we are looking at a potential trade opportunity with a Bearish bias.
📈 Buy Level \ Entry Price: 14675
🎯 Stop Loss Level: 14720
🚀TP1: 14622
💰 Investment Advice:
Please remember that trading carries risks, and it's essential to have a well-defined trading plan, proper risk management, and stop-loss orders in place. This analysis is for educational and informational purposes only and should not be considered as financial advice. Make sure to do your research and consider your risk tolerance before entering any trade.
Happy trading, and may the pips be in your favour! 🚀📈💰 #HappyTrading #ProfitOpportunity #TradeSmart #CryptoSignal #StockSignal #TradingwithBelieve

Euro Shorts at 11 Months High: A Hedge Fund's Hilarious TakeIntroduction:
Hold onto your hats because we've got some juicy news straight from the hedge fund world. Brace yourselves for a rollercoaster ride as we delve into the wild world of euro shorts, as reported by a certain hedge fund that knows how to tickle our funny bones. Get ready to chuckle and, of course, take some action!
The Hedge Fund Report:
Picture this: it's been a whopping 11 months since our dear hedge fund buddies decided to take on the mighty euro. And boy, have they been having a laugh! According to their recent report, the euro shorts have been quite the spectacle, providing us with a comedy show we never knew we needed.
Call-to-Action: Join the Comedy Show and Short Euro!
Now that we've had our fair share of laughter, it's time to take action, my fellow traders! The hedge fund report has given us a golden opportunity to join the comedy show and potentially make some handsome profits. So, here's our call-to-action: jump on the bandwagon and consider shorting the euro!
But remember, trading is no laughing matter. Do your due diligence, analyze the market, and make informed decisions. Take advantage of this hilarious situation, but also stay vigilant and manage your risks wisely. After all, laughter is great, but profits are even better!
Conclusion:
In a world where trading can sometimes feel like a serious affair, it's refreshing to find humor in the markets. The euro shorts, as highlighted by our hedge fund friends, have given us a reason to smile and, more importantly, take action. So, traders, buckle up, embrace the comedy, and consider joining the euro shorting extravaganza. Happy trading, and may the laughter be with you!
www.hedgeweek.com

Potential BOJ Intervening on Yen Post-Federal Reserve MeetingIntroduction:
In the ever-evolving world of currency trading, it's crucial for traders to stay informed about potential interventions by central banks. The recent Federal Reserve meeting has sparked speculation about the Bank of Japan's (BOJ) next move regarding the yen. This article aims to examine the likelihood of BOJ intervention and provide a cautious analysis to traders considering long yen positions.
Understanding the Context:
The Federal Reserve's policies and decisions often have a significant impact on currency markets worldwide. As the world's two largest economies, the United States and Japan share a complex relationship that can influence currency valuations. Following any significant developments in the US monetary policy, it is prudent to assess the potential response from the BOJ and its implications for the yen.
Analyzing the Possibility of BOJ Intervention:
While predicting central bank actions is inherently challenging, there are a few factors that warrant attention when considering the likelihood of BOJ intervention on the yen:
1. Exchange Rate Stability: BOJ's primary concern is maintaining stability in the yen's exchange rate. If the yen appreciates rapidly against major currencies, it may harm Japan's export-driven economy. In such cases, the BOJ may intervene to prevent excessive yen appreciation.
2. Economic Recovery: Japan's ongoing efforts to revive its economy have been met with mixed results. The BOJ may consider intervening to support economic growth, particularly if the Federal Reserve's policies threaten to weaken the yen significantly.
3. Global Market Sentiment: The BOJ closely monitors global market sentiment, as abrupt changes can impact the yen's value. If the Federal Reserve's decisions lead to substantial market volatility, the BOJ may intervene to stabilize the yen and mitigate potential risks.
Call-to-Action: Long Yen with Caution
Considering the aforementioned factors, traders contemplating long yen positions should exercise caution and adopt a measured approach. Here are a few suggestions to consider:
1. Stay Informed: Continuously monitor news and updates from both the Federal Reserve and the BOJ to anticipate any potential intervention. Being aware of economic indicators, policy statements, and market sentiment is crucial for making informed trading decisions.
2. Technical Analysis: Utilize technical indicators and chart patterns to identify potential entry and exit points for yen positions. Combining technical analysis with fundamental factors can help traders navigate the market with a more comprehensive approach.
3. Risk Management: Implement robust risk management strategies to protect your capital. Setting stop-loss orders and diversifying your portfolio can help mitigate potential losses in case of unexpected market movements.
Conclusion:
While the possibility of BOJ intervention on the yen after the Federal Reserve meeting cannot be ruled out, traders should approach long yen positions with caution. By staying informed, conducting thorough analysis, and implementing effective risk management strategies, traders can navigate the currency markets more confidently. Remember, the key to successful trading lies in a balanced and informed approach.
asia.nikkei.com/Business/Markets/Currencies/Yen-intervention-watch-redoubles-after-Fed-BOJ-meetings
Disclaimer: This article is for informational purposes only and should not be considered as financial advice. Traders are advised to conduct independent research and consult with professional advisors before making any investment decisions.

Euro Still Drops After ECB's Record-High Interest Hike
I must admit that the current state of affairs in the currency market has left me feeling rather disheartened. It is with a heavy heart that I share with you the recent news regarding the euro's ongoing decline, even in the face of the European Central Bank's (ECB) decision to raise interest rates to unprecedented levels.
In a surprising turn of events, the euro has failed to find its footing, despite the ECB's efforts to bolster its value. The announcement of the highest interest rates on record was anticipated to provide a much-needed boost to the struggling currency. However, it appears that the market sentiment has not aligned with our expectations, leaving us in a state of perplexity and disappointment.
As traders, we often rely on historical data, economic indicators, and expert opinions to guide our investment decisions. However, the current situation reminds us that the market can be unpredictable and subject to various external factors. While the ECB's decision was intended to instill confidence in the euro, it seems that other prevailing circumstances are exerting a stronger influence on its downward trajectory.
In light of these developments, I would like to suggest considering a short position on the euro. Although it is disheartening to witness the currency's decline, it is crucial for us to adapt to market conditions and seize opportunities that arise from such situations. By taking a short position, we can potentially benefit from the euro's continued depreciation and mitigate potential losses.
I understand that this suggestion may not align with our initial expectations or desires, but as traders, we must remain adaptable and open to alternative strategies. As the saying goes, "the market is always right," and it is our responsibility to adjust our positions accordingly.
Please feel free to comment below if you would like to discuss this further or explore other potential trading opportunities. I value your expertise and would appreciate your input on the matter.
www.wsj.com

USDCHF breakout long for 0.9100#USDCHF broker 0.9015 strong resistance area.breakout has done, Demand zone for long 0.8970-40, stop loss below 0.8900, target 0.9100 & 0.9140.

EURUSD : "STRONG BULLISH MOMENTUM"Increase in price, EURUSD will return to resistance of 1.09428, however sustained break of 1.06465 - "support" will have a bearish implication, however, price is currently holding at current support and showing some bullish momentum below , the price is predicted to rise, when we look at the overall movement, we can actually see that the EURUSD is moving in a falling market channel, which indicates a fall in prices, however, the breakout of the main resistance will further confirm our buys.

USDCHF, Massive BROADENING-WEDGE, Determinations Ahead!Hello,
Welcome to this analysis about USDCHF and the 4-hour timeframe perspectives. When looking at my chart we can watch there how USDCHF in recent times has formed this massive broadening wedge formation, in this broadening wedge formation USDCHF already completed the coherent wave count reaching from A to E, and with the completion of this wave count with the wave E USDCHF has shown up with this massive bounce off the lower boundary of the broadening wedge formation till the breakout above the upper boundary emerged. Now as USDCHF has shown up with this breakout this completed the whole broadening wedge formation and USDCHF from there on activated upside targets in the structure. In the next times there is an increased possibility given for USDCHF to bounce off the upper boundary as it is seen in my chart, in this zone USDCHF has also coherent supports determined by the 65-EMA in red and the 35-EMA in green, taking these factors into the consideration with USDCHF bouncing in these levels there is an increased likelihood given for USDCHF reaching out further targets in the structure especially as the high bullishness already settled there is good potential given for this determination, it will be an interesting development ahead.
In this manner, thank you for watching the analysis, all the best!
"Trading effectively is about assessing possibilities, not certainties."
Information provided is only educational and should not be used to take action in the markets.

USDEUR, Huge Formation is Going to CONVERT a Major BREAKOUT!Hello There!
Welcome to my new analysis of USDEUR from several timeframe perspectives. Within recent times, there are several factors that are confirming an important change in the dynamics of the actual underlying factors within USDEUR. In this case, I have spotted major developments currently accelerating within the whole market that are likely to lead to a transformative formational breakout within the USDEUR price action analysis chart.
As when looking at my chart USDEUR is forming this gigantic broadening wedge bottoming formation. Such a formation is known to mark a major reversal structure once it has been completed. In this case, now, the USDEUR has several important support zones within the whole dynamic marked by the fact that the USDEUR is trading above the main trend line, above the 35-EMA, and above the higher highs it established in recent times.
Once USDEUR continues with the further price dynamics to accelerate within the structure and boil up a final range breakout above the upper boundary this is going to accelerate a massive volatility breakout when the current market conditions keep as they are or even increase much further. Once the breakout has shown up as it is marked in my chart this is going to activate targets of at least 0.98. Once these targets have been reached there is still more potential when USDEUR continues with the already established bullish circle momentum.
The only scenario of invalidation would emerge when USDEUR reverses in the local structure here, the market conditions change and USDEUR drops below the 35-EMA matching with the ascending trend line. Such a breakout below these ever-so-crucial support levels is going to mark a crucial reversal structure from where USDEUR is going to accelerate the dynamics till considerable support has been reached from where USDEUR has the ability to reverse and in this case, this will be the lower boundary of the massive broadening wedge formation.
In this manner, thank you everybody for watching my analysis of CHFAUD. Support from your side is greatly appreciated.
VP

Will GBPUSD bounce back from here?GBPUSD is one of the trading pair. By looking on the current structure on chart we can say it's below the major trend. And also reaching to the high demand zone.
There is a good possibility it will be bouncing back from here because of
Reason :
1. RSI is in oversold zone. But don't have good strength so buyers will start making positions here.
2. Zone has provided the good support zone for demand.
3. Reduction of volume of sellers.
Verdict :
Bulliness in near future.
Plan of action :
Wait for breakout of dotted trendline.

GBPAUD WEEKLY TECHNICAL ANALYSISHello Traders ,
I'm expecting bearish momentum build up at the present zone on GBPAUD. First take profit at 1.9169 zone and second take profit at 1.8291 zone .

The Greatest Forex Scalping Indicator EVER $$MartyBoots here. I have been trading for 16 years and I am here to share my ideas with you to help the Crypto community.
This is the greatest forex scalping indicator ever .. If you can show me a better one I would love to see it

AUDUSD possible long for 0.65156th, 7th, 8th daily inside bars, indication weakness has been ended. price in accumulation phase. 11th September daily insurance bar further confirmation for strength in coming days. demand zone for long 0.6400-0.6365, stop loss below 0.6360, target: 0.6515.

GBPJPYGBPJPY, after recent massive bull run, GBPJPY is now trading in range and perfectly testing the lows and highs of the range.
Ranges are best in a sense just buy the support and sell the resistance.
Currently the price is at support level and seems like a fine buying opportunity.
