Steal the Show: AUD/CAD Bullish Bank Run!🌍 Greetings, Wealth Warriors & Market Mavericks! 👋😎💸
Hey there, global traders! Ready to crack the vault on the AUD/CAD "Aussie-Loonie" Forex Heist? 🏦💰 Based on our slick *Thief Trading System* blending technical precision and fundamental vibes, here’s the ultimate plan to snag profits. Follow the chart’s long-entry blueprint and aim to cash out near the high-stakes Red Zone—a wild spot where overbought signals, consolidation, and bearish traps lurk. 💪🎯 Stay sharp, grab your loot, and treat yourself—you’ve earned it! 🍾🚀
🔑 Entry 1: “The vault’s open! Spot the MA breakout at 0.90500 and dive in—bullish riches are calling!”
Pro move: Set buy stop orders above the Moving Average or buy limit orders at the latest 15/30-min swing low/high for pullback action. 📊 Add a chart alert to catch the breakout wave! 🌊
🔑 Entry 2: “The heist is on! Stalk the MA pullback in the Market Maker’s Trick Zone at 0.89200, then strike—fortune loves the fearless!”
🛑 Stop Loss: “Listen up, crew! 🗣️ For buy stop orders, hold off on setting that stop loss until the breakout kicks in. 🚀 Place it at the spot I’ve marked 📍, or go rogue at your own risk—don’t blame me if the market bites! 😜 Your trade, your rules, your fire. 🔥”
📍 Thief SL set at the nearest swing low on the 4H timeframe for swing trades.
📍 Size your SL based on your risk, lot size, and number of orders.
🎯 Target: 0.91500—or make a smooth exit near the target zone. 🏴☠️
👀 Scalpers, heads up: Stick to long-side scalps. Got deep pockets? Jump in now! Otherwise, team up with swing traders for the grand heist. Use trailing SL to lock in your cash. 💰🔒
📡 Why’s AUD/CAD hot? The "Aussie-Loonie" is riding a bullish surge, fueled by key drivers. 📰 Dive into fundamentals, COT reports, sentiment analysis, intermarket trends, and future projections. Check the linkss for fundamentals, macro trends and market outlooks for the full scoop! 🔗🌐
⚠️ Trading Alert: News Flash & Position Safety 🗞️🚨
News drops can shake the market like a storm. 🌪️ To protect your trades:
- Skip new entries during news releases. 🚫
- Use trailing stop-loss orders to secure profits and shield your positions. ✅
💥 Boost Our Heist! 💪 Hit that Boost Button to supercharge our Thief Trading squad. 💸 Crush the market daily with our slick strategies. Together, we’ll stack profits with ease! 🤝❤️🎉
Catch you at the next heist, traders—stay locked in for more! 🤑🐱🚀✨
Forexmarket

NZD/JPY Potential Bullish ContinuationNew Zealand Dollar/Yen price seems to exhibit signs of potential bullish momentum as the price action may form a credible Higher Low on key Fibonacci and Support levels.
Trade Plan :
Entry @ 86.29
Stop Loss @ 84.85
TP 0.9 - 1 @ 87.586 - 87.730

Ready to raid the EUR/CAD ("Euro vs Loonie") with precision?✨ Greetings, Market Mavericks & Currency Pirates! ✨
🔍 Thief Trading’s Heist Blueprint (Bearish Raid Mode)
Short entry activated—targeting the high-risk Green MA Zone.
Oversold market? Consolidation? Reversal trap? Bullish robbers lurking?
Perfect. We strike where they least expect. 🎯 Steal the profits and vanish before the alarms sound!
⚡ Entry Strategy (Sneaky & Strategic)
"The vault’s unlocked—swipe the bearish loot at any price!"
*→ Prefer sell limits within 15-30 min (nearest swing highs/lows for clean pullbacks).*
🛡️ Stop Loss (Escape Route)
*→ Thief SL set at nearest swing high/low (4H timeframe).*
→ Adjust based on risk, lot size, & multiple orders.
💰 Take Profit (Loot & Scoot)
→ Primary Target: 1.53000
→ Or escape early if the heist gets too hot.
🌪️ Market Context (Why This Raid?)
Bearish momentum fueled by:
Macroeconomic tides
COT whispers
Sentiment shadows
Check out there👉🏻🌏🌎🔗🔗
📊 Sentiment Snapshot (May 13, 2025, UTC+1)
Retail Thieves:
🟢 Bullish: 34% 😏 (Betting on Eurozone rebound)
🔴 Bearish: 56% 😣 (CAD strength, ECB dovishness)
⚪ Neutral: 10% 🤔
Institutional Thieves:
🟢 Bullish: 29% 💼 (EUR hedges on global risks)
🔴 Bearish: 61% ⚠️ (CAD oil rally, EUR slump)
⚪ Neutral: 10% 🧐
🚨 Trading Alert (News Survival Kit)
News = Chaos. Protect your loot:
Avoid new trades during releases.
Trailing stops = Profit shields.
💎 Boost This Heist → Fuel Our Next Raid!
Hit 💥Boost💥 to join the crew. More market heists = More stolen pips. 🏴☠️
Stay sharp—another heist drops soon. Until then, trade sly & profit big!
— Thief Trading Syndicate 🎩🔓

GBPCHF Breakout Eyes 1.1190–1.1290 as Bullish Momentum BuildsGBP/CHF has broken out of a descending wedge formation on the 4H chart, indicating a bullish shift in momentum. This move is supported by a recovering GBP, driven by better-than-expected UK GDP data and BoE easing expectations already priced in. Meanwhile, CHF is softening on safe-haven unwinding and a less aggressive SNB tone. Technicals point to a clean breakout with immediate upside targets at 1.1116 and 1.1190, with potential extension toward 1.1290.
🔍 Technical Analysis
Pattern: Descending wedge breakout on the 4H chart — a bullish continuation pattern.
Breakout Confirmation: Price is now trading above wedge resistance (~1.1045), showing follow-through buying.
Support zone: 1.1000–1.1040 (retest area if price pulls back)
Fibonacci Levels:
1.1116 → 50% Fib retracement + prior resistance
1.1190 → 61.8% Fib and historical reaction zone
1.1290 → 78.6% retracement and next key resistance
📈 Bullish Signals:
EUR/GBP overlay shows inverse correlation supporting GBP strength
Higher lows forming since April → structure is rising
Clean breakout with space to run before major resistance hits
🌍 Fundamental Context
🇬🇧 British Pound (GBP):
UK Q1 GDP: +0.6% q/q — solid beat vs expectations
BoE Positioning: Rate cut expected in H2 2025, but not imminent; GBP supported in the meantime
Trade Conditions: Signs of recovery, but BoE not overly dovish yet
Market Tone: GBP favored short-term due to economic resilience
🇨🇭 Swiss Franc (CHF):
SNB Stance: Recent tone shift toward caution amid deflation signals
Safe Haven Demand: Easing due to progress in U.S.–China trade talks
Macroeconomic Data: Mixed; CPI soft, and growth modest
CHF Outlook: Mildly bearish unless geopolitical risk reignites
🎯 Trade Setup
Entry: Breakout already underway at 1.1050
Upside Targets:
1.1116 (first TP)
1.1190 (major resistance zone)
1.1290 (extension zone)
Stop Loss: Below 1.1000 (below wedge retest zone)
Strategy: Buy-the-dip on pullback to 1.1040–1.1015, or hold breakout long
🧭 Conclusion
GBP/CHF shows a clean bullish breakout both technically and fundamentally. With the UK economy showing near-term resilience and the SNB expected to remain cautious, GBP strength may persist in the short run. Unless geopolitical risks resurface to revive CHF demand, the pair looks poised for a rally toward 1.1190 and possibly 1.1290 in the coming sessions.

CAD/CHF Loonie Heist: Sniping Swiss Profits with Thief Trading!🌍 Hello Global Traders! 🌟
Money Makers, Risk Takers, and Market Shakers! 🤑💸✈️
Dive into our CAD/CHF "Loonie vs Swiss" Forex heist, crafted with the signature 🔥Thief Trading Style🔥, blending sharp technicals and deep fundamentals. Follow the strategy outlined in the TradingView chart, focusing on a long entry targeting the high-risk MA Zone. Expect a wild ride with overbought conditions, consolidation, and potential trend reversals where bearish players lurk. 🏆💰 Celebrate your wins, traders—you’ve earned it! 💪🎉
Entry 📈: The vault’s open! Grab bullish opportunities at any price, but for precision, set buy limit orders on a 15 or 30-minute timeframe near swing lows or highs for pullback entries.
Stop Loss 🛑:
📍 Place your Thief SL at the recent swing low on the 1H timeframe (0.59400) for scalping or day trades.
📍 Adjust SL based on your risk tolerance, lot size, and number of open orders.
Target 🎯: Aim for 0.61400.
💵 CAD/CHF is riding a bullish wave, fueled by key market drivers. ☝
Unlock the full picture—dive into Fundamentals, Macro Insights, COT Reports, Quantitative Analysis, Sentiment Outlook, Intermarket Trends, and Future Targets. Check 👉🌎🔗.
⚠️ Trading Alert: News & Position Management 📰🚨
News can shake the market hard. Protect your trades by:
Avoiding new entries during news releases.
Using trailing stops to lock in profits and shield running positions.
📌 Markets move fast—stay sharp, keep learning, and adapt your strategy as conditions evolve.
💖 Power up our heist! 🚀 Tap the Boost Button to amplify our Thief Trading Style and make stealing profits a breeze. Join our crew, grow stronger, and conquer the markets daily with ease. 🏆🤝❤️
Catch you at the next heist, traders—stay ready! 🤑🐱👤🤩

EURUSD Bearish Structure Forming Amid Dollar UncertaintyEURUSD appears to be carving out a series of lower highs, showing potential signs of distribution. With price compressing inside a symmetrical triangle following multiple failed breakout attempts, the stage could be set for a bearish breakdown. This comes as U.S. inflation and Fed policy hold the spotlight and the euro faces political and structural crosswinds.
📉 Technical Breakdown (4H Chart)
Triple Top / Head & Shoulders Variant Forming:
Price action has traced a rounded top sequence, forming a triple top or complex head and shoulders structure.
Each rally attempt has been followed by steeper declines and faster recoveries—typical of a topping process.
Triangle Contraction Zone:
Current price is consolidating into a symmetrical triangle, which is often a continuation pattern.
Bearish breakout is expected if support around 1.1330–1.1320 fails.
Key Bearish Targets:
TP1: 1.1090 – former resistance turned support.
TP2: 1.0890 – April breakout base and key structure low.
Trade Setup (as per chart):
Sell Entry Zone: Break and retest of 1.1320–1.1300.
Stop Loss: Above 1.1527 (supply zone high).
Targets:
TP1: 1.1090
TP2: 1.0890
🌐 Macro Context
USD Side:
Fed is holding rates steady amid rising inflation fears triggered by tariffs
Tariff shocks are already pushing prices up, while growth slows—a tough environment for the Fed.
Dollar could strengthen if market sentiment shifts risk-off.
Euro Side:
Former EU Commissioner Gentiloni calls for unified borrowing to boost the euro’s global role, as U.S. stability is questioned
Political uncertainty around German leadership transitions may also weigh on the euro short term.
✅ Conclusion
EURUSD is trading at the apex of a tightening triangle pattern following a distribution structure. With a clean break of 1.1320 support, expect increased volatility and bearish momentum toward 1.1090 and 1.0890.

Is ETH - Next 3,000?ETHUSDT – Market Insight & Price Structure
Ethereum has been shaping a falling wedge pattern over the past 2 to 3 months—a structure that typically suggests a bullish reversal. Recently, price action confirmed a breakout above the key resistance zone between $2034 and $2040, along with a clean break of the upper trendline of the wedge. These movements point to a strong bullish signal, suggesting potential continuation to the upside.
Currently, Ethereum is approaching a significant resistance level around $2860. If price reaches this zone, we’ll be watching closely for confirmed reversal signals to consider a potential short/sell setup.
On the other hand, the primary bullish trend trade remains valid near the $2160–$2150 support range. A long position will only be considered upon confirmation, such as a bullish engulfing candlestick pattern, market structure shift (MSS), or other trusted technical signals.
Disclaimer: This is not financial advice. Always do your own research (DYOR).

GBP/JPY Potential Bullish ContinuationPound/Yen price seems to exhibit signs of potential bullish momentum as the price action may form a credible Higher Low on key Fibonacci and Support levels.
Trade Plan :
Entry @ 191.37
Stop Loss @ 189
TP 0.9 - 1 @ 193.499

CAD/USD growing more bullishIn this chart we can see the CAD/USD conversion rate has formed a bullish divergence.
This pattern is formed when price action creates lower lows whereas simultaneously the RSI creates higher lows.
This divergence is indicative of a future sharp and sudden rise in price.
Entered (2) 6CM contracts at .72145
Target price of .72645

GBP/USD at a Crossroads: Breakout or Breakdown?The GBP/USD has been in a strong uptrend since early 2025, rallying from around 1.2100 to a recent peak near 1.3450.
The daily chart shows a pullback from this high, indicating consolidation or a corrective phase. Despite short-term bearish pressure, the broader trend remains intact above key support at 1.3200 and 1.3000.
On the hourly chart, price action reveals a consolidation range between 1.3260 and 1.3400, forming lower highs and signaling potential bearish continuation if support at 1.3320 breaks. Conversely, repeated rejections below 1.3400 without major selloffs suggest buyers may still be present.
The 15-minute chart highlights tight intraday consolidation between 1.3335 and 1.3355, forming a potential bear flag or ascending triangle. A break below 1.3320 could target 1.3280–1.3250.
A breakout above 1.3380–1.3400 may resume the uptrend toward 1.3450–1.3500.
The higher-probability scenario is a bullish continuation, but caution is advised given decreasing momentum.

GBPAUD possible bearish for 2.0360#GBPAUD made a new high, then moved in a range 2.0685-2.1010 for a whole month. now support level 2.0685 broken. better to wait for correction/pullback to test the imbalance area between buyers and sellers. ideal level for short is 2.0960-65. stop loss: 2.1050, target: 2.0450 & 2.0360.

CAD JPY Entry Setup 1 hour timeframe CAD JPY Entry Setup
Bearish break and retest
Candlestick confirmation: Doji and clow below
Risk to Reward: 1:3

Canadian Dollar vs US Dollar: Recovering from The Bearish HugsIn previous posts, we have already begun to look at the key factors that have driven the U.S. outperformance over the past decade.
The U.S. market dominance is largely due to the rapid rise of tech giants (such as Apple, Microsoft, Amazon, and Alphabet), which have benefited from strong profit growth, global market reach, and significant investor inflows.
Underperforming Internationally
Markets outside the U.S. have faced challenges such as multiple stifling sanctions and tariffs, slowing economic growth, political uncertainty (especially in Europe), a stronger U.S. dollar, and the decline of high-growth tech sectors.
The Valuation Gap
By 2025, U.S. equities will be considered relatively expensive compared to their international peers, which may offer more attractive valuations in the future.
Recent Shifts (2025 Trend)
Since early 2025, international equities have begun to outperform the S&P 500, and European and Asian equities have regained investor interest. Global market currencies are also heavily dependent on the US dollar.
Factors include optimism around the following three main themes.
DE-DOLLARIZATION. DE-AMERICANIZATION. DIVERSIFICATION.
De-dollarization is the process by which countries reduce their reliance on the US dollar (USD) as the dominant global reserve currency, medium of exchange, and unit of account in international trade and finance. This trend involves a shift away from the centrality of the US dollar in global economic transactions and towards alternative currencies, assets or financial systems.
Reasons for De-dollarization
The move towards de-dollarization is driven by geopolitical and economic factors:
Backlash against US economic hegemony: The US often uses the dollar's dominance to impose sanctions and exert political pressure, encouraging countries to seek financial sovereignty.
Rise of emerging economic powers: Emerging economies such as China and groups such as the BRICS are seeking to reduce their vulnerability to US influence and promote regional integration and alternative financial infrastructures.
Geopolitical tensions: Conflicts such as the war in Ukraine have increased efforts by countries such as Russia to withdraw dollars from their reserves to avoid sanctions.
Summary
De-dollarization is a complex, ongoing process that reflects a gradual shift away from the global dominance of the US dollar. It involves diversifying reserves, using alternative currencies and assets, and creating new financial systems to reduce reliance on the dollar.
Driven by geopolitical tensions and the rise of emerging economic powers, de-dollarization is challenging the entrenched role of the dollar, but is unlikely to completely replace it anytime soon.
Instead, it is leading to a more multi-polar monetary system in international finance, increasing demand for alternative investments in the US.
Technical Test
The main technical chart is presented in a weekly perspective, reflecting the performance of the Canadian dollar against the US dollar FX_IDC:CADUSD over the long term.
With the positive dynamics of the relative strength indicator RSI(14) continuing, a breakout of flat resistance near the level of 0.72 is noted, with the prospect of a possible price increase to 0.80, parity in the currency pair and strengthening of the Canadian dollar to historical maximums, in the horizon of the next five years.
--
Best wishes,
@PandorraResearch Team 😎

GOLD UPWARD SOONThis chart showcases a liquidity grab followed by a potential bullish reaction in Gold (XAU/USD).
Key Technical Highlights:
- Resistance Zone: Clearly defined around the 3,370 level, where price has consistently faced rejection.
- Support Level: Identified near the 3,220–3,230 zone, which was recently swept to collect liquidity.
- Liquidity Zone: Price dipped below support to trigger stop-losses before rebounding, signaling a possible bullish reversal.
Projected Move:
The chart suggests a bounce toward the next target at 3251.225, aligning with a previously broken support now turned resistance.
If momentum sustains, further upside could be explored toward the mid-supply zone.
Summary: The recent liquidity sweep hints at a potential short-term bullish move, with a target retracement to 3251.225. Traders should monitor price reaction at that level for confirmation or rejection.

TARGET SUCCESSFUL
This chart displays a successful bullish breakout on Bitcoin (BTC/USD) from the previous consolidation range.
Key Levels & Zones:
-Resistance Zone: Around 95,576, which was clearly broken with strong bullish momentum.
Support Level: Maintained around 93,592, where price previously bounced from.
Fair Value Gap (FVG): Efficiently filled, providing the base for the bullish rally.
Target Achieved: The price decisively hit and exceeded the projected target of 95.576, confirming the bullish setup.
Market Sentiment: Strong bullish bias with volume surge, indicating continued interest above resistance.
Conclusion: The breakout and target completion validate the strength of the structure and buyer control in this range. Further bullish continuation could be expected if momentum sustains.

XAU/USD Trade Plan 30/4/2025XAUUSD Trade Setup:
We are watching the 3260 resistance level closely. If the market breaks above 3260, we will look for a buy opportunity, targeting the 3390 level.
However, if the market fails to break above 3260 and shows signs of rejection, we will consider a sell setup, with a potential move down toward the next support at 3200.

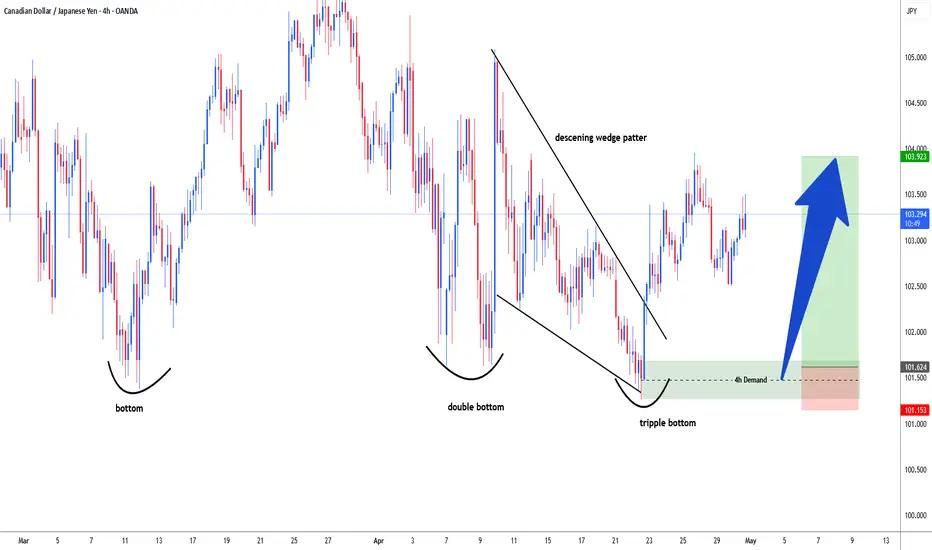
CADJPY possible long 103.60 #cadjpy forming tripple bottom in 4h time frame, large speculators covering huge short positions. 62k shorts position in cad has been reduce which giving impact on cad strength. demand zone for long is 101.60, Sl 101.10, target 103.30 & 103.90.
CAD JPY Entry Setup 1 hour timeframe CAD JPY has formed a bearish break and retest pattern that also align with the 0.50 - 0.618 Fib Retracement, this level has also acted as a very strong resistance level in the past.

BTCUSD (BTC/USD) highlights a consolidation phase within clearly defined support and resistance zones, with price currently poised for a potential move upward.
Key Technical Zones:
- Resistance Area: Around 95,576, which has been tested multiple times with rejections—indicating strong supply.
- Support Level: Strong buying interest observed near the 92,500 region, keeping the structure intact.
- FVG (Fair Value Gap): The price filled the FVG recently, suggesting equilibrium and potential for another leg up.
Current Outlook:
- Price is holding above the FVG and is attempting a bullish rebound.
- If price maintains support above the recent lows, we may see continuation toward the target at 95,576.
Next Target: 95,576
Watch For: Rejection at resistance or volume confirmation to validate a breakout.

GOLD UPWARD COMING SOON Gold (XAU/USD) shows the price currently trading within a defined range between the support level at 3272.581 and the resistance zone around 3367.926.
Technical Highlights:
- Support Level: Strong demand seen around 3272.581 where price has previously rebounded.
- Resistance Zone: 3367.926 marks a key supply area that has held several past tests.
- Current Structure: A bullish corrective move appears underway with the potential to test the target area at 3338.838, aligning with a minor resistance zone.
- Price Behavior: Recent rejection from the support zone indicates bullish pressure; if momentum holds, price is likely to challenge the next resistance.
Next Target: 3338.838
Outlook: If gold sustains above the mid-range support, bullish continuation toward 3338.838 is favored. However, price must break minor resistance cleanly for further upside confirmation.
Would you like a social media caption or short signal text for this as well?

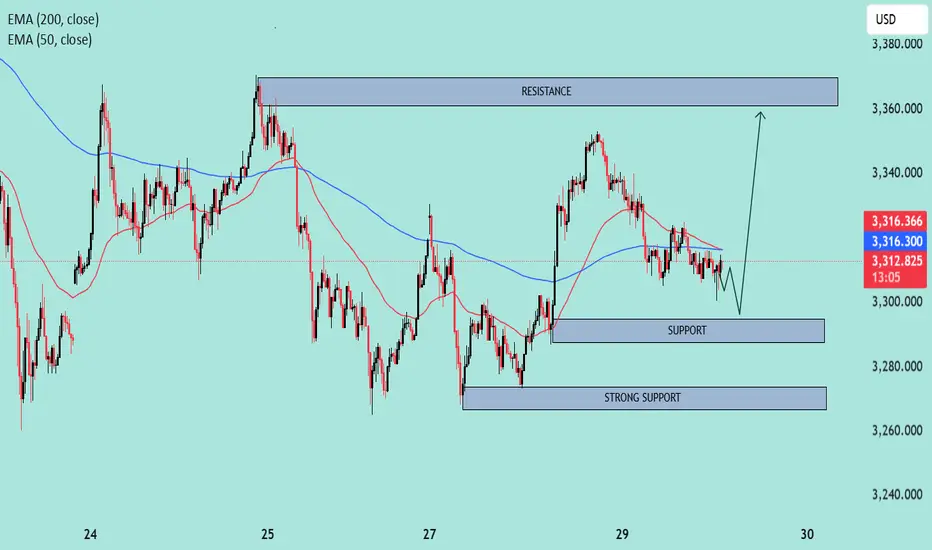
XAUUSD – Bullish Reversal Setup Near Support🟦 Chart Context:
Type: Intraday (likely 15m or 1h timeframe).
Indicators Used:
EMA 50 (Red): 3,316.497
EMA 200 (Blue): 3,316.332
Current Price: 3,312.650
🔍 Technical Analysis:
1. Trend & Moving Averages:
EMA Crossover (Bearish): The 50 EMA is slightly above the 200 EMA, but both are flat and converging, suggesting a neutral to slightly bearish short-term sentiment.
Price below both EMAs indicates bearish pressure in the immediate term.
2. Key Zones:
Resistance Zone: 3,355 – 3,370
Price was previously rejected from this zone, indicating strong supply and likely sell orders.
Support Zone: 3,295 – 3,305
Price has bounced here multiple times, suggesting active buyers.
Strong Support: 3,265 – 3,275
A broader and more historically respected area that could lead to a significant reversal if tested.
3. Price Action:
Currently forming lower highs and lower lows, which is a classic sign of short-term weakness.
A small descending triangle appears to be forming near the support level (bearish bias), but the drawn forecast suggests a potential fakeout breakdown followed by a bullish reversal.
4. Expected Scenario (as per chart projection):
Price might dip briefly into the 3,295–3,305 support, triggering liquidity grab (stop hunts).
A potential bullish rally towards the 3,355–3,370 resistance zone is expected.
This suggests a buy-the-dip strategy near support with tight risk management.
📈 Trade Outlook:
🟢 Bullish Bias:
If the support at 3,295–3,305 holds and price reclaims the 200 EMA convincingly.
Target: 3,355–3,370 resistance zone.
🔴 Bearish Bias:
If price breaks below the strong support (3,265), expect continuation lower.
Downside targets would then extend towards 3,240–3,250.
✅ Conclusion:
Current bias: Neutral to short-term bearish unless the lower support holds.
Key action zone: Watch price reaction around 3,295.
Strategy suggestion: Monitor for a bullish reversal signal at support; avoid chasing trades in the middle of the range.
#USDCAD 1HUSDCAD (4H Timeframe) Analysis
Market Structure:
The price has broken above a key resistance level and is currently showing signs of a retest. A successful retest of the broken resistance as support indicates that buyers are maintaining control, suggesting potential for further upward movement.
Forecast:
A buy opportunity can be considered if the price confirms the retest and starts to show bullish momentum, supporting the continuation of the breakout move.
Key Levels to Watch:
- Entry Zone: Look for buying signals around the retest area of the previous resistance turned support.
- Risk Management:
- Stop Loss: Placed below the retest support zone to manage downside risk.
- Take Profit: Aim for higher resistance zones or key Fibonacci extension levels as potential targets.
Market Sentiment:
The breakout followed by a retest suggests a shift toward bullish sentiment. However, proper confirmation through bullish candlestick patterns or momentum indicators is advised before entering the trade.

#USOIL 4HUSOIL (4H Timeframe) Analysis
Market Structure:
The chart is forming a classic Head and Shoulders pattern, which often signals a potential reversal from an uptrend to a downtrend. The left shoulder, head, and right shoulder are clearly visible, and the neckline is an important support zone to monitor.
Forecast:
A sell opportunity may be considered if the price breaks and closes below the neckline with confirmation. This breakdown could indicate the start of a bearish trend continuation.
Key Levels to Watch:
- Entry Zone: Look for a sell setup once the neckline is broken and retested as resistance.
- Risk Management:
- Stop Loss: Positioned above the right shoulder to minimize risk.
- Take Profit: Target nearby support zones or use a measured move technique based on the pattern's height.
Market Sentiment:
As long as the neckline holds and the breakdown is confirmed, bearish momentum is likely. A failure to break below the neckline would delay or invalidate the selling setup.
