Gold at the $3394-3392 level citing the presence of an engulfingGold Buying Opportunity Analysis
Considering buying gold at the $3394-3392 level, citing the presence of an engulfing buy filter zone that indicates pending buying orders. This technical setup suggests potential support at this level, which could lead to a price bounce.
Potential Upside:
- Conservative estimate: 40-70 pips
- Optimistic scenario: up to 100 pips or more, depending on market conditions and momentum
Key Factors to Consider:
1. Engulfing buy filter zone: This technical indicator suggests buying interest at this level.
2. Pending buying orders: These orders could contribute to a price increase if executed.
3. Market sentiment: Overall market conditions, news, and trends will influence gold's price movement.
Important Reminder:
This analysis is for informational purposes only and should not be considered financial advice. It's essential to conduct your own research (DYOR) and consult with a financial advisor if needed. Trading carries risks, and it's crucial to manage your positions responsibly.
Next Steps:
You'll be waiting for the market to reach the specified level. If it does, carefully evaluate the market conditions and make an informed decision based on your trading strategy and risk tolerance.
How do you plan to manage your trade, and what are your risk management strategies?
Forexmarket

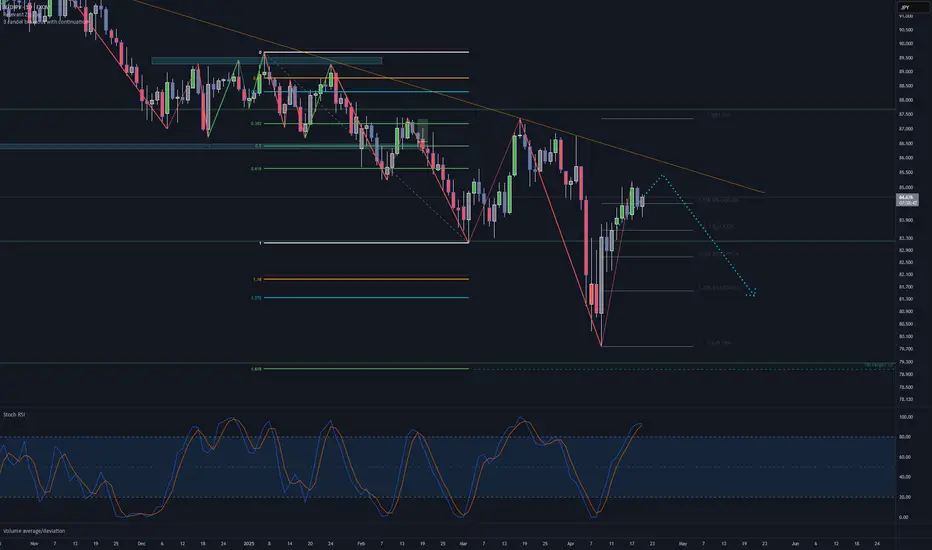
NZDJPY short oportunityWatch for end of retracment trade!
I think this can be good RR oportunity, the Target is to Low of previousextension.
On 4 chart we are already see some bearih divergances, But still in uptrend. Soo wiat for some kind of confirmation.
Trade safe ;)
CAD JPY Sell Trade Setup H1CAD JPY has not fully dropped into the demand zone yet but its creating a bearish break and retest pattern that also align with the 0.50 - 0.618 Fib Retracement level.
Once this pattern is confirmed we will be selling into the demand zone.

CAD JPY Entry Setup 1 hour timeframe On the 1 hour timeframe CAD JPY has formed a demand level around price 102.000.
Now we wait for price to drop into the demand level before looking for buying opportunities
Entry will be base on candlestick confirmation.

CAD JPY Trade Setup Daily timeframe On the daily timeframe CAD JPY is bouncing from a strong support area that has been respected since August 2024.
So we will be looking for buying opportunities from the lower timeframe.
Check next post for entry setup

USOIL Chart Overview:
WTI Crude is trading around 61.44, consolidating inside a key resistance zone near62.00. After a strong bullish impulse, price has stalled under this resistance, forming both bullish and bearish paths, highlighting a conflicting market structure
Key Discrepations Identified:
1. Bullish Momentum vs. Resistance Reaction
- Expected: Continuation to 64+ after breakout.
- Reality: Price is struggling below resistance, rejecting upper boundary multiple times.
- Discrepation: Bullish momentum is slowing, and repeated rejections are exposing potential reversal pressure.
2. Volume Strength vs. Breakout Potential
- Volume d…
- Visually this implies strength, but price is hovering in indecision, neither breaking up nor down convincingly.
- Discrepation: Chart setup shows both bullish continuation and bearish breakdown possibilities, confusing structure
4. Double Scenario Projection
- The projection shows both:
- A bullish breakout to 64.
- A rejection and selloff to 58.
- Discrepation: Market is giving mixed technical signals, suggesting traders should wait for confirmation before committing
Discrepation Summary Table:
| Element | Expectation | Observed Reality | Discrepation | Projection Conflict | Clear trend continuation | Dual projection shown | Market indecision + low conviction |
📉 Conclusion:
While WTI remains inside a short-term bullish structure, the presence of conflicting breakout signals, resistance rejections, and declining volume point toward a discrepation. Traders should watch the 62.00 resistance zone closely. A clear rejection or breakout will resolve this divergence, with downside targeting 58.00, and upside toward $64.00.
Let me know if you'd like a summarized version for a caption or post!

BTCUSDBitcoin is currently trading near 84,949 after a strong rally, now approaching a critical order block resistance near86,000. While the overall structure remains bullish, the chart signals a potential shift in market behavior—creating a clear discrepation between price structure and projected move.
Discrepation Breakdown:
1. Rising Trend vs. Order Block Reaction
- Expected: Uptrend to continue, breaking through the resistance zone.
- Actual: Price is hesitating and forming a double-top structure inside the order block, hinting at buyer exhaustion.
- Discrepation: A bullish structure failing to maintain momen…
- Recent candles show weak buying volume near the top despite higher prices.
- Discrepation: Price is rising, but volume is not supporting it—bearish divergence, weakening the bullish outlook.
4. Fair Value Gap (FVG) Overlap
- FVG zone around 82.2k aligns with the bearish target, giving confidence to downside movement.
- Market may seek to fill that gap, creating a conflict with the bullish price structure currently visible.
Discrepation Summary Table:
| Technical Element | Market Expectation | Observed Conflict
| Uptrend + Higher Highs | Continuation toward 86,000+ | Double-top …
Although Bitcoin remains in a short-term uptrend, this chart shows clear bearish discrepation. The failure to break the order block, combined with volume divergence and trendline pressure, suggests a potential drop toward $82,232, especially if price confirms the double-top and breaks the ascending trendline.
Would you like a short version of this for social media captions too?

GOLD The chart shows price moving in a tight consolidation zone between the resistance area near 3,245 and support at3,213. While the price has tested the resistance multiple times, it has failed to break out decisively, indicating possible bearish weakness emerging.
---
🔍 Discrepation Zones (Key Conflicts):
1. Price vs. Resistance Reaction
- Expected: Breakout continuation above $3,245 due to repeated testing.
- Actual: Price rejected again after touching resistance.
- Discrepation: Buyers are unable to sustain upward momentum, revealing fading bullish strength despite frequent attempts.
---
2. Volume Behavior vs. Price Actio…
This hidden bearishness suggests sellers may be stepping in before each breakout attempt completes.
—
4. Target Discrepancy at3213.070
- While current price appears stable, the projection clearly anticipates a pullback to 3213.070.
- This level sits just above a major support block, marking a key imbalance between current consolidation and the expected move down.
—
🧭 Discrepation Summary Table:
| Element | Expected Behavior | Observed Behavior | Discrepation |
|————————–|——————————-|————————————-|———————————————|
| Resistance Test | Breakout after repeated tests | Another rejection | Buyers failing to gain momentum |
| Volume Analysis | Increased …
: Gold is showing signs of hidden bearish pressure. Although still inside a range, multiple failed breakout attempts, declining volume, and a projected drop to3213.070 point to a clear discrepation between expected bullish continuation and emerging bearish signals.
📌 Watch how price behaves near the $3,230 level. A decisive break could validate the bearish target, especially if volume increases on the move down.
Let me know if you want this turned into a social post or shorter caption!

GOLD This 1-hour chart of Gold (XAU/USD) presents a detailed technical outlook showing a bullish breakout from a downtrend, followed by a strong rally, and a potential upcoming retracement.
Key highlights from the chart:
- The price previously broke out from a descending trendline, confirmed by the breakout above the 3,132.939 resistance level, followed by a continuation of the uptrend.
- The chart shows multiple FVGs (Fair Value Gaps) and support/resistance zones, which have been respected throughout the price movement.
- After bottoming out around 2,974.936, Gold began a bullish rally, forming higher highs and breaking past the 3,067.613 and 3,139.363 levels.
- The recent high around 3,220 marks a resistance zone, where price has currently stalled and is showing …
The volume profile shows a strong increase during bullish movements, indicating strong buyer interest. Traders will be watching the 3,168–3,150 zone closely—if it holds as support, it may offer a fresh opportunity for long positions toward a retest of 3,220 or higher. However, a break below this zone could signal a deeper correction.
Summary:
- Trend: Bullish
- Current Action: Pullback from resistance
- Watch Support: 3,168.521
- Potential Setup: Buy on pullback if support holds, otherwise wait for confirmation before re-entry.

BTCUSD Market Discrepancy Analysis (April 11, 2025)
📉 Chart Overview:
The chart reflects Bitcoin (BTC/USD) on the 1-hour timeframe, with significant price movements between 77,417 (support) and 83,846 (resistance). The asset recently rallied to fill a Fair Value Gap (FVG) before facing resistance and dropping back to retest the lower region.
1. Resistance Rejection at $83,846:
- The price spiked aggressively into the resistance zone, but quickly reversed after failing to sustain above it.
- This price rejection is clear evidence of strong seller presence.
- The FVG zone just below the resistance appears to have been filled, triggering a sharp correction.
2. Failed Breakout or Bull Trap:
- The s…
- This suggests that buying pressure was temporary, and mostly driven by short-term momentum traders rather than real demand.
4. Incomplete Fair Value Gap at77,417:
- Price moved sharply down and almost touched the FVG area near 77,417, but did not completely fill it.
- This leaves an imbalance and suggests that the market may revisit this area to fully mitigate it.
5. False Break of Lower High:
- The high near 82,290 was breached temporarily, but price did not close above convincingly.
- Indicates a fake breakout structure within a broader bearish context.
---
🔧 Technical Summary:
| Zone | Level | Status |
|------------------|-----------------|-------------------------|
| Resistance | 83,846 | Rejected |
|…
This chart shows a clear discrepation between price momentum and volume confirmation. While price temporarily surged into a resistance zone, it lacked the strength to hold above key breakout levels, suggesting the rally was unsustainable.
> The Fair Value Gap (FVG) at77,417 remains unfilled, and current price structure points to a potential return to that zone. Expect bearish continuation unless BTC reclaims and sustains above $82,290 with volume.
---
Let me know if you want this in a simplified caption format for social sharing!

BTCUSD TARGET COMPLETE Market Analysis for Bitcoin (BTC/USD) – April 10, 2025
Price Action Overview:
- Bitcoin (BTC) is currently consolidating between 79,161 and 81,520, with price action forming within this range. A move to 79,161 has been achieved, completing the target and fulfilling the bearish target outlined earlier.
- BTC seems to be struggling around 81,500, and is showing potential signs of exhaustion at the upper end of the range near the resistance zone.
Key Levels to Watch:
1. Resistance Zone (Red Box):
- The resistance level is clearly marked near 82,000 and 81,500, with price struggling to break above this level. If Bitcoin fails to break out of this resistance zone, the price could reverse towards support levels.
- The upper resistance zone remains a key level…
ChatGPT: - An FVG (Fair Value Gap) is evident in the 79,161 to 78,500 region. This could act as an area to fill, and could potentially see price retracement or sideways consolidation before a possible move up.
Market Structure Analysis:
- Bearish Trend: Bitcoin's price has been on a downward trend forming a descending triangle, indicating bearish sentiment.
- Breakout Potential: A breakout from the current consolidation zone will be important. Bitcoin will likely test 79,161 again. If it fails to hold support, further downside may be possible.
Volume & Momentum:
- Volume: The volume analysis shows increasing buying volume at lower levels, suggesting potential support around 79,161. However, the volume is diminishing at resistance levels, which indicates that bullish…

USOIL Oil – April 10, 2025
Price Action & Trend Analysis:
- Current Market Position:
- WTI Crude Oil is showing a bearish trend within a falling wedge pattern, a technical formation that often signals a potential breakout after consolidation. This pattern is visible with converging trendlines (blue), which suggest a potential move to the downside.
- The resistance zone is marked at 61.50, and the price is struggling to break above this level. If it does not break out of this level, further downside momentum may be expected.
Key Levels:
1. Resistance Zone:
- The resistance level is clearly marked near 61.50, and price action has repeatedly struggled to move above this level, showing signs of rejection. A failure to break this l…
ChatGPT: 4. FVG (Fair Value Gap):
- There is a Fair Value Gap (FVG) near 58.12, which indicates a possible area of imbalance where price could potentially retrace to fill the gap before moving in its next direction.
Volume Analysis:
- The volume profile indicates decreasing volume as the price approaches the resistance zone at 61.50, which may suggest a weakening of bullish momentum.
- The increasing volume near the support level at 58.00 suggests that buyers are looking to step in at these levels, but this remains to be seen as the price moves toward this region.
Key Observations:
- The bearish divergence observed between price and momentum suggests that bearish pressure is mounting, especially with the price failing to breach resistance and forming lower highs.
- T

GOLD Chart Analysis for Gold (XAU/USD) – April 10, 2025
Key Observations:
1. Price Action and Trend:
- The price is currently in an uptrend, forming a bullish channel (green box) as it moves upwards.
- Resistance is positioned near 3,134.588 and 3,123.580 which are key levels to watch for potential price rejection or breakout.
- Support levels are defined at 3,067.613 and 2,974.936. The price has recently bounced off the support level, suggesting that the trend is still intact and may continue to push higher.
2. Key Levels:
- Resistance: The resistance level near 3,134.588 is being tested currently. A breakout above this level could indicate further bullish momentum.
- Support: The support zone near 3,067.613 is crucial. If the price drops below thi…
ChatGPT: - The volume bars show a spike in activity, suggesting market indecision, but also strong bullish sentiment near the support level.
4. Target Price and Future Projections:
- The target price for this move is 3,134.588, where the price is expected to test resistance. If it breaks this level, the next target could be near 3,150.00.
- The bullish channel suggests that Gold is still trending upward, and the price is likely to continue moving towards the upper boundary of the channel.
Scenario Predictions:
1. Bullish Scenario:
- If Gold successfully breaks the resistance at 3,134.588, it could continue to push higher towards the next resistance zone around 3,150.00.
- Support level at 3,067.613 holds strong, and the price continues to make higher highs…

NZDUSD Faces Resistance After Recent Sell-OffFollowing the significant sell-off last week, the NZDUSD price has retraced to approximately 60% of the previous bearish move. The price appears to have encountered resistance at a zone marked by an upward trendline and the boundary of the channel. Additionally, there is a psychological level at 0.57000. Should the price reject this resistance, it may continue to decline and retest the middle of the consolidation range. On the other hand, if upcoming news releases favour the market, there could be potential for a move higher. The target for the market is a resistance zone near 0.55940

XAUUSD BUY TARGET SUCCESSFUL HITTING READ IN CAPTIONSHere's a descriptive analysis of the chart you provided, which is a technical analysis chart for Gold (CFDs on Gold, USD/OZ) as of April 9, 2025:
---
Chart Description: Gold (XAU/USD) Price Action Analysis
Time Frame: Intraday (Likely 1-hour or 2-hour candles)
Volume: Displayed at the bottom in green/red bars, showing buying and selling pressure.
Key Highlights:
1. Downtrend Channel:
The price has been moving within a downward channel (marked by red and blue trendlines).
Several lower highs and lower lows were observed until a breakout occurred.
2. Support and Resistance Levels:
Support Level: Around 2,974.936 – This acted as a solid base before the bullish reversal.
Resistance Zone: Around 3,132.939 - 3,137.725 – This area is expected to be a stron…

BTCUSD ChatGPT: Chart Analysis for Bitcoin (1-Hour Timeframe) – April 08, 2025
Key Observations:
1. Price Action and Trend:
- Bitcoin is in a downtrend, as indicated by the blue descending trendlines, creating lower highs and lower lows.
- The resistance zone is near 80,000, with 79,161 acting as a key level of resistance.
- Price is currently approaching the support level, which is in the range of 75,000 to 77,000, indicating a potential area for price reversal or further decline.
2. Order Block and FVG (Fair Value Gap):
- The order block located near 79,161 to $79,000 is an important zone where price rejected and fell previously. This suggests that sellers have been controlling this level, and it may act as a strong resistance again if the price revisits.
- …
ChatGPT: - As Bitcoin approaches the support level, a surge in volume could indicate a possible breakout or a reversal from the support zone.
4. Target and Potential Movement:
- The target for the current setup is 79,161, near the upper resistance zone, with potential upward momentum from the support area.
- Bitcoin is likely to reach the 79,161 target after bouncing from the support zone. However, if the price fails to break through the resistance, a drop back to the support zone or even further downward movement may occur.
Potential Scenarios:
- Bullish Reversal: If Bitcoin bounces from the support level and breaks above the resistance at 79,161, it may push higher towards 80,000 and beyond. The FVG area will be a critical point to monitor for further upward m…
ChatGPT: Currently, Bitcoin is at a pivotal point, testing support while trying to break through resistance. The next price action will depend on how Bitcoin reacts at these key levels. Traders should keep an eye on 79,161, which could be a crucial turning point for the market direction. If the support holds, a reversal is possible, but failure to maintain the support could lead to further declines.

USOIL ChatGPT: Chart Analysis for WTI Crude Oil (1-Hour Timeframe) – April 08, 2025
Key Observations:
1. Trend and Price Action:
- WTI Crude Oil has been trading in a range-bound pattern, as shown by the blue trendlines. The price has been bouncing between the resistance and support levels. Currently, the price is at the lower end of this range near the support level around 58.88.
- The resistance level is at 59.05, and this has been tested multiple times without a sustained breakout, indicating that sellers have been in control around this level.
- The price just tested the support level and bounced slightly higher, which suggests the market may be consolidating before deciding the next move.
2. Order Block and FVG (Fair Value Gap):
- The order block is located…
ChatGPT: - Fair Value Gap (FVG) has been formed around the order block. This means there’s an imbalance in the market that could eventually be filled. Traders should watch for price action near this gap for further insight into whether the gap will be filled or left untested.
3. Volume:
- Volume is relatively low, which suggests a lack of strong momentum in the market. This is typical in range-bound markets, where buying and selling activity are often balanced.
- However, the volume has spiked during the downward move, which could indicate a potential bearish continuation if the price breaks below 58.88.
4. Bearish Setup and Target:
- The chart is showing a bearish setup with the price trading below the resistance zone, and it is testing the support level near

BTCUSD ChatGPT: This chart shows Bitcoin (BTC/USD) on a 4-hour timeframe with key price levels, trends, and targets identified. Let's break down the analysis and potential scenarios for the future price movement:
Key Observations:
1. Price Action & Trend:
- The price of Bitcoin has been in a downward trend, forming a descending channel (shown with blue trendlines). The price has been making lower highs and lower lows, indicating bearish market conditions.
- Recently, Bitcoin tested the resistance zone around 84,067, and after multiple rejections at this level, the price has started to decline.
2. Resistance Zone:
- The resistance zone is marked at 84,067, a key price point where Bitcoin has faced multiple rejections. This level represents a supply zone, and traders …
ChatGPT: 4. Bearish Price Action:
- The chart shows a sharp bearish drop after hitting the resistance zone, suggesting that the market is currently in a correction phase. The price has fallen from higher levels toward the support zone and is likely to experience further downside pressure.
5. Target Level:
- The target for the ongoing bearish move is marked as 78,885, which lies just above the support level at 77,082. This target indicates a potential continuation of the decline towards this support level, and if this support holds, it could be a buying opportunity for a bounce.
Potential Scenarios:
1. Bearish Continuation:
- If the price continues its decline and breaks below 77,082, it would suggest a bearish breakout, with the next target around 78,885 or eve…
ChatGPT: - If the price approaches the 77,082 support level and shows signs of rejection (such as forming a bullish engulfing candle or double bottom pattern), there could be a reversal towards the resistance level at 84,067. In this case, traders may look for a long position, targeting the resistance zone for profit-taking.
3. Consolidation and Range-Bound Behavior:
- There is also a possibility that the price could start consolidating between the resistance and support levels, moving in a sideways pattern. If the price repeatedly tests these boundaries without breaking through, traders can look for range-bound trading strategies with buy orders at support and sell orders at resistance.
4. Breakout Above Resistance:
- If the price breaks above the resistance zone…
ChatGPT: The current chart suggests that Bitcoin is in a downtrend, facing resistance at 84,067 and heading towards the support zone at 77,082. Traders should monitor price action at this support level for potential bounces or breakdowns. If the price rebounds at 77,082, it could move back to test the resistance at 84,067. Conversely, if the price breaks below the support, further downside movement may occur with a target around 78,885 or lower. The descending channel provides a structured view of the market, and a breakout could lead to a bullish reversal or continuation of the bearish trend.

GOLDThis chart represents Gold (XAU/USD) on a 1-hour timeframe. Several key price levels and technical patterns are identified, including resistance zones, FVG (Fair Value Gaps), and target levels. Let's break down the analysis:
Key Observations:
1. Price Action & Trend:
- The price of Gold has been moving downward, as seen from the red trendlines marking a downtrend. The price has faced resistance around the 3,141.644 level, which has acted as a strong supply zone. Following this, Gold showed a sharp decline towards lower levels.
2. Resistance Zone:
- The resistance zone is marked at 3,141.644, which corresponds to a region where the price has previously encountered selling pressure. This level seems to have rejected the price multiple times, confirming it…- The FVG gap is highlighted around the range 3,120.00 - 3,141.644. An FVG represents an area where the price imbalance occurs, typically after a sharp price movement. In many cases, the market returns to fill the gap before continuing in the direction of the initial move. The FVG zone in this chart likely indicates a potential for a price retracement or consolidation before further price action.
- As the price moves downward, the FVG zone is tested, and it might act as a rejection zone if the price moves back into it, suggesting a short trade opportunity.
4. Downward Price Movement:
- The sharp bearish movement observed from the resistance level at 3,141.644 shows a breakdown, confirming a trend reversal. This move pushes the price below the previous su…

Downside Risk Grows for NZD/USD After Structure FailThe NZD/USD pair has broken down from a well-defined rising wedge pattern, signaling a shift in short-to-medium term momentum. After trending within this rising structure for several weeks, price has now decisively violated the lower trendline, confirming a bearish breakout. The move coincides with a sharp rejection near the 200 EMA, which continues to act as dynamic resistance overhead.
Price is now hovering around a key support zone between 0.555 and 0.558 — a level that has historically served as a pivot point. The breakdown is also supported by a clear bearish RSI divergence, where price made higher highs while RSI formed lower highs, indicating weakening momentum. Currently, the RSI sits at around 32.47, approaching oversold territory but not yet showing signs of bullish reversal.
If the current support zone fails to hold, we could see further downside pressure, potentially driving the pair toward the next major support region near 0.548–0.540. On the other hand, if buyers step in and absorb the sell-off at these levels, a relief bounce toward the broken trendline or the 200 EMA could be expected — though such a move may face strong resistance.

euraud sell signal. Don't forget about stop-loss.
Write in the comments all your questions and instruments analysis of which you want to see.
Friends, push the like button, write a comment, and share with your mates - that would be the best THANK YOU.
P.S. I personally will open entry if the price will show it according to my strategy.
Always make your analysis before a trade

UK100 Technical Analysis 🔹 Trend Overview:
UK100 is currently consolidating between key support and resistance levels, suggesting a potential breakout scenario.
🔹 Key Levels:
📈 Resistance: 8,727 – A breakout above this level could push price toward 8,818.
📉 Support: 8,627 – If broken, price may drop toward 8,475.
🔹 Market Structure:
✅ Price is in a range-bound phase, with a possible breakout in either direction.
🚀 Bullish scenario: Break above 8,727 → Retest → Target 8,818 → 8,912.
⚠️ Bearish scenario: Rejection at 8,727 → Drop to 8,627 → Break → Target 8,475.
🔹 Trade Idea:
Bullish above 8,727 with targets at 8,818 and 8,912.
Bearish below 8,627 with targets at 8,475.
📌 Risk Management: Wait for confirmation of breakout or rejection before entering trades.

EUR USD Entry Setup 30M Timeframe🔹 Pattern: Double Bottom
🔹 Entry Condition: Wait for a clean break and retest of the neckline before entering.
No confirmation = No trade.
🔹 Higher Timeframe Context: Overall trend is bearish: this is just a pullback to the Lower High before a potential continuation of the downtrend.
⚠️ Patience is key let’s see how it plays out!
