Deep dive into EUR/USD analysis along with GBP & JPYIn this video I go into what I'm currently looking at on the EUR/USD, GBP/USD and USD/JPY.
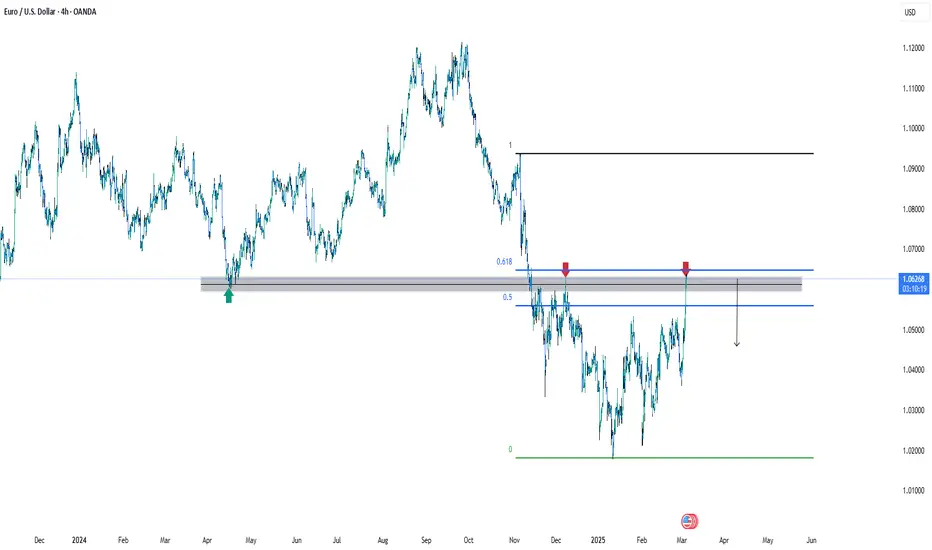
Leaning towards the bearish side for EUR/USD, I want to see us take out 1.0800 before I have more conviction. I will continue to cautiously hold short positions for a possible run down towards 1.0600 area or the yearly pivot zone.
Hope you enjoy this analysis.
Good Luck and Trade Safe.
Forexmarket

UsdJpy buy continuation Taking Yesterday's low as Inducement my point of interest is 149.034. I'm anticipating price to retrace back to that zone before pushing toward.
Kindly boost if you find this insightful 🫴

#EURCHF 4HEURCHF (4H Timeframe) Analysis
Market Structure:
The price is currently testing a well-established trendline resistance, which has previously acted as a barrier for upward movement. Sellers have shown strong presence at this level, leading to potential downside pressure.
Forecast:
A sell opportunity may emerge if the price faces rejection at the trendline resistance and forms bearish confirmation. If the resistance holds, the market may continue its downward movement.
Key Levels to Watch:
- Entry Zone: Selling near the trendline resistance after confirmation of rejection.
- Risk Management:
- Stop Loss: Placed above the trendline resistance to minimize risk.
- Take Profit: Target lower support zones or previous swing lows.
Market Sentiment:
If the price remains below the trendline resistance, the bearish outlook stays valid. However, a breakout above this level could shift sentiment toward further bullish movement.

#USDCAD 4HUSDCAD (4H Timeframe) Analysis
Market Structure:
The price is currently trading within a well-defined downtrend channel and has reached the upper boundary, which is acting as strong resistance. Previous price action suggests that sellers have been active at this level, leading to potential bearish pressure.
Forecast:
A sell opportunity may arise if the price fails to break above the channel resistance and shows signs of rejection. If the resistance holds, further downside movement is expected within the channel structure.
Key Levels to Watch:
- Entry Zone: Consider selling near the channel resistance upon confirmation of bearish rejection.
- Risk Management:
- Stop Loss: Placed above the channel resistance to manage risk.
- Take Profit: Target lower levels within the channel, aligning with previous support zones.
Market Sentiment:
As long as the price remains within the downtrend channel and respects the resistance, the bearish trend is likely to continue. However, a breakout above the resistance may shift the market sentiment toward bullish movement.

#XAUUSD #GOLD 4HXAUUSD (4H Timeframe) Analysis
Market Structure:
Gold is currently facing resistance at a descending trendline, which has been limiting upward movement. This trendline has acted as a strong barrier, preventing the price from breaking higher. Sellers are likely to step in at this level, increasing bearish pressure.
Forecast:
A sell opportunity may arise if the price respects the trendline resistance and shows bearish confirmation signals. If the price fails to break above this level, further downside movement can be expected.
Key Levels to Watch:
- Entry Zone: Consider selling near the trendline resistance if the price shows rejection.
- Risk Management:
- Stop Loss: Placed above the trendline resistance to minimize risk.
- Take Profit: Target lower support levels where buyers may step in.
Market Sentiment:
If the trendline resistance remains intact, sellers may dominate the market, leading to a potential downward move. However, a breakout above the resistance could shift sentiment toward a bullish scenario.

#USOIL/WTI 1 DAYUSOIL/WTI (1D Timeframe) Analysis
Market Structure:
The price is currently trading near a key support level, which has previously acted as a strong demand zone. Buyers may step in at this level, leading to a potential reversal or bounce.
Forecast:
A buy opportunity is expected if the price holds above the support level and shows signs of bullish momentum. Confirmation through price action, such as bullish candlestick patterns or increased volume, can strengthen the trade setup.
Key Levels to Watch:
- Entry Zone: Consider buying near the support level if the price confirms a bounce.
- Risk Management:
- Stop Loss: Placed below the support level to manage downside risk.
- Take Profit: Target resistance levels or previous swing highs for potential gains.
Market Sentiment:
If the support level holds, the market sentiment may shift towards the upside, leading to a potential bullish move. However, a breakdown below support could indicate further weakness, requiring reassessment.

#AUDNZD 1DAYAUDNZD (1D Timeframe) Analysis
Market Structure:
The price has recently broken down from a triangle pattern, indicating a potential shift in market sentiment towards the downside. The breakdown suggests that selling pressure has overtaken buying interest, leading to a bearish bias.
Forecast:
A sell opportunity is anticipated following the triangle breakdown. If the price retests the broken support level as resistance and confirms rejection, further downside movement is likely.
Key Levels to Watch:
- Entry Zone: Consider entering a sell position after a retest and rejection of the broken triangle support.
- Risk Management:
- Stop Loss: Placed above the retest level or recent swing high.
- Take Profit: Target nearby support levels for potential profit.
Market Sentiment:
The breakdown of the triangle pattern highlights bearish sentiment, with potential for continued downward movement. Waiting for confirmation on a retest can improve trade reliability.

#GBPUSD 4HGBPUSD (4H Timeframe) Analysis
Market Structure:
The price is currently trading near a key resistance area, where previous selling pressure has been observed. This level has historically acted as a barrier, rejecting upward movements and leading to price declines.
Forecast:
A sell opportunity is anticipated from the resistance area if the price shows signs of rejection, such as bearish candlestick patterns or a decrease in buying momentum.
Key Levels to Watch:
- Entry Zone: Consider entering a sell position if the price fails to break above the resistance and confirms rejection.
- Risk Management:
- Stop Loss: Placed above the resistance area or recent swing high to manage risk.
- Take Profit: Target nearby support levels for potential downside movement.
Market Sentiment:
The resistance area is a critical zone to monitor for potential price reversal. Confirmation through bearish signals is recommended before executing a trade.

#CHFJPY 4HCHFJPY (4H Timeframe) Analysis
Market Structure:
The price has successfully broken out of the downtrend resistance line, indicating a potential shift in market sentiment from bearish to bullish. This breakout suggests that buyers are gaining strength and may push the price higher.
Forecast:
A buy opportunity is anticipated following the breakout. It is advisable to watch for a potential retest of the broken resistance line, which could now act as support, for additional confirmation.
Key Levels to Watch:
- Entry Zone: Consider buying after a confirmed breakout and potential retest of the previous resistance turned support.
- Risk Management:
- Stop Loss: Placed below the retest level or recent swing low to manage risk.
- Take Profit: Target the next key resistance levels for potential upside gains.
Market Sentiment:
The breakout from the downtrend resistance signals bullish sentiment. Confirmation through price action or candlestick patterns will strengthen the probability of an upward move.

#NZDUSD 1DAYNZDUSD (1D Timeframe) Analysis
Market Structure:
The price is approaching a significant support level, which has previously acted as a key area for price reversals. This level is important for identifying potential buying opportunities.
Forecast:
It is recommended to wait for the price to reach the support level. If bullish confirmation is observed, such as bullish candlestick patterns or increased buying momentum, a buy position can be considered.
Key Levels to Watch:
- Entry Zone: Monitor the price behavior near the support level and consider buying if a clear bounce or bullish signal is confirmed.
- Risk Management:
- Stop Loss: Placed below the support zone to protect against a potential breakdown.
- Take Profit: Target the next resistance levels for potential gains.
Market Sentiment:
Confirmation of bullish sentiment will depend on how the price reacts at the support level. A strong bounce would indicate potential for upward movement, while a breakdown may signal further downside. Waiting for confirmation will provide better trade accuracy.

CAD JPY Entry Setup 30 mins timeframe Bearish Break and Retest
Pattern confirmed.
Now we wait for candlestick confirmation. ⏰

Will it move in a BEARISH direction? GBPUSDI am checking GBPUSD schematics, waiting for bearish confirmation in this wyckoff schematics. Full of Liquidity Manipulations since last week march 3-7 2025. Patience is key as it develops.
-Once it confirms the direction I will join Bearish Traders here. 😁😁
Rundown of TF:
Daily---> 4H---> 1H---> 15min----> 5 min.
#proptrader
#discipline
#growthoriented
#consistency

FX Pre Market Analysis - Is the EUR/USD explosion slowing down?In this week's pre market analysis video, I go over the completed EUR/USD trade and what I'm looking for moving forward. The EUR/USD had an explosive bullish move last week however, there could be indications of momentum slow down.
Currently holding short at 1.0815 and would like to see us stay below 1.0900 - 1.9500 max for a pullback towards 1.06000.
The long term perspective could indicate a pullback out of a large triangle formation, followed by equal or new lows below 1.0000.
Good Luck and Trade Safe.

#AUDUSD 1DAYAUDUSD (1D Timeframe) Analysis
Market Structure:
The price has successfully broken above the trendline resistance, indicating a potential shift towards bullish momentum. This breakout suggests that buyers are gaining strength and further upward movement can be expected.
Forecast:
A buy opportunity may arise as long as the price sustains above the broken trendline, confirming the breakout.
Key Levels to Watch:
- Entry Zone: Consider a buy position after a successful retest of the broken trendline or upon confirmation of bullish momentum.
- Risk Management:
- Stop Loss: Placed below the retest level or recent swing low to manage risk.
- Take Profit: Targeting key resistance levels based on historical price action.
Market Sentiment:
The breakout above the trendline resistance signals a positive market sentiment. A retest and sustained move above the breakout level can strengthen the bullish outlook.

#EURUSD 1DAYEURUSD (1D Timeframe) Analysis
Market Structure:
The price is currently facing resistance and has formed a sell engulfing pattern, indicating potential bearish pressure. This suggests that sellers are gaining control and a downward move may be expected from this level.
Forecast:
A sell opportunity may arise if the price continues to respect the resistance level and confirms bearish momentum.
Key Levels to Watch:
- Entry Zone: A sell position can be considered near the resistance zone after confirmation of bearish price action.
- Risk Management:
- Stop Loss: Placed above the resistance zone to manage risk.
- Take Profit: Target key support levels based on previous price action.
Market Sentiment:
The formation of a sell engulfing pattern at resistance indicates strong selling interest. Confirmation of bearish momentum can provide a better validation for a sell setup.

What Is a Spot Rate and How It Is Used in Trading?What Is a Spot Rate and How It Is Used in Trading?
Spot rates are a cornerstone of trading, reflecting the real-time price for immediate settlement of assets like currencies and commodities. They provide traders with crucial insights into market conditions and influence strategies across various domains. This article explores what spot rates are, how they work, and their role in trading.
Spot Rate Definition
The spot rate is the current price at which an asset, such as a currency, commodity, or security, can be bought or sold for immediate delivery. In essence, it’s what the market says something is worth right now, reflecting real-time supply and demand. Unlike future prices, which are influenced by expectations and contracts for later delivery, this type of pricing is all about the present.
Spot rates are especially crucial in highly liquid assets like forex and commodities, where prices can change rapidly based on global events. To use an example, if the rate for the euro against the dollar is 1.1050, that’s the price at which traders can exchange euros for dollars at that moment. It’s dynamic, adjusting instantly to factors like economic news, interest rate changes, and geopolitical developments.
Spot pricing also serves as a benchmark in derivative contracts, such as futures, influencing how traders and businesses hedge against potential price movements. For instance, a gold producer might monitor these quotes closely to decide when to lock in prices.
Spot Rate vs Forward Rate: What's the Difference
The spot and forward rates (or spot rate vs contract rate) are both used to price assets, but they serve different purposes. While the spot rate is the current price for immediate settlement, the forward rate is the agreed-upon price in a transaction set to occur at a future date.
The former reflects conditions right now—shaped by immediate supply and demand. Forward rates, on the other hand, factor in expectations about future conditions, such as borrowing cost changes or potential economic shifts. For example, if a company expects to receive payments in a foreign currency within a certain period, it can use a forward rate to guarantee the amount it will receive and avoid adverse exchange rate fluctuations.
One key link between the two is that forward rates are derived from spot pricing, adjusted by factors like interest rate differentials between two currencies or the cost of carrying a commodity. In forex trading, if borrowing costs in the US are higher than in the eurozone, the forward rate for EUR/USD may price in a weaker euro relative to the dollar.
Specifically, a forward rate is determined by three factors: its underlying spot rate, interest rate differential, and the contract’s time to expiry.
Backwardation and Contango
Backwardation and contango are terms used to describe the pricing structure of futures markets, specifically the relationship between spot prices and futures contract prices. These concepts help traders understand broader expectations and supply-demand dynamics.
In backwardation, the spot price of an asset is higher than its future prices. This often happens when demand for immediate delivery outweighs supply. In the oil market, backwardation might occur if there’s a short-term supply disruption, causing the current price to spike while future prices remain lower, reflecting expectations of supply returning to normal.
On the other hand, contango occurs when future prices are higher than spot quotes. This can indicate that holding costs, such as storage fees or insurance, are factored into the future price. For instance, in gold, contango might be typical since storing gold involves costs, which are priced into future contracts.
These structures aren’t just theoretical—they directly affect trading strategies. CFD traders can use these concepts to anticipate market movements and hedge against adverse price changes. By understanding market sentiment and expectations, traders can speculate on the direction of prices.
How Spot Rates Are Determined
Spot prices are dynamic and reflect the immediate balance of supply and demand. They fluctuate based on several key factors that shape trading activity and market conditions.
- Supply and Demand Dynamics: When demand for an asset outpaces its supply, the rate rises, and vice versa. For example, a spike in demand for oil due to geopolitical tensions can push its price higher.
- Economic Indicators: Inflation data, GDP growth, and employment figures heavily influence spot quotes, particularly in forex. A strong economic report can lead to currency appreciation, while weak data may have the opposite effect.
- Interest Rate Differentials: In forex, differing interest rates between countries impact currency spot rates. Higher borrowing costs in one country can attract investment, driving up demand for its currency and its price.
- Liquidity: Highly liquid assets, like major currency pairs, might have more consistent prices. Less liquid assets can see greater price volatility due to fewer participants.
- Geopolitical Events: Elections, wars, and natural disasters can cause sudden price shifts by disrupting supply chains or altering economic outlooks.
Types of Spot Markets
Spot markets are where assets are traded for immediate settlement, offering real-time pricing and instant transactions.
- Forex: The largest spot market, where currencies like the euro or dollar are exchanged at the current rate, often used by traders to capitalise on short-term price movements.
- Commodities: Includes trading raw materials like gold, oil, or wheat. Buyers and sellers agree on the spot price for immediate delivery, reflecting current supply-demand dynamics.
- Equities: Shares of publicly traded companies are bought and sold at the prevailing market price on exchanges like the London Stock Exchange or NYSE.
- Cryptocurrencies*: Although not mentioned earlier, these involve buying and selling digital assets like Bitcoin at current prices and receiving an instant ownership transfer.
What Spot Rates Mean for Traders and Markets
Spot rates are effectively snapshots of reality, reflecting the current balance of supply and demand. For traders, they provide a critical context for decision-making and deeper insights.
Market Sentiment and Timing Opportunities
These rates offer a real-time lens into market sentiment. Sudden price movements often signal shifts in supply, demand, or broader economic conditions. For instance, a rapid rise in the spot price of oil might indicate geopolitical tensions affecting supply chains, which could have knock-on effects across energy-related sectors. Traders monitoring these shifts can identify potential opportunities to capitalise on short-term volatility or avoid unnecessary exposure.
In addition, spot rates reveal liquidity levels. Highly liquid markets, such as major forex pairs like EUR/USD, typically have tighter spreads and more consistent prices. By contrast, less liquid assets might exhibit greater price discrepancies, signalling caution or potential opportunities to analyse deeper.
Impact on Strategy and Broader Markets
Spot rates directly influence trading strategies, especially in markets tied to commodities or currencies. Futures pricing, for instance, is often built upon the spot quote. Traders use these quotes to gauge whether hedging or speculative strategies align with current dynamics. A mismatch between spot and futures prices can indicate a contango or backwardation scenario, providing insight into whether traders are expecting costs or supply changes in the near term.
Beyond individual strategies, they also ripple through broader markets. For businesses and investors, they act as barometers in cost evaluating and pricing. For example, airlines keep a close eye on the current price of jet fuel to decide when to secure future contracts, directly impacting operational costs and profitability. Similarly, multinational companies use spot pricing in forex to manage cross-border expenses or revenue.
The Bottom Line
Spot rates are at the heart of trading, offering real-time insights into market conditions and influencing strategies across financial markets. Understanding how they work can help traders navigate potential opportunities and risks.
Whether you trade forex, commodities, stocks or other markets, choosing the right broker is essential. Open an FXOpen account to access competitive trading conditions, 700+ markets, and user-friendly platforms and trade CFDs designed for all levels of traders.
FAQ
What Is a Spot Rate?
A spot rate represents the price at which an asset, such as a currency, commodity, or security, is currently available for immediate settlement. Traders and businesses often use these prices as benchmarks in transactions and to assess market conditions.
What Does Spot Price Mean?
The spot rate meaning refers to the exact market price for an asset at a specific moment in time. It’s the price buyers are willing to pay and sellers are willing to accept for immediate delivery. These prices are dynamic, changing with broader conditions.
When to Use Spot Rate?
Spot rates are commonly used when immediate delivery of an asset is required. Traders often rely on them in short-term positions, while businesses might use them for immediate currency exchanges or raw material purchases. They’re also used as reference points when evaluating forward contracts and derivatives.
How Are Spot Exchange Rates Determined?
Spot exchange rates are determined by the forces of supply and demand. Factors like interest rates, economic data, geopolitical events, and liquidity can influence them.
Is Spot Trading Risk Free?
No, all trading carries risks. Prices can be volatile, and unexpected market events may lead to losses. Understanding these risks and using proper risk management techniques can help potentially mitigate losses.
*Important: At FXOpen UK, Cryptocurrency trading via CFDs is only available to our Professional clients. They are not available for trading by Retail clients. To find out more information about how this may affect you, please get in touch with our team.
Trade on TradingView with FXOpen. Consider opening an account and access over 700 markets with tight spreads from 0.0 pips and low commissions from $1.50 per lot.
This article represents the opinion of the Companies operating under the FXOpen brand only. It is not to be construed as an offer, solicitation, or recommendation with respect to products and services provided by the Companies operating under the FXOpen brand, nor is it to be considered financial advice.

Analysis Gold buy NowDistance Analysis from Current Price (2,921.67 USD)
1. Resistance Level (2,955.44 USD)
Distance from Current Price: 33.77 USD
2. Intermediate Resistance (Green Line around 2,940 USD
Distance from Current Price: 18.33 USD
3. Support Level (Middle Red Zone around 2,910 USD)
Distance from Current Price: 11.67 USD
4. Major Support (Lower Red Line around 2,900 USD)
Distance from Current Price: 21.67 USD
---
Potential Price Movements:
Bullish Case:
If the price breaks above 2,940, it may rise toward the major resistance at 2,955.44 (+33.77 USD).
Bearish Case:
If the price drops below 2,910, it could decline toward 2,900 (-21.67 USD).

EUR USD Trade Setup 4 hour timeframe EUR USD has formed a break and retest pattern on the 4 hour timeframe turning support into resistance.
So we will be looking for selling opportunities from the lower timeframe'
XAUUSD buy now 1. Support Adjustment:
The current support area is around 2,900, but if you want more distance, you might consider a lower range, around 2,880–2,895 for a stronger support base.
2. Resistance Adjustment:
The resistance is currently around 2,940. You could extend it further upwards, possibly in the 2,950–2,960 range, to create more distance between support and resistance.

Xag/Usd Short Idea I was anticipating price to get to 31.847 yesterday but it didn't. Maybe my point of interest is going to get triggered today.
Anticipating a nice rejection in that zone then I'll short silver down to clear some liquidities resting below.
Kindly boost if you find this insightful 🫴

EUR/USD 1H Analysis: EMA 200 Retest & Fibonacci Pullback – Key LKey Observations:
Ascending Wedge Breakout & Price Surge
The price broke out of a wedge pattern (green shaded area) with strong bullish momentum.
A strong rally led to a new local high (~1.0489).
Fibonacci Retracement Levels
The price is pulling back from the high, and Fibonacci retracement levels are marked.
Key levels to watch:
0.618 (1.04385) – Strong support
0.5 (1.04238) – Moderate support
0.382 (1.04091) – First level of reaction
EMA 200 Retest (~1.04467)
The 200 EMA (blue line) is acting as dynamic support.
The expectation (noted on the chart) is that price may touch or react at the EMA 200.
If it holds, it could trigger another bullish push.
If it breaks below EMA 200, further downside toward Fib 0.618 or 0.786 retracement is possible.
Potential Bearish Rejection (Red Arrows)
The red arrows suggest a possible lower high formation, meaning the price could reject from EMA 200 and start a deeper drop.
Volume Analysis
Increasing volume suggests strong participation.
If volume remains high near EMA 200, we might see a breakout or a strong bounce.
Potential Trade Scenarios:
Bullish Case (Buy Trade)
If price holds above EMA 200 (~1.04467) and forms a bullish reaction, a long trade could target:
First target: 1.0489 (previous high).
Second target: 1.0500+ (psychological level).
Stop Loss: Below 1.0435 (below Fib 0.618).
Bearish Case (Sell Trade)
If price fails at EMA 200 and forms a lower high, it could drop toward:
First target: 1.0430 (Fib 0.5).
Second target: 1.0409 (Fib 0.382).
Third target: 1.0390 (Fib 0.236).
Stop Loss: Above 1.0460 (above EMA 200).
Conclusion:
EMA 200 is the key level to watch.
Bullish bias above EMA 200; Bearish bias below.
If EMA 200 holds, buying could be a good strategy.
If it fails, further downside is expected.
Would you like a precise trade setup based on this? 🚀

Will the EUR/USD recover? - Is the Stock Market on the verge...In this market preview, I go over the EUR/USD, GBP/USD & USD/JPY with the primary focus on the EUR/USD. Will it recover or give out and test lower lows...
Also, ETF's that I am watching and keeping an eye on a potential bearish tone for the stock market.
I also share a small update on Crypto trade MATIC.
As always, good luck and trade safe.

Gold Ready for Selloff toward 2800 Level!!(sell Setup)See how price action plays out during in the next 15 min we gonna probably see a nice fakeout from the new york volume before a further continuation to downside.
Always remember to use proper risk management.
Follow me for more Analysis!!
