GBPUSD: Bearish Momentum vs. Fundamental Repricing – Key LevelsGBPUSD is at a critical juncture, balancing a clear technical breakdown with a fundamental backdrop favoring near-term volatility. The pair has slipped from its rising wedge structure and is now testing key retracement zones while markets reprice expectations for Fed rate cuts after weak US jobs data. Traders are closely watching whether this bearish momentum will extend toward the 1.3128 support or if a rebound from oversold conditions could trigger a corrective bounce.
Technical Analysis (8H Chart)
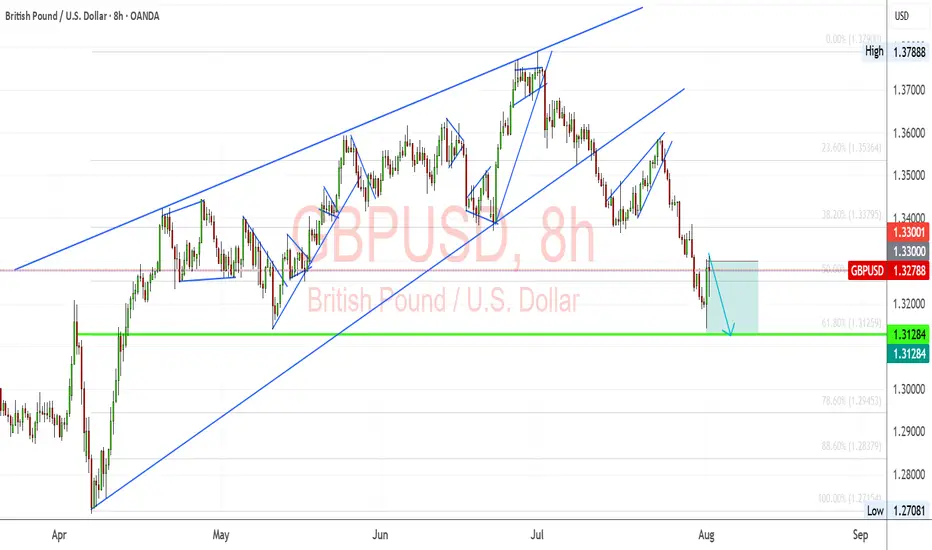
Pattern: Clear breakdown from a rising wedge, confirming bearish bias.
Current Level: Price sits near 1.3278, struggling to reclaim the 1.3300 resistance zone.
Key Support Zones:
1.3128 (61.8% Fibonacci retracement) – main bearish target.
1.2945 (78.6% retracement) – extended downside target if selling pressure deepens.
Resistance Levels:
1.3300 (immediate resistance, prior support now flipped).
1.3380 (secondary resistance if a retracement rally occurs).
Projection: Likely bearish continuation toward 1.3128, with a potential retest of 1.3300 before continuation.
Fundamental Analysis
Bias: Bearish in the short term, but Fed policy and risk sentiment remain key drivers.
Key Fundamentals:
USD: Weak NFP (73K), higher unemployment (4.2%), and downward revisions boost Fed cut bets (~75% for September), typically a USD-negative factor.
GBP: BOE maintains a cautious stance due to sticky inflation but lacks clear hawkish conviction as growth slows.
Tariffs: US tariffs add a mild negative weight on GBP trade sentiment.
Risks:
Hot US CPI could slow Fed cut bets, supporting USD.
Hawkish BOE comments could limit GBP downside.
Global risk sentiment shifts could either favor USD (risk-off) or weaken it further (risk-on).
Key Events:
US CPI and PPI for USD direction.
BOE policy updates and UK CPI.
US jobless claims and Fed commentary.
Leader/Lagger Dynamics
GBP/USD is a lagger, mainly reacting to USD shifts. However, its moves directly influence GBP crosses such as GBP/JPY and GBP/CHF.
Summary: Bias and Watchpoints
GBP/USD remains in a bearish phase, targeting 1.3128 with a potential corrective bounce toward 1.3300 first. The primary driver is the technical breakdown, while fundamentals add volatility around US CPI and BOE policy. If CPI surprises lower, the bearish outlook could reverse into a short-term rebound; if CPI is hot, downside momentum could extend. You should monitor USD-driven events closely as GBP/USD sets the tone for broader GBP movements.
Forexmentor
NZDCHF – Bullish Breakout Sets Stage for ReversalNZDCHF has broken decisively out of a long-term descending channel, signaling a potential trend reversal. Price action confirmed multiple bullish flags within the falling structure, followed by a clean breakout and higher low retest, supporting a bullish continuation bias.
Currently, the pair is stabilizing just above prior resistance turned support around 0.4760–0.4780, forming a potential launchpad for the next leg higher.
Upside Targets:
TP1: 0.48336
TP2: 0.48844
TP3: 0.49319
Invalidation Zone:
A drop below 0.4720 would invalidate the breakout structure and expose the downside.
Fundamental Drivers:
🇳🇿 NZD Strength: RBNZ remains relatively hawkish compared to other central banks, and the Kiwi may gain from improving risk sentiment and easing global recession fears.
🇨🇭 CHF Weakness: Swiss Franc is under mild pressure as safe-haven flows weaken amid improving tone on US-China-EU trade headlines and fading ECB rate cut bets.
🗓️ Macro Flow: Upcoming risk events (Fed comments, trade updates, and NZ economic prints) could inject momentum into the pair, especially if risk appetite improves.
Bias: ✅ Bullish (Buy)
Confidence: ★★★★☆
Watch for: Clean hold above 0.4770 zone + bullish momentum continuation.

Why EUR/USD Dropped: A Step-by-Step Breakdown for Learners📉 Overview:
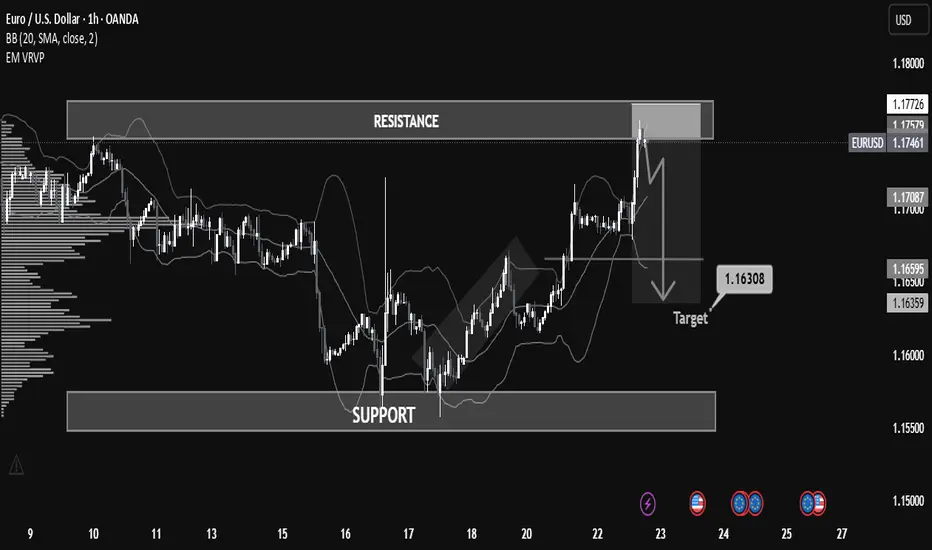
The EUR/USD has recently approached a key resistance zone near 1.17726, showing signs of a potential rejection after a bullish rally. The price is currently hovering around 1.17468, forming a short-term bearish setup that could lead to a retracement or reversal.
⸻
⚙ Key Technical Zones:
• 🔼 Resistance: 1.17500 – 1.17726
Price was strongly rejected after testing this area. This level has historically acted as a supply zone.
• 🔽 Support: 1.15500 – 1.16000
This is a historically significant demand zone, where price previously consolidated and reversed.
• 🎯 Target Zone: 1.16308
Marked as a potential take-profit level based on prior price structure and volume profile imbalance.
⸻
🧠 Indicators & Tools:
• Bollinger Bands: Price touched the upper band in overbought conditions, suggesting a possible mean reversion.
• Volume Profile (VRVP): Indicates declining volume near resistance, pointing to weak buyer momentum.
• Price Action: Bearish engulfing candle and strong rejection wick at resistance, confirming selling pressure.
⸻
🧭 Market Bias:
📌 Short-Term Bearish
A short opportunity is forming based on the rejection from resistance and overextension of price.
⸻
🧩 Possible Scenario:
1. Breakdown below 1.17061 (mid-level support) could trigger acceleration to the downside.
2. 1.16500 and 1.16308 are ideal short targets before reevaluation for continuation or bounce.
⸻
🛑 Risk Management Tips:
• Consider SL above 1.17800 (previous high).
• Monitor for confirmation before entry (e.g., bearish candle close below 1.17000).
• Adjust size and risk-reward ratio appropriately.
Is Gold Ready for a Breakout or Pullback? | Weekly ForecastIn this video, we dive deep into the gold market analysis for the week of July 7 to July 11, 2025. I break down everything you need to know from last week’s price action — including the surge to $3,360, the impact of the U.S. tax cut and spending bill, and the 2.2% weekly gain despite consolidation.
We also look ahead at what to expect this week, including:
📅 July 9 Trade Tariff Deadline
📉 Key U.S. labor data (Initial Jobless Claims)
🏦 Market sentiment around Fed rate cut speculation
📊 Strategic insights based on technical and macro confluence
👉 If you find this content valuable, don’t forget to Vote, Comment, and Subscribe for weekly market breakdowns.
💬 Drop your thoughts in the comments:
Do you think gold will break above $3,360 this week? Or are we gearing up for a deeper pullback?
Disclaimer:
Based on experience and what I see on the charts, this is my take. It’s not financial advice—always do your research and consult a licensed advisor before trading.

GOLD Price Analysis: Key Insights for Next Week Trading DecisionIn this video, I break down last week’s gold price action and give you a detailed outlook for the week ahead. With gold closing around $3,260 and major macroeconomic shifts unfolding—including the Israel-Iran ceasefire talks, rising US dollar strength, and concerns over the US Q1 GDP contraction, we are at a turning point.
📉 Will weakening economic data force the Fed to pivot?
📈 Could this create a fresh bullish wave for gold?
Or will stronger job numbers and inflation data drag gold lower?
✅ What you’ll learn in this video:
✅Key fundamental drivers affecting gold (XAU/USD)
✅Important economic events to watch (Fed Chair speech, NFP, ISM)
✅My technical analysis of gold price levels to watch
✅How to read the current market sentiment like a pro
✅Strategic trading zones for bulls and bears
🔔 Don’t forget to like the video in support of this work.
Disclaimer:
Based on experience and what I see on the charts, this is my take. It’s not financial advice—always do your research and consult a licensed advisor before trading.
#xauusd, #goldprice, #goldanalysis, #goldforecast, #goldtrading, #xauusdanalysis, #technicalanalysis, #fundamentalanalysis, #forextrading, #forexmentor, #nfpweek, #goldoutlook, #tradingstrategy, #chartanalysis, #julyforecast, #fedwatch, #priceaction, #traderinsights, #commoditytrading, #marketbreakdown, #xauusdforecast, #tradethefundamentals, #smartmoneytrading

GOLD Price Forecast: Is the Pullback Over? | Weekly OutlookWill XAUUSD resume its bullish trend, or is more downside ahead?
In this video, I break down last week’s gold price movement and the current market reaction to rising geopolitical tensions between Iran and Israel, now with the U.S. joining the conflict. We also assess the impact of the Fed’s recent rate hold, weak retail sales, and upcoming high-impact U.S. economic events like PMI, GDP, and Core PCE.
💡 Here’s what you’ll learn:
✅What caused gold’s pullback last week
✅Why institutional traders shake out retail buyers
✅Key fundamentals driving gold right now
✅How to position yourself smartly for the upcoming trading week
🔔 Don’t forget to like the video in support of this work.
Disclaimer:
Based on experience and what I see on the charts, this is my take. It’s not financial advice—always do your research and consult a licensed advisor before trading.
#goldanalysis, #xauusd, #goldforecast, #goldpriceprediction, #forexanalysis, #fundamentalanalysis, #forextrading, #tradinggold, #goldnews, #federalreserve, #marketpsychology, #tradingstrategy, #geopoliticalrisk, #usdata, #iranisraeltensions, #goldbullish, #goldbearish, #forexmentor, #xauusdforecast, #tradingview

NZDJPY “Kiwi Poised to Fly as Japan Muddles ThroughNZDJPY shows a bullish breakout from a descending trendline, with bullish structure holding near 87.20–87.25.
Key resistance targets:
87.97 (Previous high)
88.64 (Next resistance / projected fib target)
Two upside scenarios are shown:
Conservative target: ~87.97
Aggressive swing: ~88.64
If 87.00–87.20 zone holds as support, expect bullish continuation.
🧩 Current Bias: Bullish
📌 Key Fundamentals Driving NZDJPY
NZD Side (Strengthening):
RBNZ hawkish hold: RBNZ recently kept rates at 5.50% and warned that inflation remains persistent, requiring prolonged tight policy.
Resilient NZ GDP: Stronger-than-expected GDP print signals economic resilience.
Terms of trade improvement: Commodity exports holding firm, China consumption rebound showing hints of demand recovery (see recent 618 festival sales data).
AUD correlation: AUD and NZD are moving together; if AUD strengthens, NZD often follows.
JPY Side (Weakening):
BoJ remains ultra-dovish: Despite inflation trends, BoJ is hesitant to tighten further, preferring gradual tapering.
Yen under pressure from yield differentials: Global central banks (like RBNZ, Fed) remain hawkish while BoJ is not.
Geopolitical funding flows: JPY used as a funding currency amid global volatility (carry trade boost for NZDJPY).
⚠️ Risks That May Reverse the Trend
BoJ surprise tightening rhetoric (e.g. bond purchase taper announcement).
China data deterioration, hurting Kiwi sentiment.
Sharp equity sell-off and geopolitical escalation (Yen safe-haven reversal).
📅 Important News to Watch
🇳🇿 NZ Trade Balance (upcoming)
🇯🇵 Tokyo Core CPI (Jun 28) – Critical for BoJ policy speculation.
RBNZ or BoJ member speeches (hawkish or dovish shifts)
Fed tone shift or US dollar strength spillover
🏁 Who Leads the Move?
NZDJPY could lead among yen crosses due to the RBNZ’s clear inflation fight versus BoJ’s passive stance. NZDJPY is also more responsive to commodity and global risk-on flows than EURJPY or USDJPY.

Gold Technical & Fundamental Outlook for Next WeekIn this video, I break down the recent surge in gold prices, what drove the momentum, including rising tensions between Israel and Iran, and the impact of weaker U.S. inflation data that’s pushing Fed rate cut expectations.
Gold is now sitting just below the all-time high of around $3,500. With major U.S. economic events like Retail Sales and the Federal Reserve Interest Rate Decision coming up, this is a key moment for us to prepare.
💥 Will we see a breakout above resistance, or is a healthy dip on the cards before the next move? I’ll walk you through the key levels, the market psychology, and how I’m planning my trades this week.
💡 Make sure to like, comment, and subscribe for more weekly gold and forex market insights.
Disclaimer:
Based on experience and what I see on the charts, this is my take. It’s not financial advice—always do your research and consult a licensed advisor before trading.
#GoldAnalysis #XAUUSD #GoldPrice #ForexTrading #MarketOutlook #GoldForecast
#TechnicalAnalysis #FundamentalAnalysis #FOMC #FedRateDecision
#RetailSales #SafeHaven #GoldBreakout #TradingStrategy #ForexMentor

GBPCHF Breaks Rising Wedge – Reversal Targets 1.0940 and 1.0815GBPCHF has broken down from a rising wedge formation on the 4H chart, signaling a shift from bullish momentum to bearish control. The pattern break comes near the 50% retracement level, with price now trading below ascending trendline support. With fundamental headwinds weighing on the British pound and safe-haven demand supporting the Swiss franc, the setup favors a short bias targeting the 1.0940 and 1.0815 zones.
🔍 Technical Analysis
Pattern: Rising wedge → broken to the downside
Breakout Confirmation: Price has closed below the wedge support (trendline)
Key Support Levels:
1.0940 → 38.2% fib + previous structure support
1.0815 → 23.6% fib retracement + horizontal support zone
1.0608 → Full wedge base (longer-term target)
Resistance / Invalidation:
1.1150 – a close back above this level invalidates the breakdown
Candle Behavior:
Bearish structure forming with lower highs
Clean engulfing candle closed below wedge
📉 Bias: Bearish (confirmed technical reversal)
🌍 Fundamental Context
🇬🇧 British Pound (GBP)
UK CPI expected to rise (3.3% forecast), which may limit BoE cuts, but not bullish enough to support GBP
Political uncertainty resurfaces (Labour slipping in polls)
BoE speakers are split; no clear support from policy
🇨🇭 Swiss Franc (CHF)
Safe-haven flows rising on:
Global growth slowdown
Tensions between U.S.–Iran
Downgrade of U.S. debt → risk aversion favors CHF
SNB remains cautious, but CHF gains defensive strength in risk-off conditions
🎯 Trade Setup
Bias: Sell
Entry Zone: 1.1080–1.1100 (breakout confirmation)
Targets:
TP1: 1.0940
TP2: 1.0815
TP3: 1.0608 (extension target)
Stop Loss: Above 1.1150
⚠️ Risk Factors
CPI surprise tomorrow could cause GBP spikes — be cautious around the release
If equities rally hard or CHF weakens globally, price could retest the wedge structure before falling
BoE hawkish surprise could challenge short-term bearish bias
🧭 Conclusion
GBP/CHF has broken out of a rising wedge — a classic bearish reversal signal. The technical break aligns with macro weakness in GBP and CHF strength in a risk-off environment. Short trades remain valid below 1.1150, targeting a drop to 1.0940 and 1.0815 in the coming sessions.

GBPUSD Approaches Key Resistance: Watch for Bearish ReversalGBPUSD pair is trading within a clearly defined ascending channel on the 1-hour chart, showing a short-term bullish structure. However, this bullish move appears corrective within a broader consolidation range capped near the 1.3590 resistance zone.
🔍 Technical Breakdown:
Current Price: 1.35535
Immediate Resistance: 1.35885–1.35929 (previous highs and psychological level)
Support Levels:
Trendline support near 1.3530
Horizontal support: 1.34282, 1.34176
Structure:
Price has formed a bullish flag breakout and is now approaching key resistance.
A new higher high is anticipated toward 1.3590, but this level has repeatedly rejected price in the past.
The projected path indicates a potential liquidity grab above 1.3590 followed by a sell-off toward 1.3420–1.3410 area, aligning with a trendline break scenario.
Bearish Scenario:
A strong rejection from the 1.3590 zone, especially if accompanied by bearish divergence or a strong candle close, could trigger a shift back down to the 1.3417–1.3428 support zone.
This would confirm a short-term top and potential retracement toward lower liquidity zones.
📊 Fundamental Backdrop:
USD-side:
Recent U.S. labor market strength (e.g. ADP report and low jobless claims) supports a hawkish bias, favoring USD upside.
However, Fed policymakers remain cautious due to trade tensions and tariff uncertainty. This has injected short-term volatility into USD pairs.
GBP-side:
UK economic data has been mixed, with GDP growth forecasts under scrutiny.
BoE policymakers are dovish, emphasizing weak productivity and wage pressures, making the pound vulnerable to downside catalysts.
📌 Conclusion:
Watch for a potential bull trap near 1.3590, followed by a bearish reversal toward 1.3420–1.3410 if momentum weakens and sellers step in. This would complete the expected technical leg down and align with broader risk sentiment if dollar strength returns.

XAUUSD: Break or Bounce at ResistanceGold has reached a critical technical zone near a long-term descending trendline and horizontal resistance around $3360–3380. Price action suggests a make-or-break moment is unfolding.
Key Technical Structure:
Descending Trendline Resistance from the April high capped the rally.
Current move has formed a rising wedge — typically bearish if broken.
Price is testing resistance confluence — a rejection could send Gold lower.
Scenarios to Watch:
🔹 Bullish Breakout:
Clean breakout and close above $3380 confirms trendline invalidation.
Upside projection points to $3500 — previous high and psychological level.
🔹 Bearish Rejection:
Failure to break the trendline + wedge breakdown can drag price to:
$3280 (38.2% Fib)
$3160–3200 zone (61.8% Fib + demand area)
Macro Factors to Watch:
Tariff escalation between US–EU could trigger risk-off → bullish for Gold.
FOMC policy pause, weak job data, or inflation rebound also support upside.
Stronger USD or yield spike may trigger wedge breakdown → bearish.
Conclusion:
XAUUSD is at a key inflection point. Wait for confirmation: either a clean breakout or a clear reversal rejection. Trade the resolution, not the anticipation.

DXY Short-Term Reversal Zone in SightUS Dollar Index (DXY) is approaching a strong support zone at 98.90–98.00, which has historically acted as a base for bullish reversals. The price is now testing the lower bound of this zone after a steady downtrend from the 101.94 high.
Key Technical Structure:
Support Zone: 98.90–98.00 (tested 3+ times)
Double Bottom Potential forming if bulls hold the zone
Upside Targets:
101.94: Key horizontal resistance
103.50: Swing high from early April
Scenarios to Watch:
🔹 Bullish Rebound:
Price bounces off 98.90–98.00 support
Confirmation: Break and close above 100.50 near-term resistance
Could fuel move back to 101.94, possibly 103.50
🔹 Bearish Breakdown:
Daily close below 98.00 would invalidate bullish setup
Opens downside to 97.00 and even 95.50
Macro Drivers to Watch:
FOMC speakers and interest rate guidance
US jobless claims or inflation surprise
Risk-off sentiment (benefits USD) vs. continued global risk appetite
Conclusion:
DXY is trading at a make-or-break support zone. Watch for clear bullish reaction or bearish breakdown before committing. The setup favors a bounce unless 98.00 fails.

USDJPY Forecast for NFP Week | Price at a Critical Turning PointIn this video, I’m diving into the USDJPY setup ahead of a high-impact week filled with major economic news like the NFP, ADP Employment, and speeches from the BoJ Governor.
We’ll walk through the technical zones I’m watching, discuss potential buyer and seller reactions, and outline the key catalysts that could move the market.
🔔 Don’t forget to like the video in support of my work.
Disclaimer:
Based on experience and what I see on the charts, this is my take. It’s not financial advice—always do your research and consult a licensed advisor before trading.
#USDJPY #ForexForecast #NFPWeek #ForexMentor #TechnicalAnalysis #ForexTrading #BoJ #TradeSetups #PriceAction #MarketBreakdown

Market next move
1. Bearish Rejection from Resistance
Disruption: The price has struggled to break above the 3,240–3,250 area multiple times. This could indicate strong resistance.
Implication: If the price fails again, we may see a rejection and a move down towards the 3,180–3,160 support range instead of a bullish breakout.
---
2. Volume Analysis Caution
Disruption: The volume during recent upward moves is not significantly higher than the downswings.
Implication: Weak buying volume might not support a strong breakout, suggesting a fakeout could occur.
---
3. False Breakout Possibility
Disruption: A possible fake breakout above the red box might lure in buyers before a reversal.
Implication: Watch for a "bull trap" where the price briefly breaks up and then reverses sharply downward.
---
4. Macro Events Ahead
Disruption: The timing (around May 20) could align with macroeconomic news (e.g., Fed minutes, CPI, etc.).
Implication: News can trigger volatility and negate technical expectations.
---
5. RSI or Momentum Indicators?
Disruption: Without checking RSI or other momentum indicators, the analysis might lack confirmation.
Implication: Overbought/oversold conditions could shift the bias unexpectedly.

XAUUSDgold is seems want it to drop,,, as we see its in a range so take it easy guys. well i see in gold a huge trap from dollar side means mr. trump. so as gold is on the edge of the trend could happen anything unrespectfully. let me know in the comment what you all thing?

BTCUSDwhat a lovely week with super short on btcusd, well if you all look at the chart on daily frame as i draw the line clearly to understand what happend and what would happen next possibely. take a good risk management and wait for the conformation. there is as i mentioned on the chart a-plan and b-plan, what you all think let me know in the comment. if you like the analysis give it a like. happy sunday.

BTCUSDlasr analysis was 100% worked i hope you all had a good time, as we look at weekly chart and see potentionl continue sell on btcusd, till ob+fvg, let see a strong pull back to take short postion. i hope weekly chart as i draw my like easy to understand. let me know in the comment what you think ..?

USDJPYi see long setup if the daily candle close above the resistence, on a good pullback its a good and strong long setup with nice conformation. as i draw few line on the chart with ket level, it is way more easy to understand. what you all think, let me know in the comment.

OfficialKieranTrewick | XAUUSD | Long from 25% ? The latest chart update shows that price has fully cycled from the 100% to the 25% quarter level within the bullish ascending channel. After failing to break the 2920 resistance due to a decrease in order flow, price continued its descent towards the lower boundary of the channel.
Upon reaching this key support zone, order flow for buying pressure significantly increased, leading to a suitable long entry that has already hit two take profit targets, securing 60 pips. The expectation is for price to slowly ascend back into the channel, aligning with previous value areas and increasing order flow.
However, with high-impact news on the horizon, market sentiment could shift, posing a potential risk to the current bullish market structure. Traders should remain cautious and prioritize risk management in case of unexpected volatility.
FX:XAUUSD
Follow OfficialKieranTrewick for More Ideas and Analysis Breakdowns
Join My Free Groups for Extra Content

GBPUSD GBPUSD Trade at mid of 2 zones when market give displacement towards downside we will see fvg and enter on that if market go upside and close any H4 candle above these zone then we see pump towards upside market will go upside,
Remember!Trade What You See Not What You Think.

XAUUSDfinally over a year gold has rised 8600 pip which is incradibly insane, i see gold potentially trapping buyer at this high price my prediction is very simple it might may not be the same for sure.. as we still see how this month is going to close after all monthly 11 bullish candle and only 2 bearish candle has been performed, trade what you see, not what we think. happy weekend. what you think let me know in the comment.

EURUSDdaily framechart, i see a hns patern in the bottom with double bottom also can say as can see clearly on chart.
my prediction is simply if resistence break solid and create high, we can manage to take a long entry on pull back. let me know what you all think in the comment.

CHF/JPY Analysis | Potential Reversal or Continuation ? CHF/JPY Technical Analysis & Forecast
📉 Market Overview: Swiss Franc / Japanese Yen (CHF/JPY) – 4H Chart : The pair is currently trading within a well-defined descending channel, signaling a sustained bearish trend. The price action has consistently followed a lower high and lower low structure, confirming the prevailing downtrend.
However, recent price movements suggest potential signs of reversal as the pair approaches a key support zone. Let’s dive into the details.
🔍 Key Technical Highlights:
✅ Descending Channel: The market has been respecting a downward sloping trendline, indicating ongoing bearish pressure.
✅ Major Support Zone: The pair has tested a crucial quarter fulfillment level, a historically strong support area.
✅ Double Bottom Formation: A potential reversal pattern is forming, hinting at a possible upward move.
✅ 50 EMA Acting as Dynamic Resistance: The price remains below the 50-period Exponential Moving Average, a key level to watch for bullish confirmation.
✅ Resistance Levels: The 169.000 (50% Fib) and 172.000 (75% Fib) levels are the next upside targets if buyers gain control.
📊 Prediction & Outlook:
🔹 Bullish Scenario: A successful break above dynamic support/resistance and the 50 EMA could trigger a bullish move toward 169.000 and potentially 172.000.
🔹 Bearish Scenario: Failure to hold the current support could see the pair continue its downward trajectory within the channel, with potential targets around 163.250.
🔹 Key Confirmation Point: A breakout above the support & resistance zone (~168.000) would strengthen bullish momentum, while a rejection could lead to further downside.
📢 Trader’s Takeaway:
🔹 Short-term traders should watch for confirmation of the double bottom breakout.
🔹 Swing traders may look for opportunities within the current channel structure, capitalizing on both reversals and trend continuations.
🔹 Risk management is crucial; a break below 166.000 may invalidate bullish setups.
Stay tuned for more updates and trade wisely!
🚀 Follow me for real-time insights and forecasts.
OANDA:CHFJPY FX:CHFJPY VANTAGE:CHFJPY
