AUDJPY DAILY 10/20/19
AUDJPY Short Idea
Price action has been primarily bearish on higher time-frames and we will continue to look for potential short entries
Current price action is at key daily resistance around 74.500 as well as the daily 61.8% fib level
Ideally we would like to see a strong bearish signal at this level before targeting lower. A bearish engulfing or evening start would be prime confirmation and would solidify a daily double top pattern
Look to target toward the weekly support around 70.00 as well as the -27.2% & -61.8% fibb level
Forexmentor

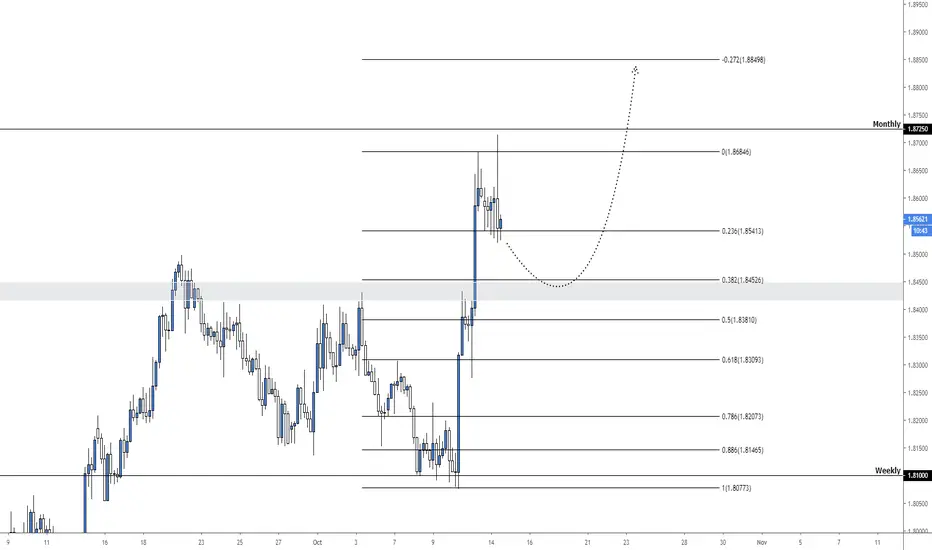
GBPAUD 4hour 10/14/19GBPAUD Long Idea
Price action has been bullish since mid July so we will stick with the trend until we see Higher Lows being broken on the larger time-frame trends
Current price action has swiftly broken through key resistance last week due to positive gbp news so we will look to enter on a retest of that resistance now turned support which will also line up with the 38.2% 4hour fib level
Our target will be the monthly resistance around 1.87250 followed by our target at the -27% fib level around 1.885
AUDUSD 4hour 10/14/19AUDUSD Short Idea
Price action for AU has been majorly bearish on larger time-frames so we will look to short in favor of the trend
Current price action has rejected the 50% fib level & key resistance around 0.688 the current pattern looks a lot like a head & shoulders pattern as well
Upon enough confirmation we will look to short and target the monthly support and -27% 4hour fib around 0.66- 0.657

NZDCAD DAILY 10/13/19NZDCAD Short Idea
Price action on the daily and weekly time-frames have been majorly bullish but have yet to form structure after this extended push to the downside
According to our rules we would like to see price action come up to the 38.2% fib level at least before continuing. Ideally a push to our weekly resistance and 38.2% around 0.85000 would be indication to short after a confirmed rejection from this level.
We will look to target the -27% daily fib and weekly support around 0.8650 & 0.80250

USDCHF Daily 10/13/19USDCHF Trade Idea
Price action on the weekly timeframe has been stuck within a wide range between 0.94000 and 1.03500
Current price action on the daily timeframe has been steadily bullish and has just broken above a daily resistance level around 0.99000
If we take a look at where price action is we can see it is consolidating in an ascending triangle, this could be an indication that a bullish push is iminent
Ideally we would like to see a break of resistance at 0.9987 with a retest, from there we can target our monthly resistance level around 1.0425 which would make for over a 400 pip trade
If price action falls from this region we will look for a retest of the daily support which will then be daily resistance and target toward our weekly support around 0.97085

NZDUSD Daily 9/30/19NzdUsd Short Idea
Price action has been primarily bearish on the Daily & Weekly time-frames so we will look to short upon a confirmed rejection of a prz level.
Current price action is yet to form true structure on a daily time-frame after this drop since mid July. We will look for price to reach our 32.8% fib level or the 61.8% (The red zones)
After a confirmed rejection we will target the -27% daily fib level around 0.61075. Our second target will be the weekly -27% fib level around 0.54650 (The green zones)
If price continues to drop from the current region we will wait until a bottom is found and a prz level has been hit.

Gbpjpy h4 Technical Analysis by The Forex Scalperas indicated last Sunday it was time for a good retracement for gbpjpy 138,000 is still respected which is a very important key level, which is an indication that this is the possible new '' lower high '' to form a new lower low, may be to continue our bearish path. also in this case it is important to see how the asia / london session is going to form and if we can expect a nice h4 bear engulfing keep in mind if we break 138,000 that we have just entered an entry take the new higher low on the first pullback! to avoid a fake out (liquidity grab)

Trendling tradingbearish momentum on this pair. we can see previous support become resistance plus formation of double top pattern

Eurusd h4 trading idea by TheForexScalperTrading idea for EURUSD h4 first pullback should confirm shorts.
Trading idea with educational purpose, use price action confirmation.

Trading idea Gbpjpy h4 by theforexscalperTrading idea on gbpjpy h4 by theforexscalper, wait for confirmation.

Possible AUD/CAD Short Position!! By Ben WrightSMP Trading
SELF DEVELOPMENT/METHODOLOGY/PSYCHOLOGY
Chart time frame - H4
Timeframe - 1 Day
Actions on -
A – Activating Event
Currency Pair creating a Double Top
B – Beliefs
Market will meet resistance @0.946 level and fall to the @0.94 level. In order to enter, the pair needs to be rejected by the Bollinger Band line
FX:AUDCAD
Trade Management
Entered @ Sign up for mentoring
Stop Loss @ Sign up for mentoring
Target 1 @ 0.94
Target 2 @ 0.
Risk/Reward @ 2.1
Happy trading :)
Follow your Trading plan, remain disciplined and keep learning !!
Join our Tier 1 Mentoring Program TODAY!! twitter.com
Please Follow, Like,Comment & Follow
This information is not a recommendation to buy or sell. It is to be used for educational purposes only!


How to find extremely strong and accurate levels (Must Read!!).I know how to properly identify support and resistance levels that are backed by recent supply or demand. By this I mean, supply is what traders consider to be selling power that makes a currency value go down. Demand is the total opposite as it shows its self as support and encourages a currency's value to go up. With that said, support and resistance or supply and demand are perhaps the single most important concepts in any form of trading. You can easily find these levels if you accurately use past price data (candlesticks) as a reference point to current levels that may or may not break to find the best place to place entries and stop loss. Trading support and resistance levels are so abundant that you can go all the way back to 2010 and pick ANYWHERE to plot lines only to find out that they formed a perfect support or resistance level in the current times of 2018! This is the number reason why it's important to use the most current S&R levels as a reference point to where price is most likely to break through or bounce off. This is from my tradingview. (www.tradingview.com)

GBPJPY BULLISH IDEAIf 147 continues to hold It wouldn't surprise me to see the bulls make a run at some higher levels. If they're really serious I could see 160 being hit over the next months/year or so.

looking to short #USDCAD if some criterias are being metUSDCAD which has been on a downtrend had broken our weekly support key zone now turned resistance, retraces coming back to retest, gives us a double top inline with our ema, rejection at 781 fib level, we will wait for it to break our ctl before looking to go short, but there are a lot of confluences inline already to make us consider going short. Knowing how to plot these key levels, knowing how to use your fib properly is key too.

I will be going short on GBPAUD GBPAUD has broken and retested our resistant turned support zone on the daily chart, closed previous day candle was a shooting star pattern rejecting on our ema. And also considering that audusd and gbpaud negatively correlates, audusd is in an uptrend, so we expect gbpaud to drop likewise, with other technical analysis i will not clearly state here clearly for my premium members, i will be going short on gbpaud.

gbpjpy sells cypher pattern spotted on gbpjpy , in line with other technical analysis . first and second target dispalyed

WHY I AM GOING SHORT ON GBPCHFI have been watching gbpchf for a while now, going in depth to the technical analysis , you will notice that a very strong trend line on the daily candle has been broken, after giving us a reversal head/ shoulder pattern inline with my monthly support region. This rejection and reversal pattern here tells me there is bound to be a reversal, looking at the daily candle, you will see a bearish marubozu candle after it breaks below the daily trendline, we will now step to the lower timeframe in search of our entry point using the ema, candles stick formation for confirmation. Join my private group to know how to make this entries using the ema i use and also how to properly analyse any market and make good profit out of it, also join my free telegram channel via the link below t.me

GBPUSD ABC patternThe GBPUSD looks to be completing an ABC pattern . At around 1.283 we have the AB=CD level where we are expecting to see some signs of supply entering the market. If prices break and close strongly above 1.283 we will be looking towards 1.300 zone which represents the 1.27 AB=CD.
Expecting the market to wave upwards so as long as prices remain above 1.2400 , we will be looking for buy signals on pull backs until we arrive at the 1.277-1.283 zone.
