GBPUSD CHART ANALYSIS POSTED ON SUNDAY 02 APRIL 2023GBPUSD CHART ANALYSIS !!!
Let's see how this pair will perform based on the analysis.
Make sure you do your research and based on your confluence please look for the entry.
Trade safe use proper risk management always.
Forexpower

euraud shortIf we see the entry signal in this zone with the set loss limit, we will enter the matter of the degree of ascent, but keep in mind that this signal is used in the upper periods, so you must be patient enough, but if the goals are achieved, there will be a good profit.

AUDUSD 150pips - EASY ONE! Must READAUDUSD is currently correcting within a BULLISH TREND so we are looking at a continuation around the LB . (Reason -Structure, H4 & D1 Bullish , SUITE B, Ema Cloud)
// #1 ENTRY (Risk Entry, Good Reward) // -: Wait for DXY for reach UB then we will be ready to attack this USD pair around the PREV LOW/ LB.
Also, IF AU will do this, we need to add EURAUD to the list, AU goes UP, EA goes DOWN, happens 80% of the time. (A stone for TWO Birds... )
// #2 Entry (Confirmed Entry, Minimal Reward) // -: Wait for the SH (Stop Hunt) of the PL (Prev Low) and buy on the close back above BL (Baseline)
// INVALIDATION //
On #1, Entry 40-50pips SL from where price touches the H4 LB (Our exits are only only on candle close)
On #2 Entry, when price rejects below the BL , the SUITE INDICATORS will print a SL zone on the chart for you, use it.
TARGETS - For me, I am looking at H4 800EMA and Max target as you can see on D1 will be gunning for that D1 200EMA
P.S I will post money making trades like this everyday and everything you see on my chart is
from the HOOD SUITE INDICATORS, everything you need is right in front on you inside the indicator.
(The key zones, Levels for manipulation, visible SL for invalidation, Alert when trade setup is ready).
No trend lines or complicated analysis, all you have to do is FOLLOW!

GBPUSD 230pips - High Probability Setup// THE DIRECTION //
GBPUSD direction is currently looking strong to the UPSIDE (Reason - PA, EMA Cloud, SUITE B, BL )
// #1 ENTRY // -: Enter on the test of the BL (Baseline)
// #2 Entry // -: Enter around the YELLOW automated key zone (Little takeout off the BL)
// INVALIDATION //
Exit on #1 Entry will be a 40pips below BL for a 4R:R
Exit on #2 Entry will be 40pips below the AUTOMATED KEY ZONE for a 5R:R
P.S I will post money making trades like this everyday and everything you see on my chart is
from the HOOD SUITE INDICATORS, everything you need is right in front on you inside the indicator.
(The key zones, Levels for manipulation, visible SL for invalidation, Alert when trade setup is ready).
No trend lines or complicated analysis, all you have to do is FOLLOW!

The fastest area of wealth accumulation in the world-the forexAn investment field where one opportunity is enough to change one's destiny!
A market that works miracles every day!
Entering the new century, foreign exchange, an investment tool with infinite charm, is attracting the attention of more and more people. This market full of opportunities and challenges is changing our destiny all the time, so much so that it is loved by more and more people.
Advantages of the foreign exchange market:
1.Low threshold for investment amount;
2.The investment period can be long or short, buy and sell as you go, and the liquidity is extremely high.
3.The highest return on investment, you can get more than several times the amount of investment funds.
4.The transaction procedures are quick and easy. You only need to enter the transaction procedures, which can be completed in a very short time.
5.Trading flexibility is high, and there are many profit opportunities in the dual-track of buying long and selling short.
6.The impact environment is relatively fair, the information channels are smooth, and it will not be operated by large companies. The principles of fairness, impartiality, and openness are guaranteed. There are many factors that affect it, and the relationship between supply and demand has a great impact.
7.The degree of risk is relatively high, but foreign exchange trading operations are flexible, mobile, rapid, and risks can be controlled and prevented.
How to quickly accumulate wealth with small funds:
1. Survival first, development second.
2. Only do short-term intraday trading.
3. Operate no more than 5 times a day, and try not to place orders after the daily profit exceeds US 1,000.
4. Only 2-3 varieties are made every day.
In the trading process, at the same time, establish that opportunities are available every day, and you need to maintain the concept of waiting patiently for opportunities, and overcome the impatience of eager to win; at the same time, make rational use of stop losses, establish the concept of safety in the bag, and turn floating profits into real profits in a timely manner.After trading, find the time period when you make the most profit every day, try to give full play to your advantages in this time period, and summarize your experience every day to continuously improve your tactics.


EURGBP SCENARIOThe price movement is uptrend, we expect bullish rallies from previous touch on the trendline to target the next resistance zone, scenario will be invalid if the price break and close below the trendline.

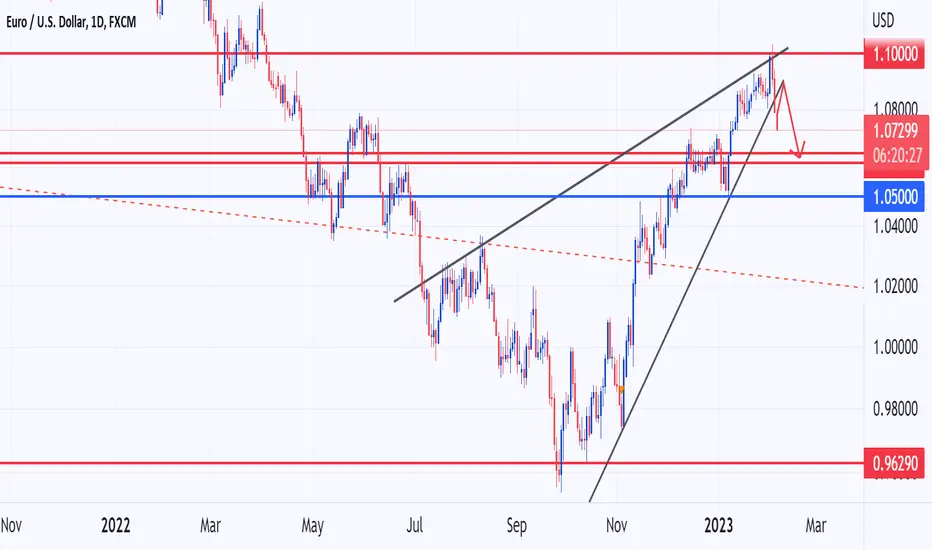
EURUSD, Weekly analysis, Feb 6 -10, 2023EURUSD bulls tried to go past the 1.10 price mark last week, but it faced strong resistance in the new high at 1.10 ,
then it closed the week at the price of 1.079 due to the strength gained by the US Dollar because of the FOMC and NFP new reports last week,
and if you look at the picture, It was clearly a breakout trade of a rising wedge pattern in a weekly timeframe,
This week, During the Initial phase, may the price go down towards the Year opening price of 1.068 and because of the News and data release, EURO USD has a chance to go high towards the supply zone of 1.085 price mark
Strengthen Dollar move tries to accumulate strength because of News reports awaiting this week like the Fed chairman speech, FOMC member speech, and the University of Michigan's Consumer sentiment report
Sell EURGBP SW 060223 13.15📌📌Idea Share Sell EURGBP📌📌
Link :
📍📍Open order 0.89450
Sell lim 1 0.89700
Sell lim 2 0.89900
Sell lim 3 0.90100
Sell lim 4 0.90300
Sell lim 5 0.90500
Tp 0.88500
Sl 0.90750
Warning !!! (Swing trade must be use pending orders)
!!!Pending orders should be set up lot size step by step
Example
(15,000$)
Open order 0.1 lot
Sell lim 1 0.15 lot
Sell lim 2 0.20 lot
Sell lim 3 0.25 lot
Sell lim 4 0.30 lot
Sell lim 5 0. 40 lot
Sell lim 6 (last order) = 0.1+0.15+0.2+0.25+0.3 = 1.1 lot
Example
(3,000$)
Open order 0.04 lot
Sell lim 1 0.05 lot
Sell lim 2 0.06 lot
Sell lim 3 0.07 lot
Sell lim 4 0.08 lot
Sell lim 5 0.10 lot
Sell lim 6 (last order) = 0.04+0.05+0.06+0.07+0.08 +0.1 = 0.4 lot
!!When any pending orders are open and the profits are covered by loss it is up to your decision.!!

Support and Resistance TradingBreakout of structure in longer time frame and entering the trade on smaller one. Mark SL just above nearest swing high and take profit at near support level.

AUDJPY H1SELL ENTRY @128.036
STOP LOSS@128.951
TAKE PROFIT@126.639
Market Update (Looking to Long)
Like and Subscribe
Thank you
Please support our analysis with a like or comment!

GBPUSD H4 ANALYSISAfter the trendline breakout, we have to take a buy trade.
GBPUSD ENTRY BUY@ 1.31380
STOPLOSS@1.1.28000
TAKEPROFIT@1.34000

Forex Update 03.12.2021Hello everyone, as we all know the market action discounts everything.
_________________________________Make sure to Like and Follow if you like the idea_________________________________
The dollar rose slightly on Friday, ahead of the release of the latest monthly U.S. jobs report, which might solidify a faster pace of tapering and, potentially, early interest rate hikes despite the omicron-induced uncertainties.
The Dollar Index, which measures the value of the US dollar against a basket of six other currencies, climbed 0.2 % to 96.305, slightly higher for the week. That would be the sixth weekly gain in a row.
The EUR/USD declined 0.1 % to 1.1284.
Daily Support & Resistance points :
support Resistance
1) 1.1279 1) 1.1334
2) 1.1260 2) 1.1368
3) 1.1225 3) 1.1388
The GBP/USD dipped 0.2 % to 1.3279.
Daily Support & Resistance points :
support Resistance
1) 1.3273 1) 1.3337
2) 1.3240 2) 1.3368
3) 1.3209 3) 1.3401
The USD/JPY increased 0.2 % to 113.34.
Daily Support & Resistance points :
support Resistance
1) 112.79 1) 113.43
2) 112.43 2) 113.71
3) 112.15 3) 114.07
The AUD/USD sank 0.4 % to 0.7066, just above its 13-month low of 0.7063.
Daily Support & Resistance points :
support Resistance
1) 0.7077 1) 0.7114
2) 0.7062 2) 0.7136
3) 0.7040 3) 0.7152
The dollar gained ground this week after Federal Reserve Chair Jerome Powell testified to Congress that inflation would remain high for longer than the central bank had predicted, and that Fed policymakers would consider a faster tapering of the central bank's bond-buying program at their December meeting.
This hawkish tone was maintained on Thursday, with San Francisco Fed President Mary Daly stating it may be time to "start building a plan" to raise interest rates to battle inflation, and Richmond Fed President Thomas Barkin discussing "normalizing policy."
Money markets are once again predicting that the central bank would raise its benchmark rate by 25 basis points at its June 2022 meeting, as they did before the first news about Omicron.
The focus now shifts to the release of the monthly official jobs report in the United States for signs that the labor market is strengthening. The report's generally definitive signals, however, are likely to be muffled by the fact that it predates the advent of the new version.
Nonfarm payrolls are predicted to have climbed by 560,000 in November, up from 531,000 in October, while the unemployment rate is expected to fall to 4.5 percent from 4.6 percent in October.
However, both the ADP private payrolls on Wednesday and the initial unemployment claims on Thursday were greater than predicted, indicating that a positive surprise is a possible possibility.
This is my personal opinion done with technical analysis of the market price and research online from Fundamental Analysts and News for The Fundamental point of view, not financial advice.
If you have any questions please ask and have a great day !!
Thank you for reading.

EURUSD SHORTS 📉📉📉As i told i would like to LONG USD this week, a perfect opportunity present on EU only if price reaches 1.13500 where we have an important sell area, imbalance fill on h4 + bearish orderblock all of them being located in a premium area on fibonaci that sets perfect sells entry. The market structure is bearish on HTF and we will go with the FLOW not AGAINST. DXY is bullish on HTF.
What do you think ? Comment below.. 📉📉📉

JPY BASKET SHORT - TERM SHORTS 📉📉📉On a short term perspective(start of the week) i see JPY to make a drop back into 9200 / 9080. Price rejected a bearish orderblock on d1 and filled a daily imbalance, also took out the stops above 9300 and reversed quickly. I would like to point that best trades right now are BULLISH JPY, but if you are more riskier you can try some shorts going into the start of the week.
What do you think ? Comment below


Eurjpy Monthy Time Usdcad Break Trend line now wait for retest then we enter for long Term in Buying 💹👍


