Possible price moves on EURUSDExpecting price to push up to $1.04000 before dropping, taking out the liquidity (£££) and down to 1.00000
Forexsetup

Possible sell setup for EURUSD Expecting price push up to 1.02400 before the drop to 1.01316, always apply risk management
Goodluck

Bulls EYE!I call this the Mount Everest Trade. The narrative goes like this:
There's an elusive move called the Judas Swing that happens in the Morning Zone or right before London Open.
Catch this move and you caught your trade of the day.
10 PIP Threshold aka SL.
The software aka price isn't programmed to come hit that.
Without a narrative to your trade you are blind trading.
Price + Time produce structure.
Now let's see if price follows the script!
Never Over Leverage.
Trust Your Trade Set Up.
Have fun!
I AM Pro Trading Made Simple

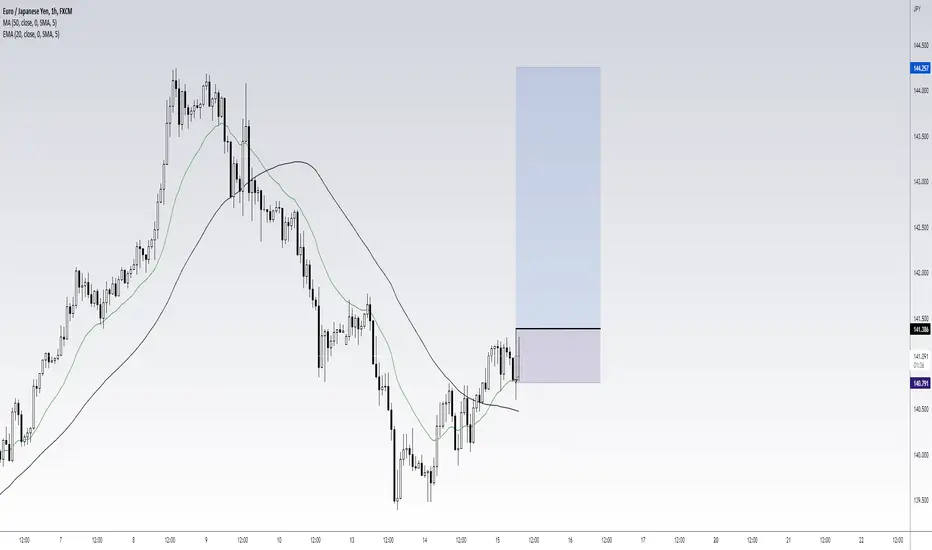
EUR/JPY BUY STOPS. Trend Continuation I am looking at EUY/JPY Buys at this area. I only provide trade entries.
eurusd short timefor the first time in my trading history i checked RSI indicator for possible divergence ! day by day i will be better - i don't want to be master the market i want to be the best version of my self , market help me to find my self and say hello to him

EUR/AUD LONG SETUPThis is a EUR/AUD Long setup. I only provide entries I hide my analysis.
If you like the setup please consider following.

EUR/GBP LONG SETUPThis is a EUR/GBP long setup. I hide my analysis.
If you like the signal then please consider following.

Could the USD be shaping up at another push lower? Hi, Trading view community and subscribers. Thanks for stopping by. Looking at the USD on the 4H, we see that sellers continue to hold prices outside a trend break. A mini consolidation continues to hold price action, but if the current seller momentum can continue to push forward and break out of the consolidation, this could lead to a new extension lower.
If buyers can hold support and rally to a new high above 103.70, that starts to cast some doubt on seller control.
Good trading

cadchf sell setup cadchf has the potential to experience a downtrend with the formation of a supply area that is still fresh and quite good if selling there

audusd sell zoneaudusd still has the potential to decline with fresh demand areas as follows: pay attention to Monday because it has the potential to be manipulated if there is a further decline

GoldViewFX - 4H & DAILY MARKET UPDATEHell All,
Okay so we have hit the 1826 target perfectly on our 4h chart idea. We will now wait to see how EMA5 challenged this level. This level has been tested twice before and a EMA5 failure to cross had price rejected back to 1814 and below. We need to taker caution in adding long without further confirmation.
If ema5 crosses 1826 with candle body close, we should see price leave RANGEBOX 2 and target the entrance of RANGEBOX 1 at 1836.
This could be an area to short but we will wait for confirmation before making a move.
DAILY CHART
Once again 1827 target was hit on the daily chart idea posted today. This level is strong resistance on the daily chart in line with the H4 chart. It has failed 4 x previously. However the Bullish structure is still supported by the daily chart Goldturn trendline, which may give the support needed to break through. We will keep you posted throughout the week so stay tuned.
Please don't forget to like, comment and follow to support us.
GoldViewFX
XAUUSD TOP AUTHOR

XPT/USD 1DAY CHART SETUPHi everyone this is my trade set up for the XPT/USD for the new week ahead
we had a very nice push last week and i feel it still has the legs to to make the push higher
XPT/USD is still pushing up so i am expecting a pullback to the order block zones and will be looking for a BUY trade
look for pullback to zones lined off on chart then if it meets your criteria for a trade then execute
This is my analysis only please trade with caution and risk management in place
good luck for this weeks trading
please like and comment both are welcome

EURCHF Sell a break.EURCHF - Intraday - We look to Sell a break of 1.0657 (stop at 1.0671)
There is no clear indication that the downward move is coming to an end.
Daily signals are bearish.
Daily pivot is at 1.0660.
The previous swing low is located at 1.0658.
A break of yesterdays low would confirm bearish momentum.
Our profit targets will be 1.0618 and 1.0608
Resistance: 1.0680 / 1.0690 / 1.0700
Support: 1.0670 / 1.0660 / 1.0650

GBPJPY Sell a break setup,GBPJPY - Intraday - We look to Sell a break of 154.39 (stop at 154.68)
We are trading at overbought extremes.
A higher correction is expected.
Trend line support is located at 154.60.
A break of 154.40 is needed to confirm follow through negative momentum.
Our profit targets will be 153.56 and 153.36
Resistance: 155.30 / 155.50 / 155.80
Support: 154.80 / 154.50 / 154.00

GBPJPY Sell a break setup.GBPJPY - Intraday - We look to Sell a break of 152.15 (stop at 152.41)
Bearish divergence can be seen on the 4 hour chart (the chart makes a higher high while the oscillator makes a lower high), often a signal of exhausted bullish momentum, or at least a correction lower.
Posted a Treble Top formation.
A higher correction is expected.
Expect trading to remain mixed and volatile.
The trend of lower highs is located at 152.36.
Offers ample risk/reward to sell at the market.
Our profit targets will be 151.41 and 151.21
Resistance: 152.30 / 152.60 / 152.85
Support: 152.00 / 151.80 / 151.50

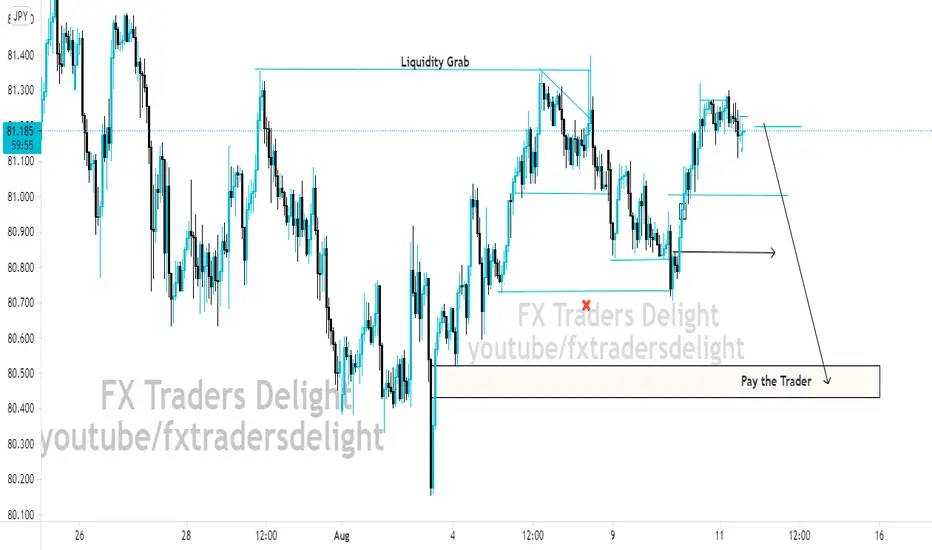
AUD/JPY Forex Analysis and ProjectionThe AUD/JPY has been falling for some time now, there has been a massive push to the downside which means the overall trend is bearish. Price trades lower and retraced back up creating liquidity, took liquidity it created, which makes it suitable for a sell opportunity to at least the liquidities below and on it's way to take out that liquidity, fair value gap is there to be filled.
NZDUSD facing bearish pressure|16th July 2021Prices are approaching 1st resistance, in line with horizontal overlap resistance, 61.8% Fibonacci extension level. Prices might reverse off to 1st support, in line with the horizonal swing low support, 161.8% Fibonacci retracement and 161.8% Fibonacci extension levels. If prices surpass the descending trendline resistance, it may face resistance from horizontal swing high resistance, in line with the 161.8% Fibonacci retracement and 100% Fibonacci extension . Stochastic indicator is approaching resistance of 91.17, further supporting our bearish view.
Any opinions, news, research, analyses, prices, other information, or links to third-party sites contained on this website are provided on an "as-is" basis, as general market commentary and do not constitute investment advice. The market commentary has not been prepared in accordance with legal requirements designed to promote the independence of investment research, and it is therefore not subject to any prohibition on dealing ahead of dissemination. Although this commentary is not produced by an independent source, FXCM takes all sufficient steps to eliminate or prevent any conflicts of interests arising out of the production and dissemination of this communication. The employees of FXCM commit to acting in the clients' best interests and represent their views without misleading, deceiving, or otherwise impairing the clients' ability to make informed investment decisions. For more information about the FXCM's internal organizational and administrative arrangements for the prevention of conflicts, please refer to the Firms' Managing Conflicts Policy. Please ensure that you read and understand our Full Disclaimer and Liability provision concerning the foregoing Information, which can be accessed on the website.

EURUSD approaching support, potential for bounce|8th July 2021EURUSD is approaching horizontal swing low support in line with 127.2% Fibonacci retracement and 61.8% Fibonacci extension . Prices might push up towards horizontal pullback resistance in line with 61.8% Fibonacci retracement and 78.6% Fibonacci 61.8%extension. If prices continue to push downwards, prices might bounce from 161.8% Fibonacci retracement and 100% Fibonacci extension . Stochastics is also approaching the 7.99 level, potential for a bounce.
Any opinions, news, research, analyses, prices, other information, or links to third-party sites contained on this website are provided on an "as-is" basis, as general market commentary and do not constitute investment advice. The market commentary has not been prepared in accordance with legal requirements designed to promote the independence of investment research, and it is therefore not subject to any prohibition on dealing ahead of dissemination. Although this commentary is not produced by an independent source, FXCM takes all sufficient steps to eliminate or prevent any conflicts of interests arising out of the production and dissemination of this communication. The employees of FXCM commit to acting in the clients' best interests and represent their views without misleading, deceiving, or otherwise impairing the clients' ability to make informed investment decisions. For more information about the FXCM's internal organizational and administrative arrangements for the prevention of conflicts, please refer to the Firms' Managing Conflicts Policy. Please ensure that you read and understand our Full Disclaimer and Liability provision concerning the foregoing Information, which can be accessed on the website.

GBPJPY approaching support, potential for bounce|2nd July 2021GBPJPY is approaching horizontal swing low support in line with 50% Fibonacci retracement and 78.6% Fibonacci extension . Prices might push up towards horizontal swing high resistance in line with 61.8% Fibonacci retracement and 78.6% Fibonacci extension . If prices continue to push down, prices might take support on horizontal swing low support in line with 78.6% Fibonacci extension . Ichimoku cloud is below prices, showing bullish pressure for prices.
Any opinions, news, research, analyses, prices, other information, or links to third-party sites contained on this website are provided on an "as-is" basis, as general market commentary and do not constitute investment advice. The market commentary has not been prepared in accordance with legal requirements designed to promote the independence of investment research, and it is therefore not subject to any prohibition on dealing ahead of dissemination. Although this commentary is not produced by an independent source, FXCM takes all sufficient steps to eliminate or prevent any conflicts of interests arising out of the production and dissemination of this communication. The employees of FXCM commit to acting in the clients' best interests and represent their views without misleading, deceiving, or otherwise impairing the clients' ability to make informed investment decisions. For more information about the FXCM's internal organizational and administrative arrangements for the prevention of conflicts, please refer to the Firms' Managing Conflicts Policy. Please ensure that you read and understand our Full Disclaimer and Liability provision concerning the foregoing Information, which can be accessed on the website.

CHFJPY facing bullish pressure | 2nd July 2021CHFJPY is facing bullish pressure as it holds above moving average and ascending trendline support. We could see a bounce at Buy Entry, in line with 38.2% Fibonacci retracement and 78.6% Fibonacci extension , and further rise towards Take Profit, in line with 78.6% Fibonacci extension and horizontal swing high resistance.
Any opinions, news, research, analyses, prices, other information, or links to third-party sites contained on this website are provided on an "as-is" basis, as general market commentary and do not constitute investment advice. The market commentary has not been prepared in accordance with legal requirements designed to promote the independence of investment research, and it is therefore not subject to any prohibition on dealing ahead of dissemination. Although this commentary is not produced by an independent source, FXCM takes all sufficient steps to eliminate or prevent any conflicts of interests arising out of the production and dissemination of this communication. The employees of FXCM commit to acting in the clients' best interests and represent their views without misleading, deceiving, or otherwise impairing the clients' ability to make informed investment decisions. For more information about the FXCM's internal organizational and administrative arrangements for the prevention of conflicts, please refer to the Firms' Managing Conflicts Policy. Please ensure that you read and understand our Full Disclaimer and Liability provision concerning the foregoing Information, which can be accessed on the website.

AUDJPY facing bearish pressure| 1st July 2021AUDJPY is facing bearish pressure. Prices might continue to drop upon breaking through support level in line with 50% Fibonacci retracement and 78.6% Fibonacci extension Fibonacci confluence area. Prices might drop towards support level in line with 78.6% Fibonacci retracement and -27.2% Fibonacci retracement Fibonacci confluence area. If prices bounce from our entry, prices might face resistance from horizontal pullback resistance in line with 50% Fibonacci retracement and 78.6% Fibonacci extension. MACD is also showing a bearish crossover, showing a further bearish pressure for prices.
Any opinions, news, research, analyses, prices, other information, or links to third-party sites contained on this website are provided on an "as-is" basis, as general market commentary, and do not constitute investment advice. The market commentary has not been prepared in accordance with legal requirements designed to promote the independence of investment research, and it is therefore not subject to any prohibition on dealing ahead of dissemination. Although this commentary is not produced by an independent source, FXCM takes all sufficient steps to eliminate or prevent any conflicts of interest arising out of the production and dissemination of this communication. The employees of FXCM commit to acting in the clients' best interests and represent their views without misleading, deceiving, or otherwise impairing the clients' ability to make informed investment decisions. For more information about the FXCM's internal organizational and administrative arrangements for the prevention of conflicts, please refer to the Firms' Managing Conflicts Policy. Please ensure that you read and understand our Full Disclaimer and Liability provision concerning the foregoing Information, which can be accessed on the website.

USDJPY approaching resistance, potential for reversalPrices are appraoching resistance in line with 127.2% Fibonacci retracement and 61.8% Fibonacci extension Fibonacci confluence . Prices might push down towards horizontal pullback support in line with ascending trendline resistance, 61.8% Fibonacci retracement, and 78.6% Fibonacci extension. If prices continue to push up, prices might face resistance from 161.8% Fibonacci retracement and 78.6% Fibonacci extension Fibonacci confluence. Stochastics is also showing resistance from 95.83 level.
Any opinions, news, research, analyses, prices, other information, or links to third-party sites contained on this website are provided on an "as-is" basis, as general market commentary, and do not constitute investment advice. The market commentary has not been prepared in accordance with legal requirements designed to promote the independence of investment research, and it is therefore not subject to any prohibition on dealing ahead of dissemination. Although this commentary is not produced by an independent source, FXCM takes all sufficient steps to eliminate or prevent any conflicts of interest arising out of the production and dissemination of this communication. The employees of FXCM commit to acting in the clients' best interests and represent their views without misleading, deceiving, or otherwise impairing the clients' ability to make informed investment decisions. For more information about the FXCM's internal organizational and administrative arrangements for the prevention of conflicts, please refer to the Firms' Managing Conflicts Policy. Please ensure that you read and understand our Full Disclaimer and Liability provision concerning the foregoing Information, which can be accessed on the website.

GBPJPY potential for bounce| 1st July 2021GBPJPY broke out of descending trendline resistance and is currently taking support on horizontal swing low support in line with 38.2% Fibonacci retracement and 78.6% Fibonacci extension. Prices might push up towards horizontal swing high resistance in line with 78.6% Fibonacci extension and 61.8% Fibonacci retracement. If prices push down, prices might take support on horizontal swing low support in line with 161.8% Fibonacci extension and 78.6% Fibonacci retracement. 34 EMA is also below prices, showing a bullish pressure for prices.
Any opinions, news, research, analyses, prices, other information, or links to third-party sites contained on this website are provided on an "as-is" basis, as general market commentary, and do not constitute investment advice. The market commentary has not been prepared in accordance with legal requirements designed to promote the independence of investment research, and it is therefore not subject to any prohibition on dealing ahead of dissemination. Although this commentary is not produced by an independent source, FXCM takes all sufficient steps to eliminate or prevent any conflicts of interest arising out of the production and dissemination of this communication. The employees of FXCM commit to acting in the clients' best interests and represent their views without misleading, deceiving, or otherwise impairing the clients' ability to make informed investment decisions. For more information about the FXCM's internal organizational and administrative arrangements for the prevention of conflicts, please refer to the Firms' Managing Conflicts Policy. Please ensure that you read and understand our Full Disclaimer and Liability provision concerning the foregoing Information, which can be accessed on the website.
