DXY (US Dollar): Bullish Order FlowA bullish order block has been identified on the H1 timeframe, situated below the Asian session range. With the US Dollar maintaining steady strength, there is potential for price to retrace into this order block for mitigation. Should this occur, a continuation of the bullish trend is anticipated, with price likely to rally and break above the recent structural high.
Forexsignal

GBPCHF Breakout Eyes 1.1190–1.1290 as Bullish Momentum BuildsGBP/CHF has broken out of a descending wedge formation on the 4H chart, indicating a bullish shift in momentum. This move is supported by a recovering GBP, driven by better-than-expected UK GDP data and BoE easing expectations already priced in. Meanwhile, CHF is softening on safe-haven unwinding and a less aggressive SNB tone. Technicals point to a clean breakout with immediate upside targets at 1.1116 and 1.1190, with potential extension toward 1.1290.
🔍 Technical Analysis
Pattern: Descending wedge breakout on the 4H chart — a bullish continuation pattern.
Breakout Confirmation: Price is now trading above wedge resistance (~1.1045), showing follow-through buying.
Support zone: 1.1000–1.1040 (retest area if price pulls back)
Fibonacci Levels:
1.1116 → 50% Fib retracement + prior resistance
1.1190 → 61.8% Fib and historical reaction zone
1.1290 → 78.6% retracement and next key resistance
📈 Bullish Signals:
EUR/GBP overlay shows inverse correlation supporting GBP strength
Higher lows forming since April → structure is rising
Clean breakout with space to run before major resistance hits
🌍 Fundamental Context
🇬🇧 British Pound (GBP):
UK Q1 GDP: +0.6% q/q — solid beat vs expectations
BoE Positioning: Rate cut expected in H2 2025, but not imminent; GBP supported in the meantime
Trade Conditions: Signs of recovery, but BoE not overly dovish yet
Market Tone: GBP favored short-term due to economic resilience
🇨🇭 Swiss Franc (CHF):
SNB Stance: Recent tone shift toward caution amid deflation signals
Safe Haven Demand: Easing due to progress in U.S.–China trade talks
Macroeconomic Data: Mixed; CPI soft, and growth modest
CHF Outlook: Mildly bearish unless geopolitical risk reignites
🎯 Trade Setup
Entry: Breakout already underway at 1.1050
Upside Targets:
1.1116 (first TP)
1.1190 (major resistance zone)
1.1290 (extension zone)
Stop Loss: Below 1.1000 (below wedge retest zone)
Strategy: Buy-the-dip on pullback to 1.1040–1.1015, or hold breakout long
🧭 Conclusion
GBP/CHF shows a clean bullish breakout both technically and fundamentally. With the UK economy showing near-term resilience and the SNB expected to remain cautious, GBP strength may persist in the short run. Unless geopolitical risks resurface to revive CHF demand, the pair looks poised for a rally toward 1.1190 and possibly 1.1290 in the coming sessions.

EUR/USD Daily Short SetupSetup: Retest of the former support zone (now supply) after the recent pullback from the mid-April highs
Entry: Short around 1.1336 (within the shaded resistance box)
Stop-Loss: Above the recent swing high at 1.1390
Take-Profit: Near the lower range support at 1.0735
Risk : Reward: ~1 : 5
Rationale:
Following a strong rally from early March to mid-April, EUR/USD has corrected sharply and is now back into the grey supply area that previously acted as support. This zone is likely to cap upside moves, making a short entry here attractive. The next major support lies around 1.0735, offering a high reward relative to risk. A break above 1.1390 would invalidate the setup.

AUD/CHF Loonie Heist: Sniping Swiss Profits with Thief Trading!🌍 Hello Global Traders! 🌟
Money Makers, Risk Takers, and Market Shakers! 🤑💸✈️
Dive into our AUD/CHF "Aussie vs Swiss" Forex heist, crafted with the signature 🔥Thief Trading Style🔥, blending sharp technicals and deep fundamentals. Follow the strategy outlined in the TradingView chart, focusing on a long entry targeting the high-risk MA Zone. Expect a wild ride with overbought conditions, consolidation, and potential trend reversals where bearish players lurk. 🏆💰 Celebrate your wins, traders—you’ve earned it! 💪🎉
Entry 📈: The vault’s open! Grab bullish opportunities at any price, but for precision, set buy limit orders on a 15 or 30-minute timeframe near swing lows or highs for pullback entries.
Stop Loss 🛑:
📍 Place your Thief SL at the recent swing low on the 4H timeframe (0.52300) for scalping or day trades.
📍 Adjust SL based on your risk tolerance, lot size, and number of open orders.
Target 🎯: Aim for 0.56000.
💵 AUD/CHF is riding a bullish wave, fueled by key market drivers. ☝
Unlock the full picture—dive into Fundamentals, Macro Insights, COT Reports, Quantitative Analysis, Sentiment Outlook, Intermarket Trends, and Future Targets. Check 👉🌎🔗.
⚠️ Trading Alert: News & Position Management 📰🚨
News can shake the market hard. Protect your trades by:
Avoiding new entries during news releases.
Using trailing stops to lock in profits and shield running positions.
📌 Markets move fast—stay sharp, keep learning, and adapt your strategy as conditions evolve.
💖 Power up our heist! 🚀 Tap the Boost Button to amplify our Thief Trading Style and make stealing profits a breeze. Join our crew, grow stronger, and conquer the markets daily with ease. 🏆🤝❤️
Catch you at the next heist, traders—stay ready! 🤑🐱👤🤩

CAD/CHF Loonie Heist: Sniping Swiss Profits with Thief Trading!🌍 Hello Global Traders! 🌟
Money Makers, Risk Takers, and Market Shakers! 🤑💸✈️
Dive into our CAD/CHF "Loonie vs Swiss" Forex heist, crafted with the signature 🔥Thief Trading Style🔥, blending sharp technicals and deep fundamentals. Follow the strategy outlined in the TradingView chart, focusing on a long entry targeting the high-risk MA Zone. Expect a wild ride with overbought conditions, consolidation, and potential trend reversals where bearish players lurk. 🏆💰 Celebrate your wins, traders—you’ve earned it! 💪🎉
Entry 📈: The vault’s open! Grab bullish opportunities at any price, but for precision, set buy limit orders on a 15 or 30-minute timeframe near swing lows or highs for pullback entries.
Stop Loss 🛑:
📍 Place your Thief SL at the recent swing low on the 1H timeframe (0.59400) for scalping or day trades.
📍 Adjust SL based on your risk tolerance, lot size, and number of open orders.
Target 🎯: Aim for 0.61400.
💵 CAD/CHF is riding a bullish wave, fueled by key market drivers. ☝
Unlock the full picture—dive into Fundamentals, Macro Insights, COT Reports, Quantitative Analysis, Sentiment Outlook, Intermarket Trends, and Future Targets. Check 👉🌎🔗.
⚠️ Trading Alert: News & Position Management 📰🚨
News can shake the market hard. Protect your trades by:
Avoiding new entries during news releases.
Using trailing stops to lock in profits and shield running positions.
📌 Markets move fast—stay sharp, keep learning, and adapt your strategy as conditions evolve.
💖 Power up our heist! 🚀 Tap the Boost Button to amplify our Thief Trading Style and make stealing profits a breeze. Join our crew, grow stronger, and conquer the markets daily with ease. 🏆🤝❤️
Catch you at the next heist, traders—stay ready! 🤑🐱👤🤩


US30 Technical Analysis – GTE VIP Sell AlertUS30 Technical Analysis – GTE VIP Sell Alert
Price has tapped into a strong resistance zone near 41,700, where previous rejections occurred. After a sharp bullish push, momentum appears to be slowing, and the market is overextended on the 1H chart. We expect a potential retracement toward the mid-range or support zone near 41,600–41,550. Stochastic is in the overbought area, signaling a possible reversal.

Week of 5/11/25: AUDUSD AnalysisDaily is bullish, so in the future price possibly will trend up.
In the meantime 4h and 1h are bearish but has reached a critical daily demand zone at the extreme of daily structure.
So far 1h internal is bullish, so we are still looking for longs cautiously until structure is broken.
Major news:
China trade talks - Monday
CPI - Tuesday
PPI/Unemployment - Thursday

CAD/USD growing more bullishIn this chart we can see the CAD/USD conversion rate has formed a bullish divergence.
This pattern is formed when price action creates lower lows whereas simultaneously the RSI creates higher lows.
This divergence is indicative of a future sharp and sudden rise in price.
Entered (2) 6CM contracts at .72145
Target price of .72645

USDCAD – Reversal Setup Ahead of FOMC DecisionUSD/CAD has bounced off strong support near 1.3770, forming a clean bullish structure into a pivotal week dominated by the FOMC meeting. Price action shows higher lows and a tightening range, signaling a potential breakout. With the Fed expected to hold rates but maintain a hawkish tone, the USD may regain strength — especially against the CAD, which remains under pressure from trade risks and weak oil prices.
🔹 Technical Setup:
Structure: Rejection at 1.3770 support with ascending trendline developing.
Pattern: Bullish flag breakout (visible on 2H chart).
Momentum: Recovery candles suggest buyers regaining control ahead of resistance.
Key Levels:
Support: 1.3770 – 1.3780
Resistance:
TP1: 1.3852 (Fib 61.8%)
TP2: 1.3891 (swing high zone)
TP3: 1.3950 (major breakout target)
Invalidation: Below 1.3760
🧠 Fundamental View:
USD Outlook:
The Fed is widely expected to hold interest rates steady on May 7, but officials are pushing back against early rate-cut expectations. Chair Powell is likely to emphasize inflation risks and signal no imminent easing. This stance supports USD resilience, especially if the Fed reiterates “higher for longer” messaging.
CAD Outlook:
The Canadian economy continues to face export challenges from U.S. tariffs, weakening business sentiment. Meanwhile, softening oil prices reduce support for the CAD. With the Bank of Canada having already delivered several rate cuts, it remains more dovish than the Fed — creating a widening policy divergence.
💡 Trade Idea:
Bias: Bullish above 1.3780
Entry Zone: 1.3800–1.3820
Target 1: 1.3852
Target 2: 1.3891
Target 3: 1.3950
Stop Loss: Below 1.3760
📌 Watch for volatility during and after the FOMC statement and Powell’s press conference. A hawkish surprise could fuel a sharp move toward 1.39+.

EURUSD Is Ready to Break Resistance LinesEURUSD ( FX:EURUSD ) is trying to break the Resistance lines , it has tried several times in the past few days but failed. Will EURUSD succeed this time?
In terms of Elliott wave theory , it seems that EURUSD has completed the main wave 4 near the Support zone($1.1300-$1.1160) and Support line , and we should wait for impulsive waves . Breaking the Resistance zone($1.1480-$1.1420) can confirm the end of the main wave 4 . Otherwise , the main wave 4 can have other forms.
I expect EURUSD to break the Resistance lines in this attack and rise to at least $1.1384 , and the next target can be around $1.1437 .
Note: If EURUSD can break below $1.1272(the worst Stop Loss(SL)), we can expect more dumps.
Please respect each other's ideas and express them politely if you agree or disagree.
Euro/U.S. Dollar Analyze (EURUSD), 1-hour time frame.
Be sure to follow the updated ideas.
Do not forget to put a Stop loss for your positions (For every position you want to open).
Please follow your strategy and updates; this is just my Idea, and I will gladly see your ideas in this post.
Please do not forget the ✅' like '✅ button 🙏😊 & Share it with your friends; thanks, and Trade safe.

GBPUSD BIG MOVE COMING?Structure Overview:
The market has been ranging within a clear horizontal consolidation zone, with two key zones:
Support Zone: 1.32600 - 1.33000 (gray box at the bottom)
Resistance Zone : 1.33500 - 1.33800 (gray box at the top)
Price recently broke above the upper consolidation range, suggesting bullish momentum.
🔍 Analysis:
The pair has broken out of the consolidation range after multiple rejections from the support zone.
We now look for a potential retest of the previous resistance (1.33500 area) as new support.
Two potential bullish continuation scenarios are highlighted:
📌 Trade Plan:
Scenario 1 – Immediate Continuation:
If price holds above 1.33500, look for bullish continuation toward:
TP1: 1.34026
TP2: 1.34208
Scenario 2 – Retest Setup:
Wait for a pullback to the 1.33000–1.33500 zone.
Confirmation of bullish rejection (e.g., bullish engulfing or pin bar) could provide a high-probability long setup.
Entry: After bullish confirmation in retest zone
SL: Below 1.33000 (invalidates breakout)
TP: 1.34026 / 1.34208
📉 Invalidations:
A clean break and close below 1.33000 may suggest a failed breakout, putting 1.32600 back into play.
🧠 Bias: Bullish (as long as 1.33000 holds)
🕒 Timeframe: 4H

Bearish reversal?USD/JPY is rising towards the pivot which has been identified as an overlap resistance and could reverse to the 1st support which is a pullback support.
Pivot: 146.90
1st Support: 142.06
1st Resistance: 150.92
Risk Warning:
Trading Forex and CFDs carries a high level of risk to your capital and you should only trade with money you can afford to lose. Trading Forex and CFDs may not be suitable for all investors, so please ensure that you fully understand the risks involved and seek independent advice if necessary.
Disclaimer:
The above opinions given constitute general market commentary, and do not constitute the opinion or advice of IC Markets or any form of personal or investment advice.
Any opinions, news, research, analyses, prices, other information, or links to third-party sites contained on this website are provided on an "as-is" basis, are intended only to be informative, is not an advice nor a recommendation, nor research, or a record of our trading prices, or an offer of, or solicitation for a transaction in any financial instrument and thus should not be treated as such. The information provided does not involve any specific investment objectives, financial situation and needs of any specific person who may receive it. Please be aware, that past performance is not a reliable indicator of future performance and/or results. Past Performance or Forward-looking scenarios based upon the reasonable beliefs of the third-party provider are not a guarantee of future performance. Actual results may differ materially from those anticipated in forward-looking or past performance statements. IC Markets makes no representation or warranty and assumes no liability as to the accuracy or completeness of the information provided, nor any loss arising from any investment based on a recommendation, forecast or any information supplied by any third-party.

GBPJPY Signal : 1H / 4H Beautiful buy !!!Hello Traders! 👋
What are your thoughts on GBPJPY ?
GBPJPY
Market price : 192.40
Buy Limit: 191.20 - 191.00
Tp1 : 192.10
Tp2 : 193.10
Tp3 : 194.50
Tp4 : 195.90
Sl : 190.10 ( 100 pip )
Don’t forget to like and share your thoughts in the comments! ❤️
Remember this is a position that was found by me and it is a personal idea not a financial advice, you are responsible for your loss and gain.

NZDCHF Bullish Outlook – Wedge Breakout Setup in PlayAscending Structure: Price action has been respecting a series of higher lows, supported by an ascending trendline – a key indicator of bullish pressure.
Bullish Flag/Wedge Formation: The current price is consolidating inside a rising wedge, typically seen as a continuation pattern in bullish trends, especially when preceded by a strong rally.
Breakout Zone: A breakout above the wedge resistance (~0.4915–0.4930) opens the path to retest the recent high at 0.4953, and further to 0.4985 resistance.
Volume & Momentum: If confirmed by bullish momentum or strong candle close above the wedge, it validates further upside.
Key Levels:
Support: 0.4870 (trendline base), 0.4800 (invalidates setup)
Immediate Resistance: 0.4930
Targets:
TP1: 0.4953
TP2: 0.4985 (measured move from wedge)
✅ Confluence for Bullish Setup:
Price respecting higher low structure.
Bullish consolidation wedge near previous highs.
Clean upside path if price breaks above 0.4930.
⚠️ Invalidation:
If price breaks below 0.4870, this would invalidate the bullish structure and could suggest a retest of 0.4800, making the current setup a potential bull trap.

NFP Analysis: More Bullish Order Flow?The Dollar has broken structure to the upside and is now pulling back into equilibrium. From this discounted level, I'm looking to capitalise on any valid bullish setups, as break-of-structure moves often lead to continuation towards previous highs.

USDJPY Bearish Forecast, More Bearish Order FlowAfter the recent change of character from Monday, UJ continued lower and broke the H1 structure. As we all know, whenever you get a break of structure, expect a pullback. On the H4 there is a nice bearish OB which serves as a nice point of interest for price to rally back towards, be mindful this OB is big so we don't know what to expect once price reaches it.
For now this is how I see the dollar heading towards.

btcusdt LONG , 4hIn my opinion, Bitcoin can be traded long from 74035.32, with a stop loss of 65484.72 and a take profit of 99570.55. Usually, my suggestion is to risk 1 to 3 percent of your total money in trades.

USD/JPY : Bull or Bear? Let's See! (READ THE CAPTION)Upon reviewing the USD/JPY chart on the daily timeframe, we observe that due to the sharp drop in the Dollar Index, the price has reached the 140.850 level. This decline was very strong and impulsive; however, as seen on the chart, the price has now approached a significant demand zone between 139.6 and 141. If the price manages to close and stabilize above this area, we can expect a further bullish move from this pair.
Please support me with your likes and comments to motivate me to share more analysis with you and share your opinion about the possible trend of this chart with me !
Best Regards , Arman Shaban

gbpjpy sell signalIn this analysis, it has exited an ascending channel and entered a descending channel. According to the analysis, if that support floor is crossed and a pullback to that resistance level, that is, the price is 190.829, it is suitable for selling and the stop loss is at 191.87 with a risk to reward of 1 to 5.82.

EURNZD strong daily demand level at 1.89. Long biasSupply and demand imbalances are the driving forces behind price movements in the Forex market. By identifying these key zones or imbalances, traders can anticipate high-probability reversal or continuation setups. Today, we’ll analyze the EURNZD cross pair, which has recently formed a strong demand imbalance at $1.89—the most significant impulse in months.
The Power of Supply & Demand Imbalances
Supply and demand trading revolves around identifying areas where price has made a strong, impulsive move (demand or supply zone) and then waiting for a retracement into that zone for a potential reversal or continuation.
Key Characteristics of a Strong Imbalance:
✅ Extended Range Candles (ERC): Strong, wide-bodied candles indicate institutional buying/selling.
✅ Strong Imbalance: A clear shift in market structure after a strong rally or drop.
✅ Fresh Zone: The imbalance has not been tested yet or has only been tested once.

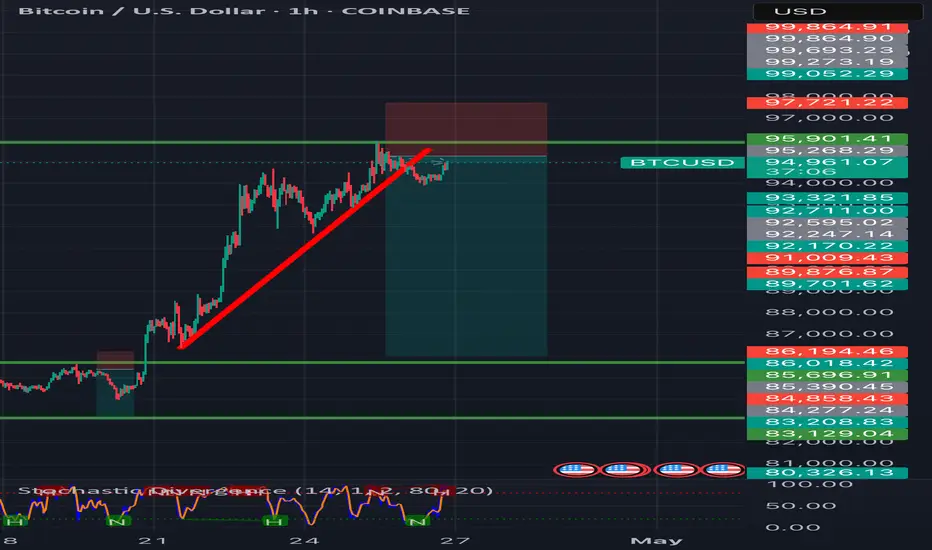
Bitcoin sell technical analysis Description:
Bitcoin is rejecting major resistance near $94,000 after forming a bearish engulfing candle on the 4H chart.
• Key Resistance: $94,000–$95,000 zone rejected with strong selling pressure.
• RSI Divergence: Bearish divergence between price and RSI confirms weakness.
• Break of Support: Price broke minor support at $92,800, shifting short-term structure bearish.
• Moving Averages: Trading below the 50 EMA on the 4H chart, signaling bearish momentum.
Sell Setup:
• Look for entries around $93,500–$94,000 (retest zone).
• Stop-loss above $95,000.
• TP1: $91,000
• TP2: $88,500
Bitcoin is showing clear signs of a pullback — sellers are currently in control.
USDCHF | Resistance LevelOpportunity for Short Trade as price reaches resistance level
Stop Loss and Take profit values on the chart.
