We could see an upward move up to $3350!There is a lot of buy-side liquidity resting in the gold market. There are 2 to 3 daily highs currently unchallenged, and even a weekly high is in place. The market has already moved downward and created inducement (a trap or manipulation to draw sellers in), which now makes the market appear bullish from this point.
We could see an upward move up to $3350 or even higher—especially if a 4-hour candle closes above $3360. At this point, it’s better to wait for clear displacement (strong movement indicating a direction). After that, we’ll see how the market develops.
Do Your Own Research (DYOR)! This is not financial advice.
Forexsignal

Market next move 🚫 Disruption Points
1. No Clear Breakout Confirmation
Issue: The chart does not show a clear breakout of any recent highs or resistance levels.
Disruption: Without a break of a key level (like 1.3480–1.3500), the bullish target is premature.
2. Bearish Price Structure
Observation: The price has been making lower highs and lower lows over the last few candles.
Disruption: This may indicate a downtrend, not a setup for a bullish target.
3. Low Momentum
Issue: Volume appears to be declining, and recent bullish candles are smaller and weaker.
Disruption: The move toward the target may lack strength and could reverse without momentum.

Market next target 🔍 Original Analysis Summary
Resistance Zone: Around 1.1360
Support Zone: Same level after breakout (suggesting a breakout and retest pattern)
Target: Around 1.1450 after breakout
---
🚫 Disruption Points
1. False Breakout Risk
What could happen: Price might break the resistance briefly and then fall back below it.
Why: Lack of volume or confirmation, or a market maker trap to gather liquidity above the resistance zone.
Disruption: Instead of forming new support, it could become a bull trap leading to a sharp reversal.
2. Fundamental Risk
What could happen: Unexpected U.S. or Eurozone economic data (like NFP, CPI, or ECB/Fed announcements) may shift sentiment suddenly.
Why: The image shows upcoming news events (flag icons), which could induce volatility.
Disruption: The news might push EUR/USD sharply down even if a breakout occurs.
3. Bearish Divergence (if applicable)
What could happen: If RSI or MACD were included, they might show divergence while price is rising.
Why: Divergence typically precedes reversals.
Disruption: This would undermine the bullish breakout thesis.

Market next move ⚠️ Disruption of the Bullish Silver Setup:
---
1. Misleading Support-Resistance Interpretation
The resistance zone highlighted is flat and overlapping with multiple wicks.
The support zone is not well-established; it's only tested once or twice with weak bounce reaction, which is not enough to consider it strong support.
---
2. Lack of Bullish Confirmation
The price is currently hovering around the support with no breakout candle or strong bullish engulfing pattern.
The recent candlesticks near resistance are small-bodied with long wicks, suggesting indecision or weakening buying power, not strength.
---
3. Volume Disagreement
There's no surge in bullish volume that would confirm buyers stepping in.
The large red volume bars toward the right indicate selling pressure dominating, which contradicts the bullish target.
Market next move 🔍 Disruption of the Bullish Setup on GOLD:
1. Range Market Ignored:
The price is moving sideways in a tight consolidation, indicating range-bound behavior rather than a breakout setup.
The chart projects a bullish move, but there's no confirmed breakout of the resistance zone yet.
2. Weak Resistance Zone:
The identified “resistance” zone is very narrow and lacks strong rejection wicks or significant bearish volume.
It's unclear if this is true resistance or just part of the ongoing chop.
3. Lack of Volume Confirmation:
Volume remains moderate and doesn’t show increasing buying pressure, which would be expected if bulls were preparing a breakout.
No signs of volume climax or absorption, which are typical before breakouts.
4. Premature Targeting:
The target area is placed far above the resistance zone without a measured move or pattern basis (e.g., no flag, no cup-and-handle, no inverse head and shoulders).
This could be misleading as it sets unrealistic expectations.

Market next move Disruption of the Current Analysis:
1. False Breakout Risk:
The price is consolidating under a clearly marked resistance, but there’s no confirmation of a breakout yet.
The bullish arrows (prediction path) assume a breakout without waiting for a confirmed close above resistance, which is premature.
2. Low Momentum Candles:
The recent candles are small-bodied with wicks on both sides — signs of indecision.
No strong bullish momentum candle exists to support the projection.
3. Volume Mismatch:
Volume spiked recently, but the candle was red — this could indicate supply absorption or selling into strength, not accumulation.
A bullish scenario would require increasing volume on green candles breaking resistance.
4. Bearish Trend Context Ignored:
The chart shows a clear preceding downtrend, and what follows could simply be a bearish flag or dead cat bounce.
Marking this as the beginning of a bullish reversal overlooks the overall bearish context.

Market next move 🔍 Disruption/Critique of the Current Target Analysis:
1. Lack of Technical Justification:
The chart marks a “Target” level without referencing a clear technical basis (e.g., resistance, Fibonacci level, or moving average).
Without a corresponding pattern or indicator signal (e.g., breakout, double bottom, divergence), the target seems arbitrary.
2. Volume Spike Misinterpretation:
While there’s a volume spike in the last candle, it's accompanied by a bearish candle, suggesting potential selling pressure, not buying strength.
A bullish continuation would ideally require a green candle with increasing volume, which is absent here.
3. Market Context Ignored:
No consideration of broader market context such as macroeconomic news, DXY strength, or interest rate expectations which heavily impact GBP/USD.
The U.S. flag icon indicates upcoming news – trading before such events can be risky and invalidate the technical target.
4. Resistance Zone Overlooked:
The “Target” lies near the 1.3500 psychological level, which often acts as resistance. This isn’t discussed or marked.
Recent price action near that level shows rejection, making it a questionable target without strong buying confirmation

EURGBP forex swing trade playing out off weekly demand levelThe EURGBP forex swing trade playing out off weekly demand level as expected. I hope you are taking advantage of this investment opportunity. There is a lot of profit for margin for this Forex cross pair.

Market next target ⚠️ 1. Bearish Momentum Remains Intact
The last few candles are strongly bearish, with steep declines and high red candle volume.
Attempting to project an upside target amid this current bearish drive lacks alignment with actual market sentiment.
---
📉 2. Lack of Reversal Candlestick Patterns
There is no clear bullish reversal pattern visible at the point of target placement:
No hammer, bullish engulfing, or morning star pattern.
The price may just be pausing before continuing its downward trend.
---
🔊 3. Volume Discrepancy
The rising volume on red candles vs. low volume on recent green candles shows selling pressure outweighs buying interest.
A reliable bullish setup would typically come with higher buying volume after a selloff, which is not yet seen.
---
🧭 4. Misleading “Target” Location
The marked target is at a higher high, near 33.75–34.00 area, which:
Is not supported by immediate technical breakout
Seems to ignore the last failed attempt to break above that level
Appears overly optimistic given the current trend direction

Market next move
🔍 1. Weak Confirmation for Target Level
The marked "TARGET" area lacks strong technical confirmation such as:
Resistance zone retest.
Fibonacci level confluence.
Moving average alignment.
Without solid technical backing, this target may appear speculative.
---
📉 2. Bearish Momentum is Strong
The last few candles show strong red (bearish) momentum.
The price has broken short-term support levels (e.g., local lows from the 29th).
Volume is increasing on bearish candles, signaling strong selling pressure.
Setting a bullish target while in a bearish momentum phase might be premature.
---
🕒 3. Timeframe Limitations
This is a 1-hour chart, which is more prone to noise and false signals.
Higher timeframes (like 4H or Daily) should be checked to validate this upward target.

Market next move 🔻 Potential Disruptions to the Bullish Scenario:
1. False Breakout Risk at the Resistance Zone
The price is hovering near a horizontal resistance zone (red box).
Repeated wicks at this level suggest selling pressure.
If price breaks above slightly and then pulls back inside the range, it could be a bull trap, triggering a sharp drop (red arrow).
2. Weak Follow-Through on Volume
Recent bullish candles show no increase in volume.
This hints at lack of conviction among buyers, increasing the chance of a reversal rather than continuation.
3. Bearish Divergence Possibility
If we applied RSI or MACD here, there’s a high chance of bearish divergence forming (price making higher highs, while indicators show lower highs), signaling potential reversal pressure.
4. Upcoming U.S. News Events
U.S. economic announcements (indicated by icons) could strengthen the USD, causing GBP/USD to drop suddenly despite the bullish technical structure.
5. Bearish Candlestick Pattern Forming
If the current or next candle closes as a shooting star, evening star, or bearish engulfing, it would be a classic reversal pattern from resistance.
6. Liquidity Grab Above Highs
Market makers may push the price above resistance to trigger stop-losses and induce longs, then reverse—classic liquidity hunt scenario.

Market next move 🔻 Disruption Scenarios:
1. Resistance Zone at Target Level
The marked "Target" could coincide with a strong resistance level from a previous high.
Price may reject this level again, forming a double top or bearish reversal candlestick pattern (e.g., shooting star or bearish engulfing).
2. Volume Divergence
The recent uptrend shows a slight drop in buying volume.
If price increases while volume decreases, it signals a potential exhaustion of bullish momentum.
3. Upcoming News Events (Fundamentals)
The chart shows several upcoming economic events (news icons).
Any negative surprise from U.S. data or positive Eurozone data could reverse the trend sharply.
For example, better-than-expected U.S. employment data could strengthen the USD, pushing EUR/USD down.
4. Overbought Condition
If we add an RSI (Relative Strength Index) or Stochastic oscillator, the price might already be in the overbought zone, suggesting a correction is due.
5. Fake Breakout Trap
If the price hits the “Target” but then fails to close above it, it could be a bull trap, triggering short positions and leading to a sharp sell-off.

euraud buy signal. Don't forget about stop-loss.
Write in the comments all your questions and instruments analysis of which you want to see.
Friends, push the like button, write a comment, and share with your mates - that would be the best THANK YOU.
P.S. I personally will open entry if the price will show it according to my strategy.
Always make your analysis before a trade

Market next move 🔺 Disruption to Bearish Thesis
1. Strong Bullish Momentum Recently
Recent candles show a series of green bullish candles with increasing size.
Indicates strong buying interest—not a sign of exhaustion, which would support further downside.
2. Volume Spike on Green Candles
Volume surged during the recent bullish candles.
This typically signals accumulation, not distribution — contradicting the bearish outlook.
3. Failure to Break Key Support
Price previously bounced sharply from below 33.0000, showing buyers defended that zone.
This bounce suggests the support is strong, weakening the argument for a move toward the lower target.
4. Reversal Pattern Possible (Double Bottom)
The chart may show early signs of a double bottom or higher low, both bullish reversal signals.
These patterns would negate the bearish projection if confirmed with a higher high.
5. Divergence from US Dollar Weakness
If the US Dollar shows weakness, silver could rally due to its inverse correlation.
The marked target may not be achieved if macro forces support precious metals.

Market next move 🔻 Disruption to Bullish Thesis
1. Resistance Zone Near Target
The "Target" area might align with a previous resistance level (historically where price has reversed or consolidated).
If price hits that zone, it could stall or reject, rather than break through.
2. Bearish Volume Divergence
While the candles are green and pushing upward, volume is not increasing significantly.
Lack of strong buying volume can suggest a weak rally — potentially a bull trap.
3. Trend Context: Larger Downtrend
The chart shows a strong prior downtrend before the recent small upward push.
This move could be a dead-cat bounce or retracement within a broader bearish move.
4. Fundamental Risk: USD Strength
If the US Dollar Index (DXY) strengthens due to macroeconomic data or Fed commentary, gold (USD-denominated) typically drops.
The calendar icons suggest upcoming US economic data, which could disrupt gold’s movement.
5. Candle Structure Shows Exhaustion
The current bullish candles are smaller compared to previous strong red ones.
This may imply momentum exhaustion before reaching the target.

Market next move
🚨 Disruption: Bearish Outlook
🔻 1. Lower High Pattern Forming
Price peaked earlier and has not made a new high. Instead, we’re seeing a flattening top. This could indicate distribution rather than continuation. A failure to break above ~$2,675 confirms a lower high.
🔻 2. Diverging Momentum
The price has moved sideways with decreasing volume, suggesting momentum is fading. Buyers may be losing interest, setting up for a reversal or sharp dip.
🔻 3. Bearish Candlestick Rejection
Recent candles show upper wicks, signaling selling pressure at highs. If this continues, the price may be forming a rounded top, not prepping for a breakout.
🔻 4. Potential Breakdown Zone
If ETH falls below the ~$2,620 support region, it opens the door to $2,580 or even $2,540, especially ahead of upcoming economic events (marked on the chart) which may spook risk markets.
🔻 5. Liquidity Trap Risk
This small bounce could be a liquidity trap—pulling in long traders before reversing sharply. This tactic often happens ahead of volatility spikes

Market next target
📊 Original Analysis Summary:
Bias: Bullish reversal expected from the support box.
Path: Minor pullback followed by a breakout toward a higher target.
Indicators: Green arrow bounce, blue and yellow upward paths projecting continuation.
---
🚨 Disruption & Bearish Risks:
🔴 1. Support Zone is Weak
The price dipped into the red support box and bounced, but barely made a strong recovery. A weak reaction from this zone could signal buyers are hesitant or exhausted.
🔴 2. Bear Flag Formation
The current price action could be forming a bear flag pattern: a brief upward consolidation following a sharp drop. If confirmed, this would likely lead to another leg down, not up.
🔴 3. Volume Discrepancy
The bounce lacks volume confirmation—note the relatively low buying bars after the large red selling volume spike. This suggests weak bullish conviction and potential for another sell-off.

Market next move
📊 Current Analysis Summary:
Pair: USD/JPY on the 1-hour timeframe.
Bias: Bullish breakout above a minor consolidation (highlighted box).
Target: Set higher, implying continuation of upward momentum.
Arrows: Show bullish path with a minor pullback, then a breakout continuation.
---
❌ Disruptive Breakdown:
🔴 1. Fake Breakout Risk
Price is testing the upper bound of the consolidation box. If this breakout fails to hold, it could trap late buyers. A rejection back inside the box might trigger a bearish reversal—a textbook bull trap scenario.
🔴 2. Volume Divergence
Despite the green breakout candle, the volume spike is not aggressive enough. If volume fails to increase further, it may suggest exhaustion, not momentum. This divergence undermines the breakout’s credibility.
🔴 3. Fundamental Uncertainty
Several U.S.-related economic icons (e.g., high-impact news) are visible. A hawkish BoJ or weaker-than-expected U.S. data could sharply reverse USD strength, causing a retracement or dump back below 145.000.
🔴 4. Overextended Short-Term Move
The steep rise could signal near-term exhaustion. RSI or other momentum indicators (not shown here) likely suggest overbought conditions, increasing the probability of a cool-off retracement.
🔴 5. Liquidity Grab & Drop Setup
Price might poke just above the box (to trigger stop losses and attract breakout traders), then reverse aggressively downward—a liquidity sweep or stop-hunt move before the real direction emerges.

Market next move Current Analysis Breakdown:
Pair: EUR/USD on a 1-hour timeframe.
Recent Action: Sharp decline with a small bullish reversal candle.
Assumption: A potential bounce or reversal targeting the area marked as "Target."
Volume: Increased during the decline and slightly bullish at the last candle.
Technical Area: The “Target” is set above the current price, implying a bullish move is expected.
---
Disrupting the Analysis:
Let’s introduce potential bearish or contrarian scenarios to question the bullish target assumption:
1. False Reversal / Dead Cat Bounce
The small green candle after a strong red volume drop could simply be a temporary retracement or a dead cat bounce—a short-lived recovery before the price resumes falling.
2. Volume Analysis Contradiction
While volume has increased, the spike occurred mostly during red candles (bearish). This indicates strong selling pressure, not accumulation. The green candle’s volume is relatively small, suggesting weak buyer interest.

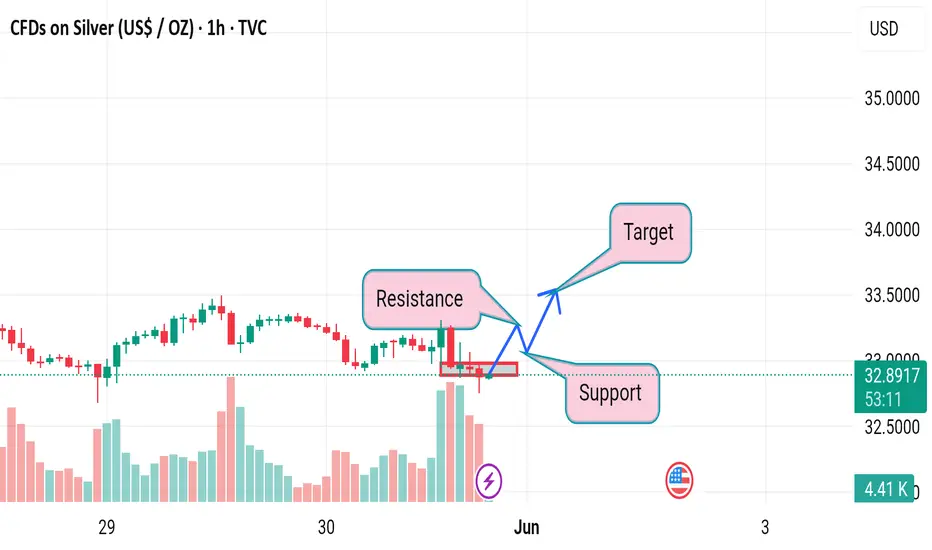
Market next move 🚨 Disruptive Take on the Current Silver-CFD Setup (1 h)
⚠️ Key Issue Why It Undermines the Long-Target Thesis
1. Target looks “wishful” The arrow projects a move into the 33.55–33.60 zone without price ever clearing the nearest resistance band around 33.30–33.35. A premature target can bait traders into chasing the tail end of a relief rally.
2. Volume doesn’t back the bounce Notice how the big green climb out of the pit on the 27 th started on strong volume, but the last 10–12 candles show shrinking green bars. Demand is decaying as price inches higher—a classic recipe for a bull trap.
3. Momentum is stalling The most recent candle printed red right at the dotted mid-line, hinting at exhaustion. Without a fresh momentum kick (e.g., higher high ➜ bullish engulfing), upside continuation is statistically fragile.
4. Structure still favors lower highs The broader pattern since the 25–26 th is a series of lower swing-highs. Until that diagonal is broken decisively, every uptick remains a counter-trend bounce, not a new up-trend.
5. Macro landmine ahead The U.S. flag icon marks an impending data release. Silver’s intraday volatility tends to spike on USD events; any dollar strength could instantly unwind the thin-volume rise. Trading into news with no contingency ≠ smart risk.
6. Stop-loss placement is unclear Without a clearly defined invalidation level (e.g., below 33.00 or under the 27 th swing-low), the R-R profile is lopsided: limited upside room vs. plenty of air underneath.

Market next move 🚨 Disruption Analysis of the Gold CFD Chart
1. Over-Optimistic Target Placement
The target is placed significantly above the current market trend without substantial confirmation of a reversal.
The recent bullish candles are weak and not supported by volume spikes.
There's a bearish engulfing pattern forming, suggesting a possible continuation of the downtrend.
2. Weak Volume Confirmation
The rise in price does not coincide with a strong increase in buying volume.
Volume bars are mixed and not clearly favoring buyers, indicating market indecision rather than strength.
3. False Bottom Assumption
The assumption that the market has bottomed on the 27th is speculative.
Without a double-bottom pattern or significant bullish divergence on an RSI/MACD (not shown here), the upward bias is unjustified.
4. Price Action Breakdown
Lower highs and lower lows are still visible.
The short bounce could be a retracement rather than a trend reversal.
5. Macro or Fundamental Events Ignored
Given the presence of the US flag icon (economic event), any upcoming data release (like GDP, interest rates, etc.) could drastically alter market direction.
Trading before news without adjusting targets and stops is risky.

Market next move
1. Misleading Bullish Label
Issue: The chart marks the latest price action as "Bullish" based on a short-term recovery.
Disruption: This could be a dead-cat bounce — a temporary recovery in a downtrend. The overall trend from the prior candles is bearish, and a few green candles don’t confirm a reversal without volume or structural confirmation.
---
2. Volume Analysis Ignored
Issue: The volume spike accompanying the recent green candles is not fully analyzed.
Disruption: Although there's higher volume, it could be short covering or a reaction to news, not organic buying interest. No volume divergence or institutional footprint confirmation is given.
---
3. No Confirmation Pattern
Issue: No mention of chart patterns (e.g., double bottom, inverse head and shoulders, etc.).
Disruption: Calling it “bullish” without a clear technical pattern or confirmation (like a break of resistance or retest) is speculative.
---
4. Vague Target
Issue: The “Target” is labeled without specifics.
Disruption: There's no price level, Fibonacci retracement, or resistance level justification. A target without rationale lacks credibility.
---
5. No Risk Management
Issue: No stop-loss or risk level is discussed.
Disruption: Without defined risk-reward ratio, the analysis is incomplete and not tradable. Every strategy needs downside planning.

Market next target Disruption of the Analysis
1. Weak Confirmation of Reversal: The chart shows a possible target zone after a recent small bullish move, but the candlestick reversal pattern is weak and lacks a strong confirmation candle. Without a bullish engulfing or a high-volume breakout, this “Target” may be premature.
2. Downtrend Momentum Intact: Despite the slight bounce, the broader trend remains bearish (visible by the previous lower lows and lower highs). No trendline break or structural shift supports a move toward the target.
3. Volume Does Not Support Breakout: Although there is a small spike in green volume, it does not exceed previous bearish volume, which suggests that buyers are not yet in control.
4. Over-reliance on Visual Targeting: The “Target” label appears to be placed based on a subjective expectation, not on a clear technical structure like a resistance level, Fibonacci retracement, or moving average. This makes it speculative.
5. Lack of Indicator Confluence: There are no visible indicators (like RSI, MACD, or EMA crossovers) shown to justify a reversal. Trading solely on price action without confirmation from indicators reduces reliability.
