Market next target
Original Analysis Summary:
Identifies a bullish breakout above a support zone.
Expects continuation upward to a target zone after minor pullback.
Assumes support holds and bullish trend continues.
---
Disruptive Bearish Interpretation:
1. Fakeout Risk (Bull Trap):
Price broke above the support area, but this could be a false breakout designed to lure in long positions before a reversal.
2. Trendline Retest Failure:
The price is testing a trendline or resistance zone. Failure to break above this area could indicate rejection and reversal.
3. Bearish Divergence:
If momentum indicators (e.g., RSI or MACD, not shown here but inferred) show divergence, it may warn of weakening bullish strength despite price rising.
4. Candlestick Exhaustion:
Recent candles show upper wicks and slowing momentum — a common sign of potential exhaustion.
Forexsignal

Market next target Original Analysis Summary:
Support Area marked: Price bounced from this level.
Bullish Target: Expectation is for the price to rise after retesting support.
Arrows: Indicate potential bullish continuation (yellow) or slight drop before rising (blue).
---
Disruption / Counter Analysis:
1. Weak Volume Support:
Volume in the support area is not significantly higher, which can indicate weak buying interest. This weakens the case for a strong bounce upward.
2. Double Top Risk:
The chart could be forming a double top pattern near the 33.60–33.80 region. If price fails to break above, a bearish reversal might occur.
3. Bearish Divergence:
If RSI or MACD (not shown but assumed) indicates bearish divergence, upward momentum may not sustain.
4. Support Could Break:
If the support area is tested too many times (as appears here), it may eventually fail, causing a sharp drop to the next demand zone, possibly near 33.00 or lower.
5. Macro Uncertainty:
News events (e.g., U.S. economic data or interest rate news) can abruptly reverse expected trends regardless of technical setups.

Week of 5/25/25: AU AnalysisBullish previous week leads for my bias being bullish this week as well until price reaches the next Daily supply zone which we will look to trade the pullback.
Thanks for stopping by goodluck this week!
Major news:
PMI - Thursday

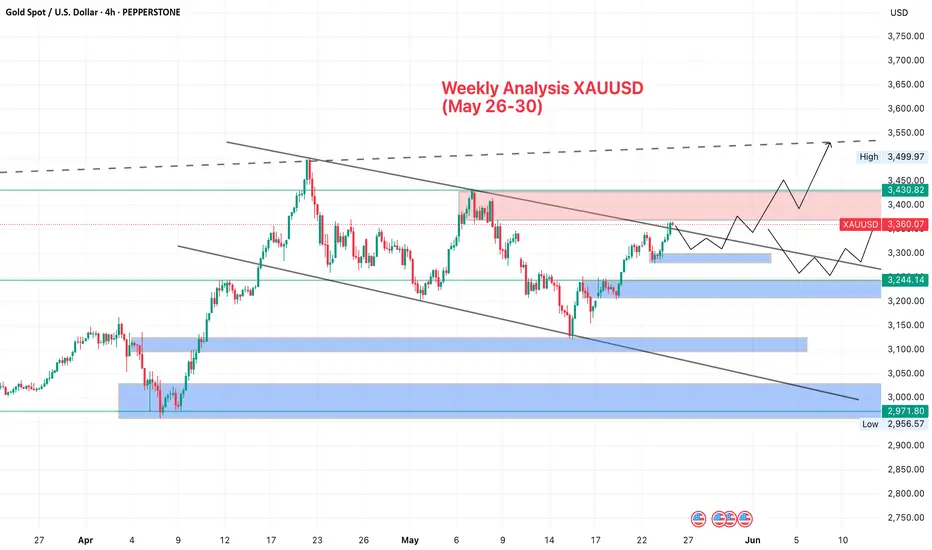
Weekly Analysis For XAUUSD (stress free trading) Weekly Analysis for Goldie (May 26–30)
From last week's analysis, we’re still on track and the move was fueled by news as expected. (just following Technical levels)
Gold broke the trendline clean and retested it, with structure still holding bullish. Price rejected around 3365, which aligns with the 4H fib (23%) and a minor supply zone. volume faded on Friday due to the early US close and the long weekend.
Powell’s speech is set for early Monday before the market opens. If he leans dovish or hints at rate cuts, gold could break above 3371 and push toward 3430 or even 3498. But if he stays hawkish, we might get another rejection at 3365 and a pullback to 3330 or even 3292 though the bullish bias remains intact unless 3244 breaks.
On the macro side, US/EU tariffs kicking in June 1 ongoing (but still unresolved) Iran talks, Trumps new tax bill adding more debt, and the Moody’s downgrade of the US credit outlook all lean toward further upside for gold. COT data also shows instiution still holding strong net long positions in gold.
⭐️ Expect low NY session volume on monday due to the US holiday. Key zones to watch 3371 for breakout continuation, 3330 and 3292 for pullback buys, and 3365 for short-term scalp rejections. Overall bias remains bullish with strong structure and macro confluence.
GBP/AUD Forex Heist - Bearish Breakout Blitz!🔥 Thief Trading Style: GBP/AUD Bearish Heist Plan 🔥
Hello, Profit Pirates & Market Marauders! 🤑
Get ready to raid the GBP/AUD (Pound vs. Aussie) forex market with a slick bearish strategy! 📊 Our Thief Trading Style fuses technical precision and fundamental insights to target a sharp downside move. Follow this charted plan to hit the high-risk Blue MA Zone and slip away with profits. Let’s make this heist count! 💪🎯
---
📊 Heist Blueprint: Trade Setup
- Market: GBP/AUD (Forex) 🌐
- Bias: Bearish Breakout 🌟
- Timeframe: 4H (Scalping/Day Trade) ⏰
Entry 📉:
- Breakout Move: Wait for a confirmed break below the Neutral Level at 2.05300. Place Sell Stop orders just below 2.05300 to ride the bearish wave. 🚀
- Pullback Play: For safer entries, set Sell Limit orders at the nearest 15M/30M swing high (e.g., 2.05600-2.05800) after a support break for pullback trades. 📍
- Trader Tip: Set a TradingView alert for the 2.05300 breakout to catch the action live! 🔔
Stop Loss 🛑:
- Breakout Traders: After the break confirms, place your Stop Loss above the recent 4H swing high at 2.08000 to shield against reversals. ⚠️
- Pullback Traders: Adjust Stop Loss based on your risk (e.g., 1-2% of account). Factor in lot size and multiple orders for precision. 📏
- Risk Alert: This is a high-octane heist! Keep position sizes tight to protect your capital. 🔥
Target 🎯:
- Aim for 2.03200, near the risky Blue MA Zone (an oversold area with potential consolidation or reversal). 🏴☠️
- Exit Strategy: Take profits early if bullish signals (e.g., pin bars, high volume) appear near 2.03200. 💸
Scalpers 👀:
- Focus on short-side scalps with tight trailing stops. Pair with day traders for the full heist or snag quick pips if your account supports it. 💰
---
📡 Why This Heist Could Pay Off
GBP/AUD is showing bearish momentum, fueled by:
- Technicals: A break below 2.05300, backed by lower highs on the 4H chart, signals strong downside potential. 📊
- Fundamentals: Weak UK economic data and Aussie strength (check COT reports) support a bearish outlook. 📰
- Seasonal Trends: GBP/AUD often softens in Q2 due to macroeconomic shifts. 📅
- Intermarket Factors: AUD’s correlation with commodity prices could pressure GBP lower. 🌎
---
⚠️ Risk Management: Guard Your Loot
- News Caution: Avoid new trades during high-impact events (e.g., UK CPI, RBA minutes) to sidestep volatility spikes. 🗞️
- Trailing Stops: Use trailing Stop Loss to secure profits as price approaches 2.03200. 🔒
- Position Sizing: Cap risk at 1-2% of your account per trade to stay in the game. 🚨
---
💥 Fuel the Heist! 💥
Join our Thief Trading Style crew by liking, commenting, and following for more electrifying trade plans! 🚀 Your support powers our market raids, helping us score profits with flair. Let’s dominate GBP/AUD together! 🤝🏆🎉
Hashtags: #GBPAUD #Forex #Bearish #DayTrading #Scalping #Breakout
Stay Alert: Another heist is brewing. Keep your charts primed, traders! 🐱👤😎

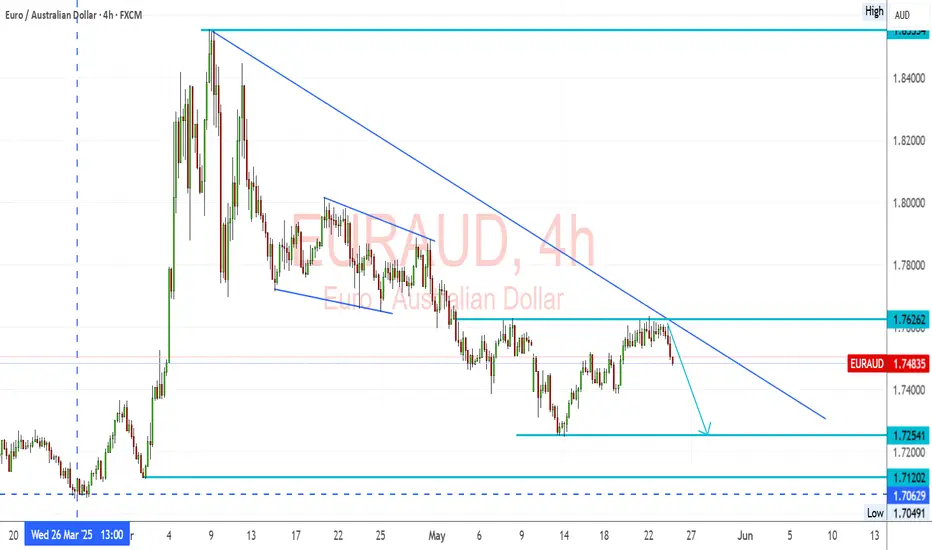
EURAUD – Trendline Holds, Bearish Setup Below 1.7626EURAUD Trend: EURAUD pair remains in a strong downtrend, marked by consistent lower highs and a descending trendline.
Resistance: 1.7626 has been retested and rejected, confirming it as a short-term ceiling.
Structure: The latest rejection from both horizontal resistance and the trendline confirms bearish intent.
🔽 Bearish Targets:
1.7254 – minor support and near-term target
1.7120 – stronger support zone
1.7060 – previous low and potential extended target
A clear break below 1.7400 could confirm continuation of the trend toward those levels.
Fundamental Overview:
🔻 EUR Weakness:
The Eurozone is slowing, particularly in Germany and France.
ECB remains cautious; recent comments show concern about tight financial conditions and sticky inflation.
Political uncertainties and mixed data prints are adding pressure.
🟢 AUD Support:
The RBA remains firm with hawkish language, holding rates while global peers lean dovish.
Commodities remain stable, and Australia benefits from demand out of Asia.
Domestic data (jobs and retail) shows surprising resilience.
Summary:
Bias: Bearish below 1.7626
Break Trigger: 1.7400
Target Range: 1.7250 – 1.7060
Fundamentals: Favor AUD on stronger economic footing and RBA policy tone
📉 EURAUD looks ready for another leg lower unless we see a breakout above 1.7630 with conviction.
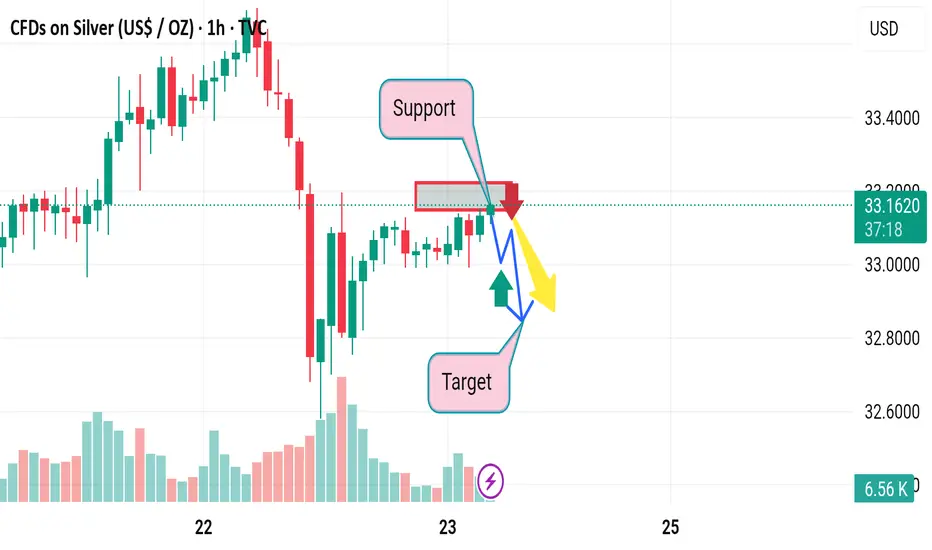
Market next target 1. Mislabeling of Support Area
The red box is labeled as a support area, but price is approaching from below, not above—so technically, this should be called a resistance area.
Until price closes above it with volume, it cannot be assumed to act as support.
---
2. Volume Misinterpretation
The volume does not strongly support a breakout. The latest green bars are not significantly larger than prior volume, implying limited bullish conviction.
Lack of volume surge through resistance is often a false breakout indicator.
---
3. Single Scenario Bias
The analysis shows only an upside (bullish) projection, ignoring bearish possibilities.
If price gets rejected from resistance, there’s a strong chance of a pullback to $33.00 or lower, especially with weak momentum.
---
4. No Confirmation Indicators
The chart lacks confirming technical indicators like RSI, MACD, or trendlines to validate the bullish scenario.
Price could be forming a lower high, indicating a possible continuation of the downtrend.

Market next target
1. Misinterpretation of Support Area
Claimed support area has already been broken previously (left of the red box), so it's no longer strong support—it might be better viewed as resistance now.
The bounce from this zone could be a liquidity trap or a fakeout, rather than genuine buying interest.
---
2. Overreliance on a Single Target Zone
The chart implies a clear target zone below, but no Fibonacci, moving average, or volume profile is shown to validate this zone.
A better analysis might include additional tools (like RSI, Bollinger Bands, or Fibonacci levels) to confirm this as a realistic target.
---
3. Volume Analysis Oversight
There is a volume spike on the most recent bullish candles, which could indicate strong buying interest, contradicting the downtrend expectation.
This might suggest a potential breakout above resistance instead of a fall.
---
4. No Risk Management Consideration
The chart lacks stop-loss levels or invalidation points, which is crucial for trading strategies.
Without a clear invalidation, the trade idea becomes more speculative.
---
5. Alternative Scenario Missing
A bullish breakout scenario (above resistance zone) isn’t given enough weight.
Given the recent strength, there is a strong case for continuation upward if the price closes above the red box with volume.
Market next move Current Analysis Summary:
Bullish Outlook: The chart suggests a bullish trend after price moves above a marked support area.
Price Scenarios:
Red arrow: Pullback to support.
Blue arrow: Bounce back upward.
Yellow arrow: Continuation of the bullish trend.
---
Disruption of the Analysis:
1. False Breakout Risk:
The move above the support zone might be a false breakout. Volume does not appear significantly increased during the breakout, which is typically needed to confirm real breakout momentum.
2. Volume Confirmation Lacking:
Although some volume is present, the breakout does not show a clear volume spike to validate strong buying interest, which challenges the bullish bias.
3. Resistance Overhead Ignored:
No mention of overhead resistance. The price may face selling pressure near 1.35000, a likely psychological and technical resistance area.
4. Over-reliance on Simple Support Zone:
The support zone is too narrowly defined. If the price dips below it slightly, it could still be a healthy retest, not a reversal, which the red arrow path implies prematurely.

Market next move Original Analysis Summary:
Price has entered a support area and is expected to bounce.
Two possible bullish paths (blue & yellow arrows) suggest a continuation toward the marked target zone.
---
Disruption Thesis: Bearish Reversal Setup
1. Overextended Rally Into Resistance
The move up into the “support area” is sharp and fast, suggesting it's a liquidity grab.
This zone might actually be a supply zone, where smart money is offloading.
Disruption Call: Price could stall or reverse sharply from this area due to lack of follow-through volume.
---
2. Volume Profile Weakness
Volume peaked earlier in the rally and is now diminishing, which often signals buyer exhaustion.
Disruption Call: Fading bullish momentum implies a fakeout, not a breakout.
---
3. False Breakout / Bull Trap
The green arrow assumes a bounce, but price may just be hovering to bait longs before dropping.
Previous swing highs near 1.1320 may act as a strong rejection point.
Disruption Call: A sudden drop below 1.1300, with a new bearish wave back to 1.1250 or lower.

Market next move Original Analysis Recap:
Support Zone marked just below the current price.
Bearish Move Expected (red arrow) from current resistance.
Bullish Bounce Expected after initial drop (blue and yellow arrows).
Target is placed lower than current price, implying expected downward movement.
---
Disruption / Contrarian Thesis:
1. Fakeout to the Downside (Bear Trap)
The analysis assumes a rejection at resistance and a drop, but:
After the large red candle previously, the market may have absorbed all selling pressure.
Current consolidation shows higher lows—suggesting hidden buying.
Disruption Call: A quick dip below support (triggering stops), followed by a strong bullish reversal breaking through the resistance zone.
---
2. Volume Insight Ignored
Note that recent volume spiked on green candles during recovery.
Current retracement has lower volume, suggesting it may be a pause in uptrend (not a reversal).
Disruption Call: This is accumulation, not distribution. A breakout above 33.20 could happen, aiming for 33.40 or higher.
---
3. Structural Misinterpretation
The “support” identified may not be valid—it’s part of the consolidation range.
True demand zone could be deeper, around 32.90–33.00.
EUR USD Entry Setup 1 hour timeframe EUR USD Entry Setup 1 hour timeframe
Trade Setup: Bullish break and retest
Additional Confluence: Fib Retracement Level👌🏻⬆️

Market next move
1. Support Zone Validation
Observation: Price is reacting from a labeled “Support area.”
Disruption: The support zone is based on very recent price action with limited prior structure. No confirmed double bottom, bullish engulfing, or strong rejection candle is present to confirm it as strong support yet.
---
2. Volume Context Ignored
Observation: Volume has declined during recent candles.
Disruption: A genuine reversal from support typically comes with a volume spike. The current volume profile shows weakening participation, which questions the strength of the bounce.
---
3. Premature Long Target Projection
Observation: A bullish arrow targets the 1.134–1.135 zone.
Disruption: This target is overly optimistic given the lack of a trend change signal. Price is still in a clear lower-high and lower-low structure, suggesting bearish momentum remains intact unless a breakout above 1.1300 occurs.
---
4. Bearish Scenario Underdeveloped
Observation: Only a single red arrow shows bearish rejection.
Disruption: There is no defined breakdown zone or bearish continuation pattern shown (e.g., flag or wedge). If support breaks, price could rapidly move to 1.1200, but this scenario is underrepresented.
---
5. No Confirmation Candlestick for Bullish Entry
Observation: A bullish move is anticipated from current levels.
Disruption: The current candle structure does not confirm bullish control—no hammer, engulfing, or clear reversal pattern. Entering long here could be premature without that confirmation.
---
6. Lack of EMA or RSI Confluence
Observation: Analysis is purely price-action based.
Disruption: No exponential moving averages (EMAs) or RSI are shown to validate trend change. These tools could help confirm divergence or trend reversal.

Flying upward 1. Assumption of Support
Observation: The "Support" zone is marked around the 3,285–3,290 level.
Disruption: This area has only a few touches and lacks clear validation. Support should be confirmed with multiple bounces and strong volume reactions. Here, volume is present but inconclusive.
2. Overly Optimistic Target
Observation: The target area is set around 3,350, which assumes a clean breakout.
Disruption: This ignores potential resistance levels between 3,310–3,330 that could act as hurdles. The price might stall or reverse before reaching that far.
3. Breakout Path Assumptions
Observation: The blue arrows suggest a bullish breakout, possibly after a retest.
Disruption: There's a strong red rejection candle marked by a red arrow—suggesting bearish momentum. Without strong bullish confirmation (like a bullish engulfing or volume spike), this breakout path is speculative.
4. Lack of Broader Context
Observation: The chart is isolated to a 1-hour timeframe.
Disruption: No higher timeframe trend is considered. If the 4H or Daily chart shows a downtrend, this small support could be insignificant and might break.
5. Volume Analysis Gaps
Observation: Volume bars are visible but not integrated into the analysis.
Disruption: No divergence or volume support is identified. Rising prices without rising volume can indicate a weak move, increasing failure chances.

GBPUSD Short-Term Top Forming Target 1.3360GBPUSD has bounced slightly, but the structure remains heavy and indecisive. However, EURUSD and Gold 4H charts are starting to break down clearly.
EURUSD is dragging lower step by step.
Gold broke a key support zone.
Both are signaling that USD strength is returning — and GBPUSD is likely to follow.
🔍 Technical View
Price rejected from the 1.3465–1.3470 zone (FOMC CPI high)
Lower highs building on the 1H and 4H timeframes
Trading below the 50% retracement of the recent CPI rally
🧠 Key Observation
“A sharp drop on EURUSD from current price will confirm a top is in place on GBPUSD.”
If EURUSD breaks 1.1270 decisively, expect GBPUSD to follow with increased momentum.
🔽 Trade Bias
Bearish below 1.3435
Targets:
1.3360 (first fib cluster + liquidity pocket)
1.3330 (full wave completion)
Invalidation: Clear close above 1.3470
⚠️ Watch for:
U.S. PMI revisions or FOMC speakers to fuel USD move
GBP Retail Sales data tomorrow — potential catalyst

EURUSD Pullback in Play – Next Stop: $1.1337EURUSD ( FX:EURUSD ) is moving in the Resistance zone($1.1310-$1.1162) while the upper line of the descending channel has been broken.
According to Elliott Wave theory , a breakout of the descending channel can at least confirm the end of a corrective wave . The corrective wave structure was a Double Three Correction(WXY) .
I expect EURUSD to rise to at least $1.1337 after completing a pullback to the upper line of the descending channel .
Note: If EURUSD touches $1.11590, we can expect further declines.
Please respect each other's ideas and express them politely if you agree or disagree.
Euro/U.S. Dollar Analyze (EURUSD), 4-hour time frame.
Be sure to follow the updated ideas.
Do not forget to put a Stop loss for your positions (For every position you want to open).
Please follow your strategy and updates; this is just my Idea, and I will gladly see your ideas in this post.
Please do not forget the ✅' like '✅ button 🙏😊 & Share it with your friends; thanks, and Trade safe.

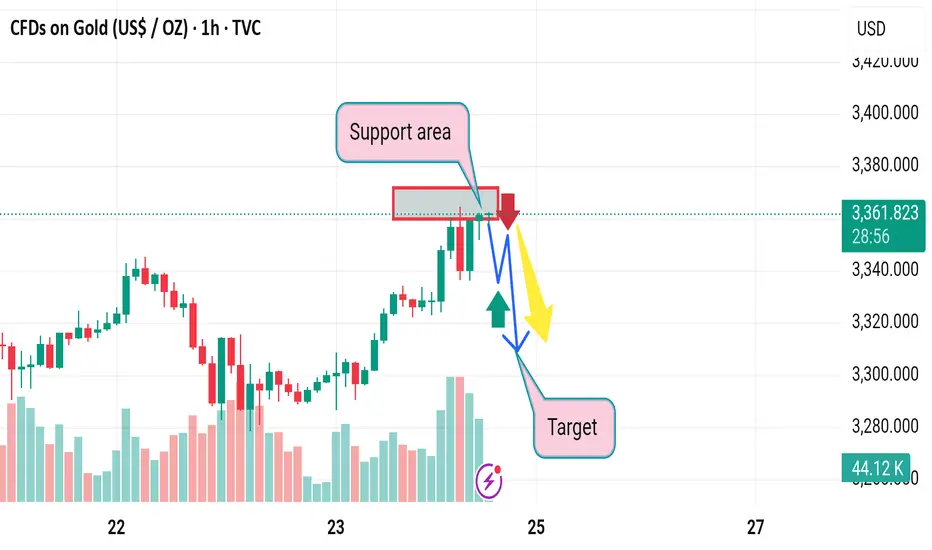
Market fall down 1. Weak Bearish Confirmation
Issue: The red arrow implies a confirmed downtrend, but the price action doesn’t show a strong breakdown—just a slight dip through a thin support zone.
Disruption: Without strong bearish candles or volume spikes, the breakdown could be a false move or liquidity grab before a reversal.
---
2. Overconfidence in Double Bottom Reversal
Issue: The blue “W” pattern and green arrow suggest a possible double bottom, but no clear second bottom has formed yet.
Disruption: Assuming a reversal prematurely is risky. The price may continue dropping, invalidating the bullish reversal scenario.
---
3. Target Placement Is Vague
Issue: The "Target" is placed arbitrarily along a horizontal line without referencing key resistance levels or technical confluences.
Disruption: Without support from Fibonacci, previous highs, or indicators, the target lacks reliability and could mislead trade planning.
---
4. Lack of Volume Context
Issue: The volume histogram shows a spike during a previous down move, but no current volume analysis is integrated into the decision.
Disruption: Price action alone, especially on lower timeframes, is insufficient without volume confirmation to validate breakouts or breakdowns.
---
5. No Risk Management Displayed
Issue: The analysis includes bullish and bearish paths but omits stop-loss levels or invalidation zones.
Disruption: Without clear invalidation, the trade becomes ambiguous and exposes the trader to unnecessary risk if price deviates unexpectedly.

Market next target
Disruption: Bearish Counter-Analysis
1. Rising Wedge Pattern:
The price action resembles a rising wedge, not a bullish channel.
Rising wedges are typically bearish reversal patterns, especially after strong prior bullish moves.
2. Decreasing Volume:
Volume is tapering off as price climbs, which often signals weakening buying pressure.
Lack of strong volume near resistance suggests potential fake-out risk.
3. Bearish Divergence Risk:
Not visible here, but on RSI or MACD, rising price with slowing momentum often triggers bearish divergence.
This could suggest an imminent drop.
4. False Breakout Trap:
The highlighted resistance zone could trap late buyers.
A fake breakout followed by a strong red candle could trigger stop-loss hunts, dragging price sharply lower.
5. Macro Event Warning:
The U.S. flag at the bottom suggests high-impact news is due.
If USD strengthens, GBP/USD may reject the resistance and drop fast, invalidating the long setup.

Market next move Disruption (Bearish/Contrarian Outlook):
1. Bearish Divergence:
If RSI or MACD (not shown) is diverging (price making higher highs, indicator making lower highs), this could signal weakness in the uptrend.
2. Rising Wedge Pattern:
The channel might be interpreted as a rising wedge, which is often a bearish reversal pattern, especially if volume declines as price rises.
3. Strong Resistance Zone:
The red rectangular zone could act as major resistance, potentially causing a false breakout or rejection rather than continuation.
4. Volume Discrepancy:
Despite the bullish move, if volume is not increasing proportionally, it might indicate a lack of conviction.
5. Potential Breakdown Path:
Price breaks below the support zone (blue trendline).
Falls to test the previous consolidation zone around $3,300 or lower.
Bearish Scenario Path (Disrupted View):
Red arrow moves sharply down through support.
New target: $3,300 or lower (next visible support).

Market next move . False Breakout Risk (Bull Trap)
While the chart suggests an impending breakout, the market may be setting a bull trap:
Watch for a brief move above the consolidation zone that quickly reverses.
This could lure in buyers before a sharp downturn.
2. Volume Analysis Contradiction
Volume in the consolidation box seems to be decreasing.
A strong breakout typically needs a volume surge, which is currently absent.
Lack of commitment from buyers might suggest indecision or exhaustion.
3. Bearish Divergence Possibility
If you overlay an RSI or MACD indicator:
It might show bearish divergence (price making higher highs, indicator making lower highs).
This often precedes reversals.
4. Key Resistance Ahead
The area just above the consolidation box (around 3,320–3,340) could act as strong resistance based on historical price action.
Price might reject this zone rather than continue higher.
5. Fundamental Risks
Upcoming U.S. economic data (as hinted by the U.S. icon on the chart) may trigger unexpected volatility.
Hawkish Fed tone or strong dollar news could push gold down unexpectedly.

Market next move
Bearish Disruption to GBP/USD Analysis:
1. Support Weakness:
The price action within the red box shows multiple bearish candles, suggesting the zone is under pressure.
A break and close below this box could invalidate the bullish thesis.
2. Exhaustion Signals:
After a sharp rally, the market often consolidates or corrects. The current stall near 1.3400–1.3420 could indicate buying exhaustion.
The latest candle shows a strong bearish push into the support, hinting at potential for deeper decline.
3. Decreasing Volume:
Recent green candles had falling volume, which shows lack of conviction by buyers.
Meanwhile, red (bearish) candles show rising volume, signaling increased selling pressure.
4. Failed Breakout Setup:
If this bounce fails and price closes below 1.3380, this will form a false breakout or bull trap, triggering stop hunts and aggressive shorting.
5. Macroeconomic Headwinds:
GBP is sensitive to UK data and BoE policy. Any hawkish Fed or weak UK numbers may lead to a USD rebound, pushing GBP/USD lower.

Market next move
Bearish Disruption to the EUR/USD Analysis:
1. Strong Resistance Zone (Red Box):
Price is struggling to hold above the resistance area. Several candles have long upper wicks, signaling rejection and selling pressure.
This may form a double-top or even a bull trap.
2. Volume Anomaly:
The upward price move shows decreasing volume, which is a classic signal of weak momentum. Without increasing volume, breakouts often fail.
3. Overextended Rally:
The pair has already made a sharp move up from below 1.1300 to near 1.1340. This type of parabolic move can lead to a snapback correction.
If bulls cannot decisively break resistance soon, profit-taking may trigger a short-term retracement.
4. Bearish Divergence Potential:
If RSI or MACD indicators are available, watch for bearish divergence (price makes higher highs while indicators make lower highs). This would reinforce downside risk.
5. Fundamental Pressure:
If any upcoming U.S. economic data (like PMI, FOMC minutes, etc.) is strong, it could boost USD and push EUR/USD down from this resistance.

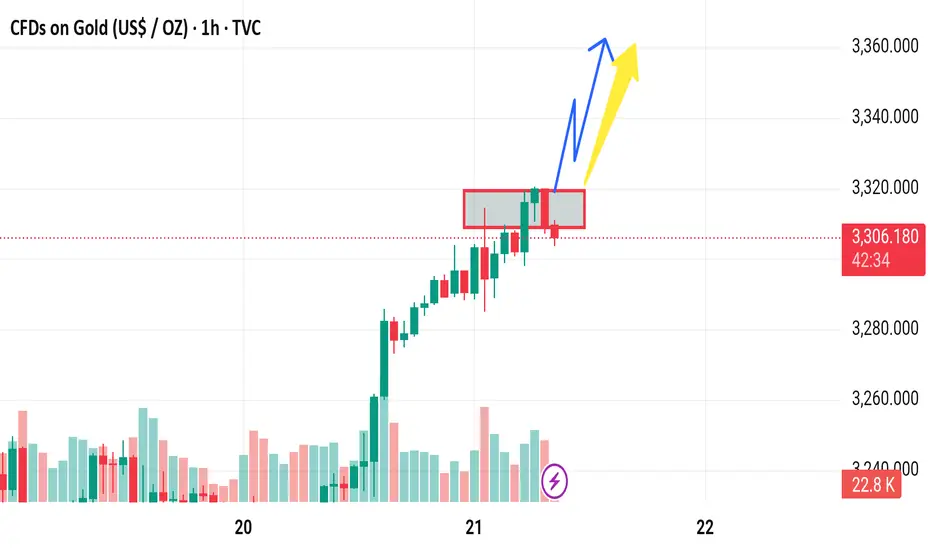
Market next move Bearish Disruption Analysis:
1. Weak Breakout Confirmation:
Although price broke above the red consolidation zone, it quickly pulled back within the range, suggesting a false breakout or bull trap.
The current red candle closing back into the range hints at bullish exhaustion.
2. Volume Divergence:
Note the declining volume on the recent upward push compared to the initial breakout on the 20th.
Lower volume during a breakout typically signals lack of conviction, weakening the bullish case.
3. Resistance Cluster:
The price is stalling just above the 3306 level — possibly facing resistance from previous highs or round-number psychological resistance.
Bears may take control if price fails to hold above 3300.
4. Potential Bearish Scenario:
Price re-enters the consolidation range and breaks below it.
Target zones could be:
3,290 (local support from the range base)
3,270 (previous minor support)
Further down toward 3,250 if momentum builds.