CADJPY - NEW BREAKOUT !Hello Traders !
The CADJPY price formed a descending channel.
Currently, The resistance line is broken !
So, I expect a bullish move🚀
_______________
TARGET: 105.390🎯
Forexsignals

CAD/JPY Bank Heist: Bullish Breakout (or) Bearish Trap?🌟 Hi! Hola! Ola! Bonjour! Hallo! Marhaba! 🌟
Dear Money Makers & Market Robbers, 🤑💰💸✈️
Based on the 🔥Thief Trading Style🔥, here’s our master plan to loot the CAD/JPY "Loonie-Yen" Forex Bank Heist! Follow the strategy on the chart—Long Entry is the play. Our escape? Near the high-risk Danger Resistance Zone. It’s a risky level—overbought, consolidating, potential reversal—where bearish robbers lurk. 🏆💸 Take profits fast, traders! You earned it! 💪🎉
📈 Entry: The Heist Begins!
Wait for the breakout above 105.700—then strike! Bullish profits await.
Buy Stop Orders above Moving Average OR
Buy Limit Orders (15-30min timeframe) near swing lows/highs for pullback entries.
📌 Set an ALERT! Don’t miss the breakout.
🛑 Stop Loss: Protect Your Loot!
🔊 Yo, listen up! 🗣️
Buy Stop Orders? Don’t set SL until after breakout.
Place SL at nearest/swing low (4H timeframe)—adjust based on your risk & lot size.
Rebels, set SL wherever… but don’t cry later! 🔥⚡
🎯 Target: 107.300
Scalpers: Only go LONG. Use trailing SL to lock in gains.
Swing Traders: Ride the wave or join late—robbery is teamwork! 🤝
💥 Why CAD/JPY? Bullish Momentum!
Fundamentals, COT Reports, Sentiment, Intermarket Trends—checkk our bio for full analysis. 🔗🔗🔗
⚠️ Trading Alert: News = Danger!
Avoid new trades during news.
Use trailing stops to protect profits.
💖 Support the Heist! Hit the BOOST Button!
More boosts = More robberies = More profits! 💰🚀
Stay tuned—next heist coming soon! �🤗🎉

Bearish reversal for the Aussie?AUD/USD is rising towards the resistance level which is a pullback resistance that lines up with the 38.2% Fibonacci retracement and could drop from this level to our take profit.
Entry: 0.6464
Why we like it:
There is a pullback resistance level that lines up with the 38.2% Fibonacci retracement.
Stop loss: 0.6499
Why we like it:
There is a pullback resistance level that is slightly below the 78.6% Fibonacci retracement.
Take profit: 0.6397
Why we like it:
There is a pullback support level.
Enjoying your TradingView experience? Review us!
Please be advised that the information presented on TradingView is provided to Vantage (‘Vantage Global Limited’, ‘we’) by a third-party provider (‘Everest Fortune Group’). Please be reminded that you are solely responsible for the trading decisions on your account. There is a very high degree of risk involved in trading. Any information and/or content is intended entirely for research, educational and informational purposes only and does not constitute investment or consultation advice or investment strategy. The information is not tailored to the investment needs of any specific person and therefore does not involve a consideration of any of the investment objectives, financial situation or needs of any viewer that may receive it. Kindly also note that past performance is not a reliable indicator of future results. Actual results may differ materially from those anticipated in forward-looking or past performance statements. We assume no liability as to the accuracy or completeness of any of the information and/or content provided herein and the Company cannot be held responsible for any omission, mistake nor for any loss or damage including without limitation to any loss of profit which may arise from reliance on any information supplied by Everest Fortune Group.

Technical Analysis on XAU/USD (Gold vs USD) – Bullish Reversal📊 Chart Overview:
This chart of XAU/USD (Gold) on a lower timeframe shows a potential bullish reversal setup. The price action has formed a series of lower highs and lower lows, but now a bullish momentum is building up, suggesting a possible breakout to the upside.
🔍 Key Observations:
🟠 Swing Points Identified:
The orange circles mark significant swing highs and lows, clearly outlining a recent downtrend.
The latest swing low (bottom-right) shows a strong rejection with a bullish engulfing candle forming, indicating buyer interest.
📦 Demand Zone (Support Area):
The grey rectangle near the lower region marks a demand zone where buyers have stepped in before.
Price has reacted strongly from this zone again, validating it as a key support level.
📉 Resistance Turned Potential Breakout Zone:
The red line (~3,291.416) represents a resistance level that was previously support.
Price has broken above it and now appears to be retesting it, indicating a possible retest-confirmation for a bullish continuation.
🎯 Target & Risk Management:
✅ Entry: Confirmed breakout and retest around 3,291.
📈 Target: 3,364.819 (green zone above), based on previous resistance.
❌ Stop Loss: Below 3,267.772, the recent swing low.
The setup offers a favorable risk-to-reward ratio.
🧭 Projection Path:
The white arrowed path illustrates a likely pullback before continuation upward, suggesting a bullish structure if confirmed.
✅ Conclusion:
Gold is showing signs of a bullish reversal from a well-defined demand zone, with a potential rally toward the 3,365 area. A successful retest of the broken resistance as new support would strengthen the bullish bias.
📌 Watch closely for confirmation candles on the retest before entering.

TON/USDT on Fire: Bullish Momentum Builds Toward Major Targets!By examining the #TONCOIN chart on the 3-day timeframe, we can see that after correcting down to $3, the price has started pumping again and is showing strong bullish momentum. So far, it has gained over 15%, and I expect this uptrend to continue! The next targets are $3.64, $4.20, and $4.66. The expected return is around 20% in the short term, 40% to 55% in the medium term, and 110% in the long term. Support this analysis and stay tuned for more updates, my friends!
Please support me with your likes and comments to motivate me to share more analysis with you and share your opinion about the possible trend of this chart with me !
Best Regards , Arman Shaban

Market next move 🔻 Disruption to Bullish Thesis
1. Resistance Zone Near Target
The "Target" area might align with a previous resistance level (historically where price has reversed or consolidated).
If price hits that zone, it could stall or reject, rather than break through.
2. Bearish Volume Divergence
While the candles are green and pushing upward, volume is not increasing significantly.
Lack of strong buying volume can suggest a weak rally — potentially a bull trap.
3. Trend Context: Larger Downtrend
The chart shows a strong prior downtrend before the recent small upward push.
This move could be a dead-cat bounce or retracement within a broader bearish move.
4. Fundamental Risk: USD Strength
If the US Dollar Index (DXY) strengthens due to macroeconomic data or Fed commentary, gold (USD-denominated) typically drops.
The calendar icons suggest upcoming US economic data, which could disrupt gold’s movement.
5. Candle Structure Shows Exhaustion
The current bullish candles are smaller compared to previous strong red ones.
This may imply momentum exhaustion before reaching the target.

USTECUSTEC price is near the resistance zone 21776-22139. If the price cannot break through the 22139 level, it is expected that the price will drop. Consider selling the red zone.
🔥Trading futures, forex, CFDs and stocks carries a risk of loss.
Please consider carefully whether such trading is suitable for you.
>>GooD Luck 😊
❤️ Like and subscribe to never miss a new idea!

NZD/USD – Bearish Reversal Expected Below 0.5990–0.5977 ResistanThe NZD/USD pair is approaching a key resistance zone at 0.5990–0.5977, which has been tested multiple times and aligns with the upper boundary of a potential corrective structure.
🔹 Elliott Wave Context:
The price action appears to be completing a corrective wave (C) structure, indicating that upside momentum may be limited.
This scenario suggests a potential bearish reversal from the resistance zone.
🔹 Targets & Levels:
Resistance: 0.5990–0.5977
First support target: 0.5885
Next major support: 0.5846
📌 Trading Plan:
Watching for bearish confirmation (rejection candlesticks or reversal pattern) below 0.5990–0.5977
Potential short entries targeting the support levels
A break above 0.5990 would invalidate the bearish setup and suggest continuation to the upside
This chart offers a clear bearish bias while price remains below the resistance zone, supported by Elliott Wave context and previous price action behavior.

XAUUSD TECHNICAL OUTLOOK 29-05-2025📣Gold Under Pressure XAUUSD CMP $3316.81
✅XAUUSD movement 29-05-2025: $3289-$3245-$3321 =$120 Movement Witnessed.
🔴Gold remains under pressure after a sharp turn from morning crash, which has triggered fresh volatility across commodities in USA session.
⏳ Despite safe-haven appeal, XAUUSD faces bullish momentum after a correction, driven by renewed appetite for risk assets and shifting market flows.
📉 Technical Outlook (1H):
• Bearish below $3305
• Next downside targets: $3280 → $3265 → $3250
• A break below $3255 could accelerate the decline toward $3240-$3220
🔁 Bullish Shift Trigger:
• A confirmed 1H close above $3319 may invalidate the bearish bias and target $3340+
📊 Key Levels:
• Pivot: $3305
• Support: $3280 – $3265 – $3250
• Resistance: $3327 – $3339 – $3351

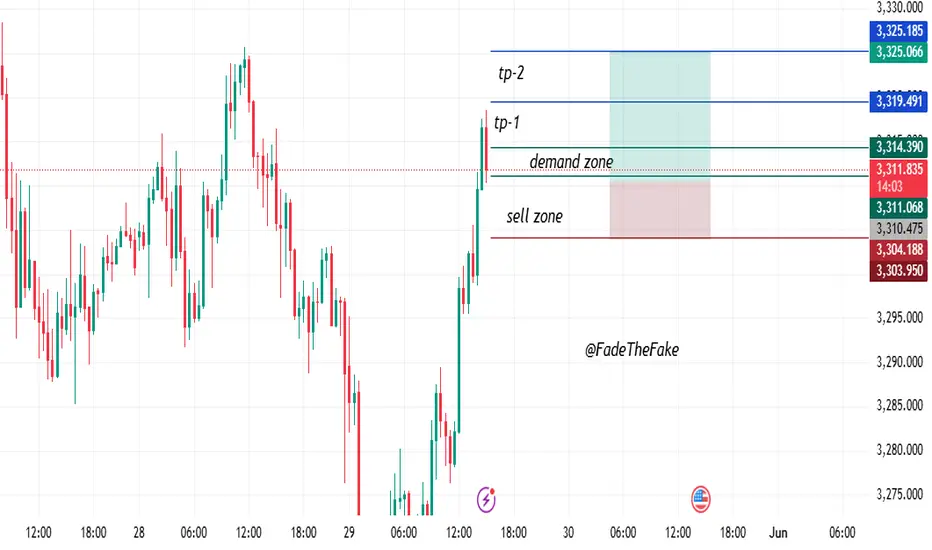
“Clean SMC Buy Setup | Retest & Rally from Demand Zone”This chart shows a clean Smart Money Concept (SMC) style buy-side setup, targeting a highly respected demand zone and high-odds liquidity grab above.
Following a steep bullish impulse, price formed a new market structure shift (BOS) and is now retracing into a crucial entry zone at 3,314.00 – 3,311.50. This area is marked by a hidden order block and imbalance, with high R:R opportunities for buyers.
The stop loss is judiciously set below the latest wick at 3,304.40, safeguarding against manipulation while having the best risk exposure.
The target one (TP1) is at 3,319.70, corresponding to intraday liquidity and recent supply reaction. The second target (TP2) goes up to 3,325.90, a major high where external liquidity would most likely be absorbed before any major change.
This is on the basis of:
A confirmed bullish BOS
Demand zone + OB alignment
Imbalance + inducement layer barely underneath the entry
No indication of bearish turn yet
We expect retest of demand and a move on to liquidity, given the zone is sustained and no bearish BOS is witnessed.
???? Trade Parameters:
Entry Zone: 3,314.00 – 3,311.50
SL: 3,304.40 (below OB)
TP1: 3,319.70
TP2: 3,325.90
Bias: Bullish (scalp-to-swing)
USD/JPY 1H Analysis – Channel Breakout and Buy SignalOverview:**
The USD/JPY chart shows a **bullish breakout from a descending channel**, supported by technical indicators like the Ichimoku Cloud and a strong demand zone. This setup suggests a potential bullish reversal and upward momentum.
*Key Technical Points:**
* **Descending Channel Breakout:**
Price action has broken out of a falling channel, indicating a shift in market sentiment from bearish to bullish.
* **Strong Support Zone:**
Around 143.28 – 143.73, the price found significant support, which aligns with a previous demand zone. This area held firm, helping trigger the breakout.
* **Ichimoku Cloud:**
Price is emerging above the Ichimoku Cloud, signaling a potential start of an uptrend. If the price maintains above the cloud, bullish momentum may strengthen.
* **Resistance Levels:**
* **First Resistance:** Near 146.00 – a critical area to watch for short-term profit-taking.
* **Second Resistance:** Around 148.00 – a more extended target if bullish continuation holds.
---
### **Trading Idea:**
**BUY USD/JPY** on successful retest of the breakout or sustained move above the Ichimoku Cloud.
* **Entry:** 144.30–144.40 zone
* **Target 1:** 146.00
* **Target 2:** 148.00
* **Stop Loss:** Below 143.20 (under the support zone)
---
Conclusion:**
The chart presents a classic **bullish channel breakout** supported by the Ichimoku indicator and price action at a strong support zone. As long as the price holds above the breakout level and Ichimoku Cloud, the upside targets at 146 and 148 remain valid.
Let me know if you want this formatted as a trade plan or journal entry.
To ensure you do not miss the upcoming analysis, be sure to follow me!
Please leave a remark and a like!

XAUUSD | 30M | SELL NOW Hello, everyone,
My gold target level is 3,250,0
My friends, every single like from you is my biggest motivation to share my analysis.
Thank you very much to everyone who supports me with likes.

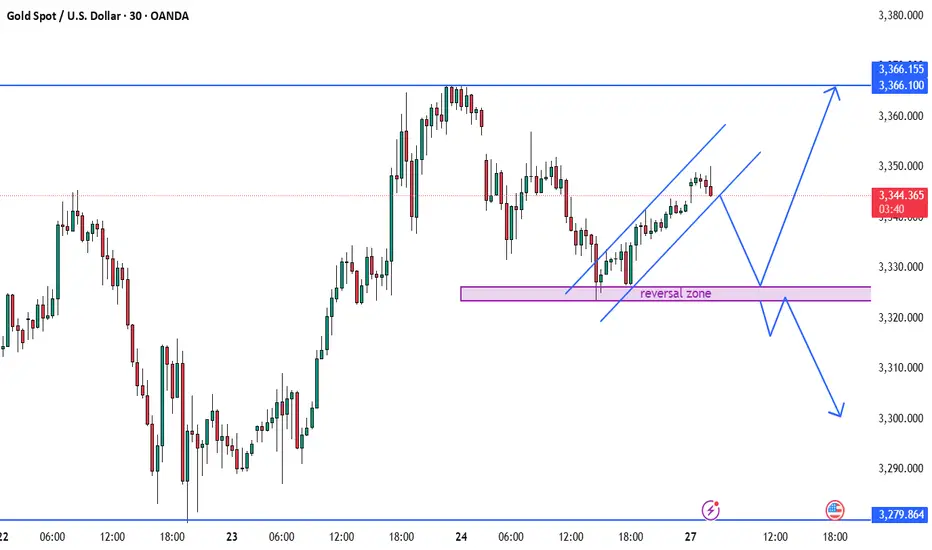
BEST XAUUSD M3 BUY AND SELL SETUP FOR TODAY 📊✨ Gold (XAU/USD) Technical Outlook – 30-Min Chart ✨📉
Price is currently trading within a rising channel after a bounce from the marked reversal zone 💜, suggesting a short-term bullish trend 📈. However, the chart outlines two key scenarios: if price breaks out upward, we may see a move towards the 3,366 resistance zone 🔼. Conversely, if the channel fails and price breaks downward, a retest of the reversal zone could trigger a deeper bearish move 📉, potentially targeting the 3,300 area or lower. Traders should watch for confirmation at key levels and react accordingly — not predict impulsively. 🧠⚖️📍
Bullish bounce off pullback support?CAD/JPY has bounced off the pivot, which has been identified as a pullback support that lines up with the 38.2% Fibonacci retracement and could rise to the 1st resistance.
Pivot: 104.26
1st Support: 103.24
1st Resistance: 106.19
Risk Warning:
Trading Forex and CFDs carries a high level of risk to your capital and you should only trade with money you can afford to lose. Trading Forex and CFDs may not be suitable for all investors, so please ensure that you fully understand the risks involved and seek independent advice if necessary.
Disclaimer:
The above opinions given constitute general market commentary, and do not constitute the opinion or advice of IC Markets or any form of personal or investment advice.
Any opinions, news, research, analyses, prices, other information, or links to third-party sites contained on this website are provided on an "as-is" basis, are intended only to be informative, is not an advice nor a recommendation, nor research, or a record of our trading prices, or an offer of, or solicitation for a transaction in any financial instrument and thus should not be treated as such. The information provided does not involve any specific investment objectives, financial situation and needs of any specific person who may receive it. Please be aware, that past performance is not a reliable indicator of future performance and/or results. Past Performance or Forward-looking scenarios based upon the reasonable beliefs of the third-party provider are not a guarantee of future performance. Actual results may differ materially from those anticipated in forward-looking or past performance statements. IC Markets makes no representation or warranty and assumes no liability as to the accuracy or completeness of the information provided, nor any loss arising from any investment based on a recommendation, forecast or any information supplied by any third-party.

Market next move 🚫 Disruption Points
1. No Clear Breakout Confirmation
Issue: The chart does not show a clear breakout of any recent highs or resistance levels.
Disruption: Without a break of a key level (like 1.3480–1.3500), the bullish target is premature.
2. Bearish Price Structure
Observation: The price has been making lower highs and lower lows over the last few candles.
Disruption: This may indicate a downtrend, not a setup for a bullish target.
3. Low Momentum
Issue: Volume appears to be declining, and recent bullish candles are smaller and weaker.
Disruption: The move toward the target may lack strength and could reverse without momentum.

Market next target 🔍 Original Analysis Summary
Resistance Zone: Around 1.1360
Support Zone: Same level after breakout (suggesting a breakout and retest pattern)
Target: Around 1.1450 after breakout
---
🚫 Disruption Points
1. False Breakout Risk
What could happen: Price might break the resistance briefly and then fall back below it.
Why: Lack of volume or confirmation, or a market maker trap to gather liquidity above the resistance zone.
Disruption: Instead of forming new support, it could become a bull trap leading to a sharp reversal.
2. Fundamental Risk
What could happen: Unexpected U.S. or Eurozone economic data (like NFP, CPI, or ECB/Fed announcements) may shift sentiment suddenly.
Why: The image shows upcoming news events (flag icons), which could induce volatility.
Disruption: The news might push EUR/USD sharply down even if a breakout occurs.
3. Bearish Divergence (if applicable)
What could happen: If RSI or MACD were included, they might show divergence while price is rising.
Why: Divergence typically precedes reversals.
Disruption: This would undermine the bullish breakout thesis.

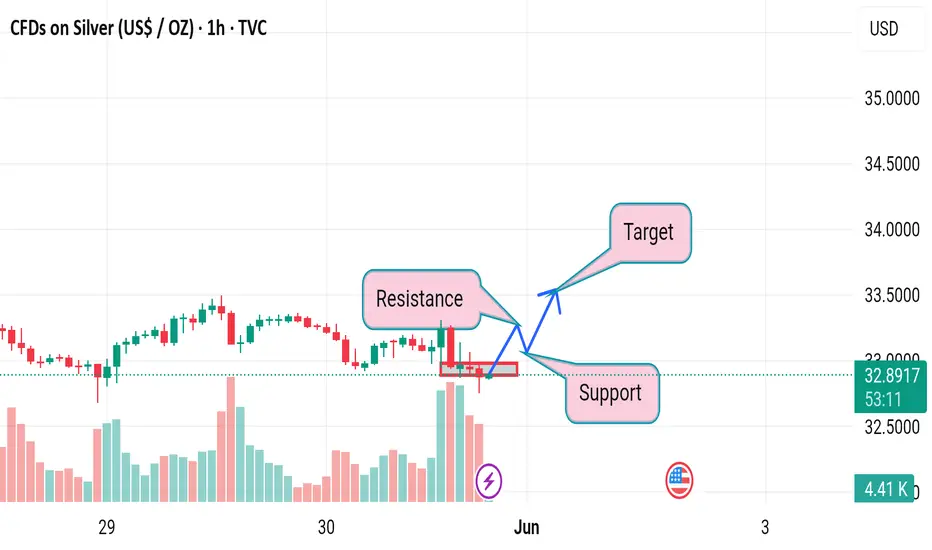
Market next move ⚠️ Disruption of the Bullish Silver Setup:
---
1. Misleading Support-Resistance Interpretation
The resistance zone highlighted is flat and overlapping with multiple wicks.
The support zone is not well-established; it's only tested once or twice with weak bounce reaction, which is not enough to consider it strong support.
---
2. Lack of Bullish Confirmation
The price is currently hovering around the support with no breakout candle or strong bullish engulfing pattern.
The recent candlesticks near resistance are small-bodied with long wicks, suggesting indecision or weakening buying power, not strength.
---
3. Volume Disagreement
There's no surge in bullish volume that would confirm buyers stepping in.
The large red volume bars toward the right indicate selling pressure dominating, which contradicts the bullish target.
Market next move 🔍 Disruption of the Bullish Setup on GOLD:
1. Range Market Ignored:
The price is moving sideways in a tight consolidation, indicating range-bound behavior rather than a breakout setup.
The chart projects a bullish move, but there's no confirmed breakout of the resistance zone yet.
2. Weak Resistance Zone:
The identified “resistance” zone is very narrow and lacks strong rejection wicks or significant bearish volume.
It's unclear if this is true resistance or just part of the ongoing chop.
3. Lack of Volume Confirmation:
Volume remains moderate and doesn’t show increasing buying pressure, which would be expected if bulls were preparing a breakout.
No signs of volume climax or absorption, which are typical before breakouts.
4. Premature Targeting:
The target area is placed far above the resistance zone without a measured move or pattern basis (e.g., no flag, no cup-and-handle, no inverse head and shoulders).
This could be misleading as it sets unrealistic expectations.

Market next move 🔍 Disruption of the Current Bearish Setup:
1. Mislabeling of Levels:
The chart labels a newly broken support as "Support" still, even though price has clearly broken below that zone.
In proper technical analysis, once support is broken, it often turns into resistance, so the labels should be reversed.
2. Premature Downside Projection:
The bearish arrow assumes continued downside immediately after the breakdown, but there’s no confirmation candle or retest yet.
This could easily be a false breakdown or a liquidity sweep below support before a bounce.
3. No Confirmation from Volume:
Volume spiked on the breakdown, but the follow-up candle doesn’t confirm seller continuation.
Absence of sustained volume makes the move questionable. It could be a trap for breakout traders.
4. Lack of Trend Context:
The chart doesn't consider the broader trend. If BTC was in a strong uptrend before this pullback, this could be a bullish retracement, not a true reversal.
Drawing a trendline or checking a higher timeframe would help validate the direction.

Market next move 🔍 Disruption/Critique of the Current Target Analysis:
1. Lack of Technical Justification:
The chart marks a “Target” level without referencing a clear technical basis (e.g., resistance, Fibonacci level, or moving average).
Without a corresponding pattern or indicator signal (e.g., breakout, double bottom, divergence), the target seems arbitrary.
2. Volume Spike Misinterpretation:
While there’s a volume spike in the last candle, it's accompanied by a bearish candle, suggesting potential selling pressure, not buying strength.
A bullish continuation would ideally require a green candle with increasing volume, which is absent here.
3. Market Context Ignored:
No consideration of broader market context such as macroeconomic news, DXY strength, or interest rate expectations which heavily impact GBP/USD.
The U.S. flag icon indicates upcoming news – trading before such events can be risky and invalidate the technical target.
4. Resistance Zone Overlooked:
The “Target” lies near the 1.3500 psychological level, which often acts as resistance. This isn’t discussed or marked.
Recent price action near that level shows rejection, making it a questionable target without strong buying confirmation

Pipping the Aussie-Swiss Bank: Day Trading Strategy UnleashedUltimate AUD/CHF Forex Heist Plan 🚨 Swing Trade Mastery for Epic Gains! 🚀
Greetings, Wealth Warriors & Market Mavericks! 👋💸
Get ready to execute a legendary heist on the AUD/CHF "Aussie vs Swissy" Forex market with our exclusive Thief Trading Style! 🎯 This meticulously crafted strategy blends technical precision and fundamental firepower to maximize your profits. Follow the plan outlined in the chart, focusing on a long entry to conquer the high-risk Yellow MA Zone—a battleground of overbought conditions, consolidation, and potential trend reversals where bearish bandits lurk. 🐻 Stay sharp, lock in profits, and trade safely! 💪🎉
Entry 📈: The heist begins! Watch for the MA pullback in the market maker’s trap zone (0.52200 OR above) to strike. Bullish riches await! Set buy stop orders above the Moving Average or place buy limit orders within the 15 or 30-minute timeframe’s recent swing low/high.
Pro tip: Set an alert to catch the breakout entry in action! 🔔
Stop Loss 🛑: Place your Thief SL at the recent swing low/high on the 4H timeframe for swing trades basis. Adjust SL based on your risk tolerance, lot size, and multiple orders.
Target 🎯: Aim for 0.54800 or make a swift exit before the target to secure your loot!
🧲 Scalpers, listen up! 👀 Stick to long-side scalps. Big players can jump in now; others, join the swing trade heist. Use a trailing SL to protect your stash. 💰
💵 AUD/CHF "Aussie vs Swissy" Forex Heist Plan (Swing Trade) is riding a bullish wave 🐂, fueled by critical market drivers. Dive into the fundamentals—Macro Economics, COT Reports, Quantitative Analysis, Intermarket Analysis, Sentiment Outlook, and Future Trends—before launching your heist. Check the linkKs for the full scoop! 🔗👉
📌 Markets move fast, so stay vigilant and adapt your analysis to the latest developments.
⚠️ Trading Alert: News & Position Management 📰🚨
News releases can shake up prices and volatility. Protect your positions by:
Avoiding new trades during news events
Using trailing stop-loss orders to lock in gains
💖 Boost our heist plan! 💥 Hit the Boost Button to supercharge our team’s strength and make stealing profits a breeze. With the Thief Trading Style, you’ll conquer the market daily with ease! 🏆🤝🎉
Stay tuned for the next epic heist plan, Money Makers! 🤑🐱👤🚀

EURGBP forex swing trade playing out off weekly demand levelThe EURGBP forex swing trade playing out off weekly demand level as expected. I hope you are taking advantage of this investment opportunity. There is a lot of profit for margin for this Forex cross pair.

Bearish reversal off pullback resistance?The Kiwi (NZD/USD) is rising towards the pivot, which has been identified as a pullback resistance and could reverse to the 1st support, which is also a pullback support.
Pivot: 0.6024
1st Support: 0.5846
1st Resistance: 0.6131
Risk Warning:
Trading Forex and CFDs carries a high level of risk to your capital and you should only trade with money you can afford to lose. Trading Forex and CFDs may not be suitable for all investors, so please ensure that you fully understand the risks involved and seek independent advice if necessary.
Disclaimer:
The above opinions given constitute general market commentary, and do not constitute the opinion or advice of IC Markets or any form of personal or investment advice.
Any opinions, news, research, analyses, prices, other information, or links to third-party sites contained on this website are provided on an "as-is" basis, are intended only to be informative, is not an advice nor a recommendation, nor research, or a record of our trading prices, or an offer of, or solicitation for a transaction in any financial instrument and thus should not be treated as such. The information provided does not involve any specific investment objectives, financial situation and needs of any specific person who may receive it. Please be aware, that past performance is not a reliable indicator of future performance and/or results. Past Performance or Forward-looking scenarios based upon the reasonable beliefs of the third-party provider are not a guarantee of future performance. Actual results may differ materially from those anticipated in forward-looking or past performance statements. IC Markets makes no representation or warranty and assumes no liability as to the accuracy or completeness of the information provided, nor any loss arising from any investment based on a recommendation, forecast or any information supplied by any third-party.
