EURUSD Under Pressure After Hot CPI – More Downside Ahead?Today, the US released key inflation figures :
Core CPI m/m: 0.2% (vs 0.3% forecast)
CPI m/m: 0.3% (as expected)
CPI y/y: 2.7% (vs 2.6% forecast, up from 2.4%)
Fundamental Analysis ( EURUSD ):
The slightly lower Core CPI suggests some easing in underlying inflation pressures. However, the headline CPI y/y came in hotter than expected at 2.7%, reinforcing the idea that the Fed is not yet ready to ease policy aggressively.
This combination supports the US dollar, as sticky inflation could delay rate cuts.
EURUSD is likely to remain under pressure in the short term unless the ECB signals a more hawkish stance or US data starts showing broader weakness.
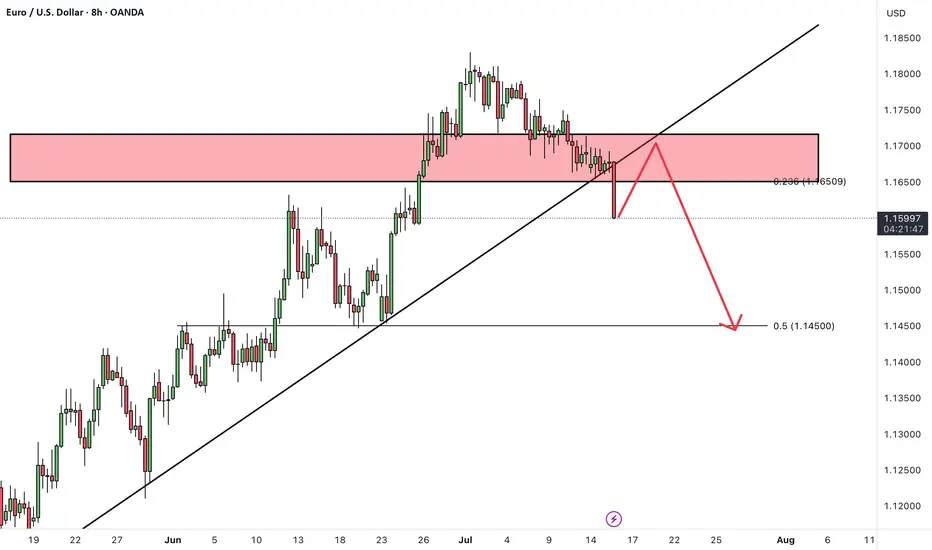
Now let's move on to the technical analysis of EURUSD ( FX:EURUSD ) on the 4-hour timeframe .
EURUSD is trading in a Heavy Resistance zone($1.1802-$1.1602) , having simultaneously managed to break the Support lines and the lower line of the Descending Channel , and is also trying to break the Support zone($1.1642-$1.1578) .
I expect EURUSD to continue its downtrend and decline to the Support zone($1.1549-$1.1520) at the first target .
Second target : $1.15043
Third target : $1.1464
Note: Stop Loss(SL)= $1.1660
Please respect each other's ideas and express them politely if you agree or disagree.
Euro/U.S. Dollar Analyze (EURUSD), 1-hour time frame.
Be sure to follow the updated ideas.
Do not forget to put a Stop loss for your positions (For every position you want to open).
Please follow your strategy and updates; this is just my Idea, and I will gladly see your ideas in this post.
Please do not forget the ✅' like '✅ button 🙏😊 & Share it with your friends; thanks, and Trade safe.
Forexsignals

GBPJPY Technical Outlook – July 15, 2025Looking for Impulse up!
GBPJPY has broken out of a classic bullish flag pattern on the 4H chart, signaling a potential continuation of the recent upside momentum. The breakout follows a strong impulse move from the 197.50 area, followed by a brief descending consolidation. Price has now closed above the flag structure, suggesting buyers are regaining control. A short pullback toward the breakout zone is possible before further upside toward the buy-side liquidity near 201.000. Equal highs are also resting just below this level, providing additional confluence for the upside target. As long as price holds above the 198.50–198.80 support area, the bullish outlook remains intact.
This analysis is intended for educational purposes only.
Learn & Earn!
Wave Trader Pro

EURUSDHello Traders! 👋
What are your thoughts on EURUSD?
EURUSD has broken support level and its ascending trendline, indicating a possible shift in short-term market structure and growing bearish pressure.
In the short term, we expect a pullback toward the broken support/trendline zone.
If price fails to reclaim this level, a continued move lower toward the next identified support zone is likely.
As long as price remains below the broken structure, the short-term outlook stays bearish.
Don’t forget to like and share your thoughts in the comments! ❤️
EURNZD: Bullish Setup Targeting Engineered Highs!Greetings Traders,
In today’s analysis of EURNZD, we observe that the market is currently operating within bullish institutional order flow. It is therefore essential that we align our bias with this narrative by focusing on buying opportunities.
Market Context:
Higher Timeframe Alignment:
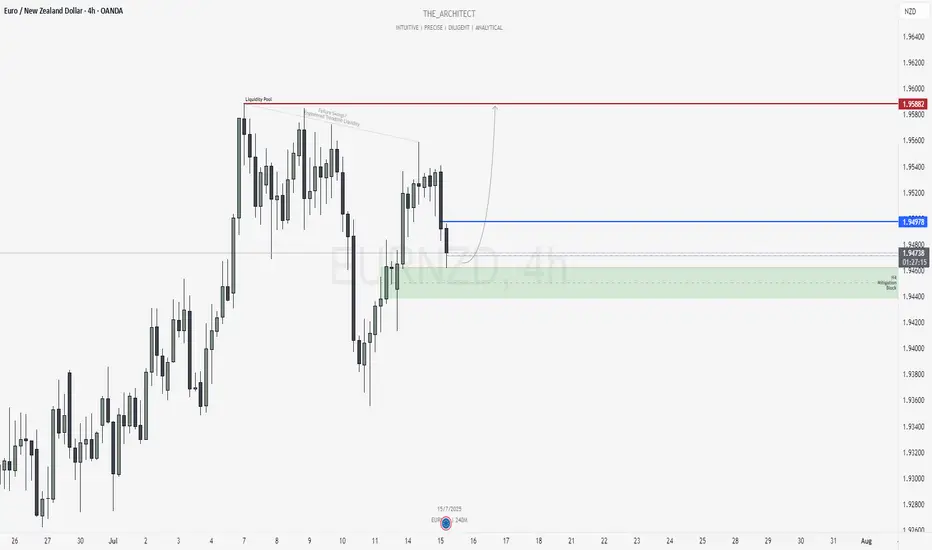
The weekly timeframe is showing a bullish draw on liquidity, and this is confirmed by the H4 (intermediate) timeframe, which is also structurally bullish. This alignment between higher and intermediate timeframes provides strong confluence for long positions.
Mitigation Block Support:
Price has recently retraced into an H4 Mitigation Block—a key institutional support zone. This area represents a region where previous sell-side activity was initiated. Now that price has broken above it, institutions are likely using this retracement to mitigate prior sell positions and establish new buy orders.
Trade Idea:
Entry Strategy:
Look for confirmation on the lower timeframes within the H4 mitigation block to initiate long positions in alignment with institutional order flow.
Target Objective:
The primary target is the relatively equal highs residing in premium pricing. These levels coincide with engineered trendline liquidity and failure swings, making them highly attractive profit-taking zones for institutions—where significant buy-side liquidity is expected to be absorbed.
Stay patient and execute only upon clear confirmation signals.
Kind Regards,
The Architect 🏛️📊
Skeptic | GBP/USD Update: Triggers Fired Up!Hey everyone, it’s Skeptic! ;) yesterday, the support at 1.35672 saw a fake breakout and snapped back into the 4-hour box we’ve been tracking. But bearish momentum is still strong, so here’s the play:
✔️ If you opened a short already , With the fake breakout signaling potential momentum shift, consider taking profits or closing if price consolidates above 1.36089. Why? The fakeout increases the chance of a momentum change.
✨ For new short positions , the 1.35672 break remains a valid trigger. If it breaks again, it could kickstart a major bearish leg, targeting lower supports at 1.35000 and 1.34227 —both strong reaction zones.
📊 The HWC is uptrend, so shorts need extra caution—reduce risk or take profits early.
📉 For longs , wait for a break and consolidation above 1.36406 . This level saw a strong rejection, signaling it’s a key resistance the market respects. A break here, liquidating short positions (which means buying), could spark a solid uptrend leg with great R/R potential.
🔔 Confirmation : Use RSI entering oversold for shorts or overbought for longs. The HWC uptrend means shorts carry higher risk, so tighten your risk management—stick to 1%–2% risk per trade.
🔼 Key Takeaway: Short at 1.35672 if it breaks again, long at 1.36406 with confirmation. Stay sharp for momentum shifts and keep stops tight. I’ll update if the market structure flips!
💬 Let’s Talk!
Which GBP/USD trigger are you locked on? Hit the comments, and let’s crush it together! 😊 If this update lit your fire, smash that boost—it fuels my mission! :)))

Gold. 14.07.2025. The plan for the next few days.The nearest resistance zones are where it's interesting to look for sales. It's not certain that there will be a big reversal, but I think we'll see a correction. We're waiting for a reaction and looking for an entry point.
The post will be adjusted based on any changes.
Don't forget to click on the Rocket! =)

Stealing Pips Like a Pro – AUD/NZD Long Heist, MA Breakout Setup🎯 AUD/NZD Heist: Bullish Bank Robbery 🚀💰 (Thief Trading Style)
🌟 Hi! Hola! Ola! Bonjour! Hallo! Marhaba! 🌟
Dear Money Makers & Robbers, 🤑💸✈️
Based on 🔥Thief Trading Style🔥 (technical + fundamental analysis), here’s our master plan to loot the AUD/NZD "Aussie vs Kiwi" Forex Bank!
🔎 The Heist Setup (Long Entry Focus)
🐂 Bullish Breakout Strategy:
Entry: Wait for MA breakout (1.08150) then strike!
Alternative Entry: Place Buy Stop above MA OR Buy Limit near pullback zones (15-30min timeframe).
Pro Tip: Set an ALERT for breakout confirmation!
🛑 Stop Loss (Thief’s Safety Net):
"Yo, listen up! 🗣️ If you're entering via Buy Stop, don’t set SL until after breakout!
Thief’s SL Zone: Nearest swing low (1.07500 – 3H timeframe).
Adjust SL based on your risk, lot size, and trade plan.
🎯 Profit Targets:
1st Target: 1.08600 (or escape earlier if cops lurk!).
Scalpers: Only scalp LONG! Use trailing SL to protect gains.
⚠️ Critical Heist Rules:
Avoid news chaos! 🚨 No new trades during high-impact news.
Lock profits with trailing stops.
Cops (Bears) are strong near resistance – don’t get caught!
💥 Boost the Heist!
💖 Hit the "Boost" button to strengthen our robbery squad! More likes = more 💰easy money heists!
Stay tuned for the next big steal! 🏆🚀🐱👤

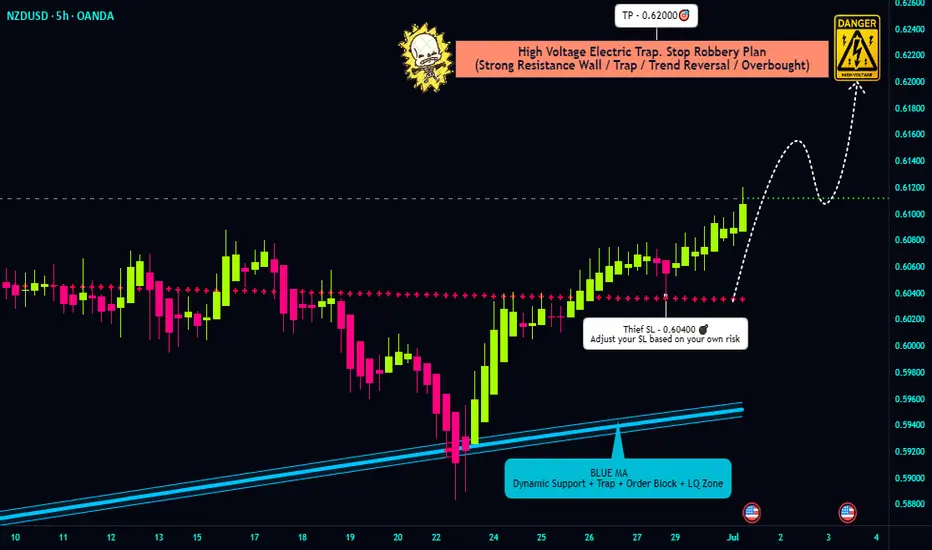
"Vault Breached! NZD/USD Bullish Loot (Live Heist)"🚨 "THE KIWI BANK HEIST" 🏦💰
NZD/USD Bullish Raid – Loot Fast Before the Cops Arrive!
🌟 Greetings, Money Bandits! 🌟 (Hola! Bonjour! Ciao! Konnichiwa!)
🔥 Thief Trading Intel:
The Vault is Open! 🏦➡️📈 – Price is bullish, but overbought.
Red Zone = Police Trap! 🚨 (Resistance/Reversal Risk)
Escape Plan: Take profits near 0.62400 (or bail early if traps trigger).
🔐 ENTRY: "BREAK IN NOW!"
"Buy the dip!" – Use 15M/30M swing lows for stealthy entries.
Set Alerts! ⏰ (Don’t miss the heist!)
🛑 STOP-LOSS: "THIEF’S SAFETY NET"
"Hide at 0.59500 (4H Swing Low)" – Adjust based on your loot size!
🎯 TARGET: "GRAB & VANISH!"
"0.62400 or escape earlier!" – Don’t get greedy; cops (bears) are lurking.
⚡ SCALPERS’ NOTE:
"Only steal LONG!" – Use trailing SL to protect your bag.
"Rich? Charge in! Poor? Wait for swings!"
📡 FUNDAMENTAL BACKUP:
"Kiwi is bullish… but check the news!" 📰 (COT, Macro Data, Sentiment)
⚠️ ALERT: Avoid trading during high-impact news – cops (volatility) love chaos!
💥 BOOST THIS HEIST! (Like & Share = More Loot!)
🚀 "Support the crew! Hit 👍, and let’s rob this market blind!" 💸🤝
Next heist coming soon… Stay tuned, bandits! 🏴☠️🎭

GBP/CAD: Smart Money Heist Strategy – Ready for the Breakout?💼💣 GBP/CAD Forex Bank Heist Plan 🚨 | "Thief Trading Style" 💹💰
🌟 Hi! Hola! Ola! Bonjour! Hallo! Marhaba! 🌟
Welcome to all strategic traders, market tacticians & opportunity seekers! 🧠💸
Here’s our latest Forex blueprint based on the exclusive “Thief Trading Style” – a blend of tactical technicals, smart fundamentals, and stealthy price action moves. We’re preparing for a potential breakout heist on the GBP/CAD a.k.a “The Pound vs Loonie”.
🗺️ Heist Strategy Overview:
The market is forming a bullish setup with signs of consolidation, breakout potential, and trend reversal dynamics. We're eyeing a long entry, but timing is everything. This setup seeks to "enter the vault" just as resistance is breached and ride the move until the ATR High-Risk Zone—where many market players may exit.
🎯 Entry Plan:
📈 Primary Trigger Zone: Watch for a break and close above 1.87000.
🛎️ Set an alert! You’ll want to be ready when the opportunity knocks.
📍Entry Tips:
Place Buy Stop orders above the moving average or
Use Buy Limit entries on pullbacks near recent 15/30min swing lows.
(Perfect for both scalpers and swing traders!)
🛑 Stop Loss Placement:
Thief Trading Style uses a flexible SL system:
Recommended SL at the nearest 4H swing low (~1.85700)
Adjust SL based on your lot size, risk appetite & number of orders
🎤 Reminder: Set SL after breakout confirmation for buy-stop entries. No fixed rule—adapt to your style but manage risk wisely.
🎯 Target Zone:
🎯 Primary TP: 1.89000
🏃♂️ Or exit earlier if price enters a high-risk reversal area
🧲 Scalpers: Stick to long-side trades only and protect your profits with a trailing SL.
🔍 Why GBP/CAD? (Fundamental Notes):
Current momentum is bullish, supported by:
📊 Quant & Sentiment Analysis
📰 Macro Fundamentals & COT Data
📈 Intermarket Trends & Technical Scoring
Get the full data klick it 🔗
⚠️ Caution During News:
To avoid volatility spikes:
Refrain from entering new positions during high-impact news
Use trailing SLs to protect running profits
❤️ Show Support & Stay Tuned:
Smash the 🔥Boost Button🔥 if you love this kind of analysis!
Support the strategy, strengthen our community, and let’s continue this journey of smart, stylish trading.
Stay tuned for the next “heist plan” update—trade smart, stay alert, and manage your risk like a pro. 🏆📈🤝

"NZD/USD Bullish Heist! Steal Pips Before the Reversal Trap! 🏴☠️ NZD/USD Kiwi Heist Masterplan – Steal the Bull Run! 💰
🌟 Hola, Money Makers & Market Marauders! 🌟
Welcome to the Thief Trading Style raid on the NZD/USD "The Kiwi" Forex vault. Follow the blueprint sketched in the chart for a bold long takeover — escape the high‑risk Yellow MA Zone before guards tighten!
🎯 Heist Blueprint
1. Entry 🚀
"The vault swings wide—yank that Bull loot at any price!"
Drop your buy-limit orders within the next 15–30 min (or at the latest swing low/high). Don’t sleep—set chart alerts for the perfect breach.
2. Stop‑Loss 🛑
Thief-style SL lurks at the nearest 5h swing‑low wick (≈ 0.60400) for intra‑day.
Adjust your SL based on your risk appetite, position size, and combo of orders.
3. Target 🎯
Aim to escape by 0.62000, or bail early for safety.
4. Scalpers’ Edge 🔍
Only rob on the long side. Big bankroll? Go all‑in. Prefer safety? Slide into the swing crew with a trailing SL to lock in your spoils.
🔍 Market Intel
Why the Kiwi Loot is Ripe:
Bullish momentum marches on, fueled by macroeconomic clues, COT data, sentiment shifts, inter-market moves — all pointing upward.
📚 For Full Recon:
Dive into the fundamental, macro, COT, quant, sentiment & intermarket intel — plus trend targets and scorecards. Check the data here 👉🔗🔗
⚠️ Caution Zone
News Watch & Position Safety:
Major news = guarded vault. Don't open new trades during release windows.
If you're in already, use trailing stops to shield your haul and lock in gains.
💪 Support the Crew
Smash that “Boost” to fuel our team and keep the raid running smooth. With Thief Trading Style, every day’s a payday.
🗓️ Stay tuned for the next Kiwi Heist – we’re just getting started. Happy robbing, legends! 🐱👤💥
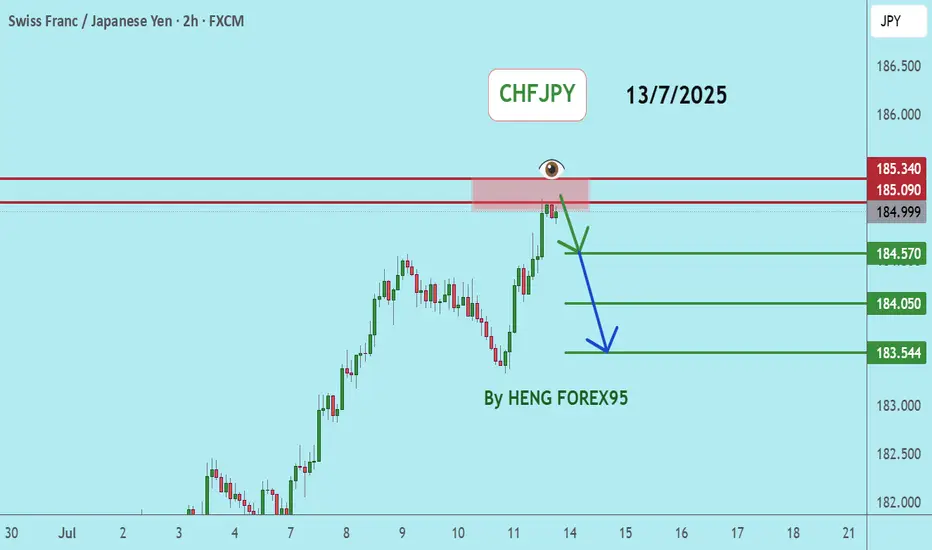
CHFJPYCHFJPY price is in a very bullish trend. At the current price, there may be short-term selling. Therefore, if the price cannot break through 185.34, it is expected that the price will drop. Consider selling the red zone.
🔥Trading futures, forex, CFDs and stocks carries a risk of loss.
Please consider carefully whether such trading is suitable for you.
>>GooD Luck 😊
❤️ Like and subscribe to never miss a new idea!
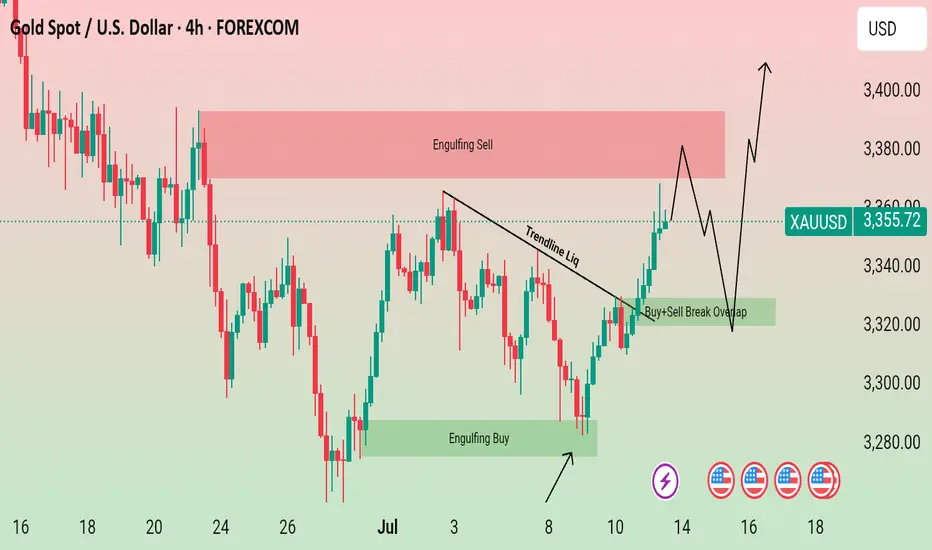
Gold just played an interesting game on the 4-hour chart!🚨 GOLD Technical Outlook – 4H Chart Insight! 🕵️♂️✨
📉 First, we spotted a Bearish Engulfing pattern that created a strong Sell Zone, signaling downward pressure. But guess what? The market wasn't ready to give up just yet…
📈 From the lower end, a powerful Bullish Engulfing stepped in like a hero, offering solid support and pushing the market back up!
Now here's where it gets exciting:
🔥 Gold has formed another bullish engulfing pattern, and the price is once again knocking on the door of that Sell Zone.
🤔 What's next?
A rejection from this sell zone could trigger another drop 📉
But keep an eye on the overlapping support zone below — if price revisits and holds there, we could see a bullish bounce toward the upside again! 🚀
📌 Key takeaway: We’re at a decision point. The next move could be explosive — up or down. Stay sharp! 🔍
⚠️ DYOR – Do Your Own Research! 🚫 This is not financial advice — just a trader's perspective.
EURUSD: Detailed Support & Resistance Analysis 🇪🇺🇺🇸
Here is my latest structure analysis and important
supports and resistances for EURUSD for next week.
Consider these structures for pullback/breakout trading.
❤️Please, support my work with like, thank you!❤️
I am part of Trade Nation's Influencer program and receive a monthly fee for using their TradingView charts in my analysis.

EURGBP SHORT – WEEKLY FORECAST Q3 | W29 | Y25💼 EURGBP SHORT – WEEKLY FORECAST
Q3 | W29 | Y25
📊 MARKET STRUCTURE SNAPSHOT
EURGBP is currently reacting from a key higher time frame supply zone, with price action showing weakness at premium levels. Momentum has slowed, and early signs of distribution are appearing. With structure aligning bearishly across multiple timeframes, the pair presents a short bias opportunity.
🔍 Confluences to Watch 📝
✅ Daily Order Block (OB)
Price reacted from a high-probability bearish OB.
Rejection wicks and a shift in candle body control point to supply dominance.
Momentum is fading, confirming the presence of smart money sellers.
✅ 4H Order Block
Clear mitigation of 4H OB followed by an internal break of structure (iBoS).
Price is respecting the OB zone, printing lower highs beneath key supply.
Perfect mid-timeframe confirmation of trend transition.
✅ 1H Order Block
1H structure shifted bearish, validating LTF trend alignment.
Price building supply chain with continued lower highs and bearish engulfing patterns.
Ideal zone for entry on pullback or liquidity sweep.
📈 Risk Management Protocols
🔑 Core Principles:
💰 Max 1% risk per trade
📍 Only execute at pre-identified zones
⏰ Set alerts — avoid impulsive trades
📉 Respect RR — minimum 1:2 per position
🧠 You're not paid for frequency. You're paid for discipline and execution quality.
🧠 Weekly FRGNT Insight
“Trade what the market gives, not what your ego wants.”
Stay mechanical, stay focused, and allow the probabilities to play out. Your job is to control risk — not the outcome.
🏁 Final Thoughts from FRGNT
📌 The structure is clear.
📌 The confluences are stacked.
📌 The bias is confirmed.
Let your execution reflect your discipline, not your emotions.
❤️ Good luck this week, and as always – I’ll see you at the very top.

EURJPY SHORT – WEEKLY FORECAST Q3 | W29 | Y25💼 EURJPY SHORT – WEEKLY FORECAST
Q3 | W29 | Y25
📊 MARKET STRUCTURE SNAPSHOT
EURJPY is currently reacting from a key higher time frame supply zone, with price action showing weakness at premium levels. Structure and momentum are now aligning for a short opportunity backed by multi-timeframe confluence.
🔍 Confluences to Watch 📝
✅ Daily Order Block (OB)
Strong reaction and early signs of distribution.
Previous bullish momentum is losing steam; structure is flattening with rejection wicks forming.
✅ 4H Order Block
Break of internal structure (iBoS) confirms a short-term bearish transition.
✅ 1H Order Block
1H structure shift bearish
📈 Risk Management Protocols
🔑 Core principles:
Max 1% risk per trade
Only execute at pre-identified levels
Use alerts, not emotion
Stick to your RR plan — minimum 1:2
🧠 You’re not paid for how many trades you take, you’re paid for how well you manage risk.
🧠 Weekly FRGNT Insight
"Trade what the market gives, not what your ego wants."
Stay mechanical. Stay focused. Let the probabilities work.
🏁 Final Thoughts from FRGNT
📌 The structure is clear.
The confluences are stacked.
Let execution follow discipline, not emotion.

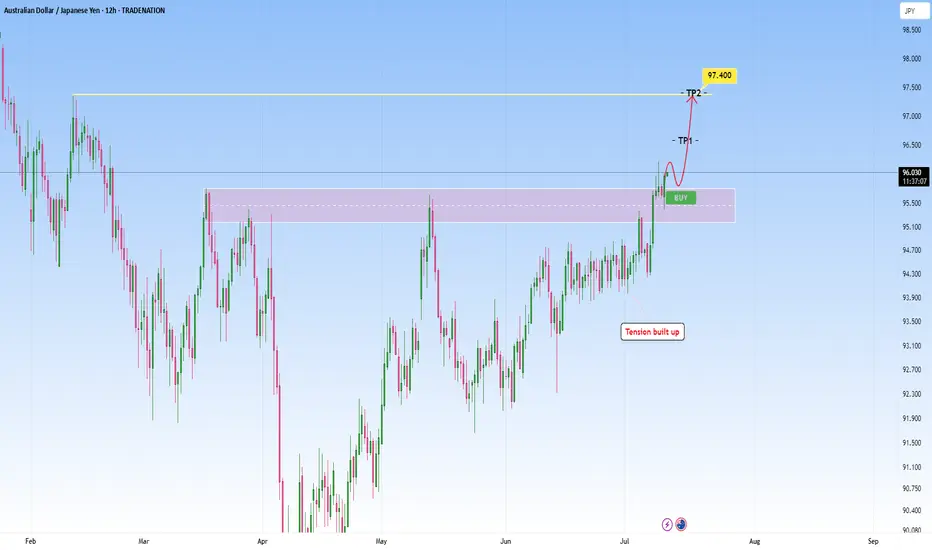
AUDJPY Technical Breakout - Targeting 97.400 Next?TRADENATION:AUDJPY has recently broken decisively above a key resistance zone that had previously capped price for several months. This breakout was preceded by a period of compression and range-bound price action, where bullish momentum steadily built up, indicated by higher lows pressing against the resistance level. This type of structure typically leads to an explosive breakout, which we are now seeing unfold.
After the breakout, price came back for a clean retest of the broken resistance zone, which has now flipped into support. The retest held firmly, suggesting strong buyer interest at this level and confirming the validity of the breakout.
With this structure in place, the bullish momentum is likely to extend further toward the next target zone around 97.400, provided price remains above the current support.
As long as the price holds above the retested zone, the bullish outlook remains intact. A breakdown back below this area, however, would be a warning sign and could open the door to a deeper pullback.
Remember, always wait for confirmation before entering trades, and maintain disciplined risk management.
USDJPY: More Growth Ahead! 🇺🇸🇯🇵
USDJPY broke and closed above a minor daily resistance
with a confirmed BoS.
The next strong resistance is 148.0
It is going to be the next goal for bulls.
❤️Please, support my work with like, thank you!❤️
I am part of Trade Nation's Influencer program and receive a monthly fee for using their TradingView charts in my analysis.

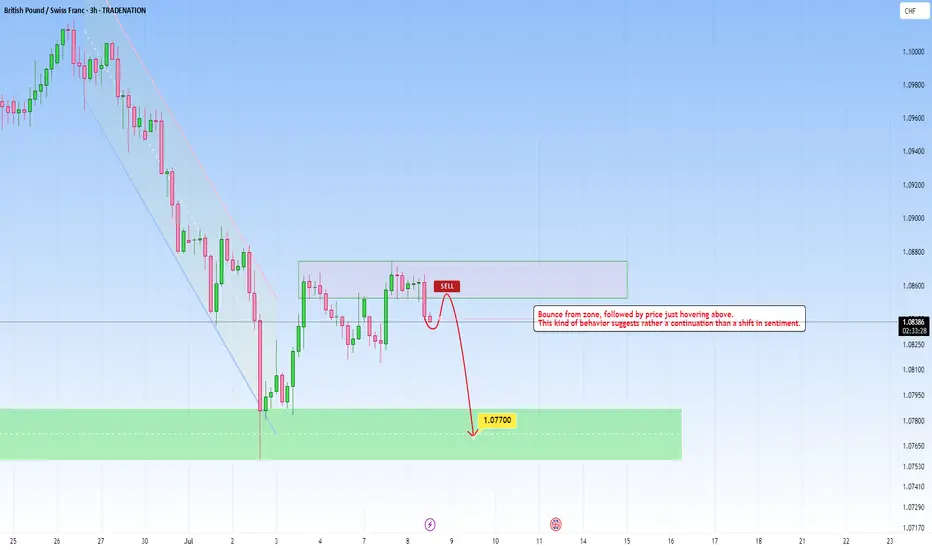
GBPCHF - Continuation Setup towards 1.0770GBPCHF recently descended with strength, and I’ve been watching to see how price reacts here.
Price now hovers above and this is a great indication for us to use for possible continuation move, that could send price into the 1.0770 level.
But if price breaks above with momentum, then I’ll back off the bearish bias and reassess, and I’d consider the continuation idea invalidated, with potential for further upside.
Just sharing my thoughts for the charts, this isn’t financial advice. Always confirm your setups and manage your risk properly.
Disclosure: I am part of Trade Nation's Influencer program and receive a monthly fee for using their TradingView charts in my analysis.
Xauusd Up Gold stabilizes near $2,030, eyes on FOMC Minutes
Gold clings to marginal daily gains at around $2,030 on Wednesday after closing the first two days of the week in positive territory. The benchmark 10-year US Treasury bond yield edges lower ahead of FOMC Minutes, helping XAU/USD hold its ground.
From a technical perspective, sustained strength and acceptance above the 50-day SMA will set the stage for an extension of the recent recovery from the $1,984 region, or a two-month low touched last week. Given that oscillators on the daily chart have been gaining positive traction, the Gold price might then accelerate the positive move towards an intermediate hurdle near the $2,044-2,045 region en route to the $2,065 supply zone.
Gold now 2028
Target 2032
Target 2036
Target 2050
Target 2059
SL 2015
FOMC signal confirm

EURGBP Perfect Channel Up giving one more buy opportunity.Last time we looked at the EURGBP pair (May 30, see chart below) we gave the most timely buy signal right at the bottom (Higher Lows trend-line) of the Bullish Megaphone, and the price is only a few candles away from the 0.87400 Target:
If we look at the price action from a 4H perspective we can see that it is a Channel Up that has been driving the pair upwards since the May 28 bottom and today's rebound is taking place after a direct hit on the 4H MA50 (blue trend-line).
This is the start of the new Bullish Leg. Since the previous two have increased by +1.90%, this rally has the potential to even exceed our 0.87400 Target marginally. Still, this is a perfect bullish set-up.
-------------------------------------------------------------------------------
** Please LIKE 👍, FOLLOW ✅, SHARE 🙌 and COMMENT ✍ if you enjoy this idea! Also share your ideas and charts in the comments section below! This is best way to keep it relevant, support us, keep the content here free and allow the idea to reach as many people as possible. **
-------------------------------------------------------------------------------
Disclosure: I am part of Trade Nation's Influencer program and receive a monthly fee for using their TradingView charts in my analysis.
💸💸💸💸💸💸
👇 👇 👇 👇 👇 👇

GBPUSD. The plan for the next few days.The nearest resistance zones are where it's interesting to look for purchases. We are waiting for a reaction and looking for an entry point.
The post will be adjusted if there are any changes.
Don't forget to click on the Rocket! =)

CADJPY; Heikin Ashi Trade IdeaIn this video, I’ll be sharing my analysis of CADJPY, using FXAN's proprietary algo indicators with my unique Heikin Ashi strategy. I’ll walk you through the reasoning behind my trade setup and highlight key areas where I’m anticipating potential opportunities.
I’m always happy to receive any feedback.
Like, share and comment! ❤️
Thank you for watching my videos! 🙏

XAUUSD- Bearish AB=CD pattern at resistance zone!Timeframe:2H|Pattern: AB=CD| Bias: Bearish Reversal!
Gold (XAUUSD) has completed a precise AB=CD pattern aligning perfectly with a strong resistance zone near 3340-3350 the symmetry of the harmonic pattern combined with historical rejection levels gives a strong signal for a potential downside move
Trade setup idea:
Sell entry: 3340-3350
target:1: 3300
target:2: 3260
risk reward: Favorable setup with harmonic confirmation.
