Falling towards 61.8% Fibonacci support?The Cable (GBP/USD) is falling towards the pivot, which serves as pullback support and could bounce to the 1st resistance, which acts as pullback resistance.
Pivot: 1.3315
1st Support: 1.3159
1st Resistance: 1.3586
Risk Warning:
Trading Forex and CFDs carries a high level of risk to your capital and you should only trade with money you can afford to lose. Trading Forex and CFDs may not be suitable for all investors, so please ensure that you fully understand the risks involved and seek independent advice if necessary.
Disclaimer:
The above opinions given constitute general market commentary, and do not constitute the opinion or advice of IC Markets or any form of personal or investment advice.
Any opinions, news, research, analyses, prices, other information, or links to third-party sites contained on this website are provided on an "as-is" basis, are intended only to be informative, is not an advice nor a recommendation, nor research, or a record of our trading prices, or an offer of, or solicitation for a transaction in any financial instrument and thus should not be treated as such. The information provided does not involve any specific investment objectives, financial situation and needs of any specific person who may receive it. Please be aware, that past performance is not a reliable indicator of future performance and/or results. Past Performance or Forward-looking scenarios based upon the reasonable beliefs of the third-party provider are not a guarantee of future performance. Actual results may differ materially from those anticipated in forward-looking or past performance statements. IC Markets makes no representation or warranty and assumes no liability as to the accuracy or completeness of the information provided, nor any loss arising from any investment based on a recommendation, forecast or any information supplied by any third-party.
Forexsignals

Market next move ⚠️ 1. Weak Bullish Continuation Signal
The current price action shows a rejection wick on a red candle, signaling selling pressure near the recent highs.
Despite the upward move earlier, this could be a short-term exhaustion rather than strength for further upside.
---
📉 2. No Follow-Through After Bullish Spike
There was a strong bullish candle earlier, but:
No significant follow-up to break past that level convincingly.
Price appears to have stalled or even reversed after that spike — possibly forming a bull trap.
---
🔄 3. Overhead Resistance at Target Area
The "TARGET" label sits near recent highs, which have already been rejected once.
Without clear breakout volume, this zone might act as resistance, not a logical next stop.

Market next target ⚠️ 1. Bearish Momentum Remains Intact
The last few candles are strongly bearish, with steep declines and high red candle volume.
Attempting to project an upside target amid this current bearish drive lacks alignment with actual market sentiment.
---
📉 2. Lack of Reversal Candlestick Patterns
There is no clear bullish reversal pattern visible at the point of target placement:
No hammer, bullish engulfing, or morning star pattern.
The price may just be pausing before continuing its downward trend.
---
🔊 3. Volume Discrepancy
The rising volume on red candles vs. low volume on recent green candles shows selling pressure outweighs buying interest.
A reliable bullish setup would typically come with higher buying volume after a selloff, which is not yet seen.
---
🧭 4. Misleading “Target” Location
The marked target is at a higher high, near 33.75–34.00 area, which:
Is not supported by immediate technical breakout
Seems to ignore the last failed attempt to break above that level
Appears overly optimistic given the current trend direction

Market next move
🔍 1. Weak Confirmation for Target Level
The marked "TARGET" area lacks strong technical confirmation such as:
Resistance zone retest.
Fibonacci level confluence.
Moving average alignment.
Without solid technical backing, this target may appear speculative.
---
📉 2. Bearish Momentum is Strong
The last few candles show strong red (bearish) momentum.
The price has broken short-term support levels (e.g., local lows from the 29th).
Volume is increasing on bearish candles, signaling strong selling pressure.
Setting a bullish target while in a bearish momentum phase might be premature.
---
🕒 3. Timeframe Limitations
This is a 1-hour chart, which is more prone to noise and false signals.
Higher timeframes (like 4H or Daily) should be checked to validate this upward target.

BEST XAUUSD M30 BUY & SELL SETUP FOR TODAY 📉📊 Gold (XAU/USD) Technical Outlook – Key Decision Zone Incoming! ⚠️📈
Gold prices are currently testing a crucial support zone around 3,251, following a strong bearish momentum. As shown on the M30 chart, the market is now at a make-or-break level, where two potential scenarios could unfold: either a bullish reversal toward the 3,280–3,300 area if price holds and confirms support ✅, or a bearish continuation if the level breaks, pushing price lower toward 3,220 or beyond ❌. Traders should watch for price action signals and wait for a clear breakout or strong bounce confirmation before entering any trades 🧠🔍. This is a high-volatility reaction zone — trade smart! 🎯📉📈

BEST GOLD M30 BUY SETUP FOR TODAY📉 Gold is currently showing signs of a potential pullback towards the key demand zone around 3,290–3,285 marked in purple. This area has previously acted as a strong support and could trigger a bullish reversal if price reacts positively here. 🟪 Once the price enters this zone and forms a bullish confirmation (like a rejection wick or bullish engulfing candle), we could see a strong upward move targeting 3,320+ 📈. Traders should stay alert for buying opportunities from this zone and avoid chasing the price before a clear confirmation! 🎯⚡

Bearish reversal off pullback resistance?The Fiber (EUR/USD) is rising towards the pivot and could reverse to the support.
Pivot: 1.1424
1st Support: 1.1237
1st Resistance: 1.1555
Risk Warning:
Trading Forex and CFDs carries a high level of risk to your capital and you should only trade with money you can afford to lose. Trading Forex and CFDs may not be suitable for all investors, so please ensure that you fully understand the risks involved and seek independent advice if necessary.
Disclaimer:
The above opinions given constitute general market commentary, and do not constitute the opinion or advice of IC Markets or any form of personal or investment advice.
Any opinions, news, research, analyses, prices, other information, or links to third-party sites contained on this website are provided on an "as-is" basis, are intended only to be informative, is not an advice nor a recommendation, nor research, or a record of our trading prices, or an offer of, or solicitation for a transaction in any financial instrument and thus should not be treated as such. The information provided does not involve any specific investment objectives, financial situation and needs of any specific person who may receive it. Please be aware, that past performance is not a reliable indicator of future performance and/or results. Past Performance or Forward-looking scenarios based upon the reasonable beliefs of the third-party provider are not a guarantee of future performance. Actual results may differ materially from those anticipated in forward-looking or past performance statements. IC Markets makes no representation or warranty and assumes no liability as to the accuracy or completeness of the information provided, nor any loss arising from any investment based on a recommendation, forecast or any information supplied by any third-party.

Falling towards pullback support?US Dollar index (DXY) is falling towards the pivot and could bounce to the 1st resistance.
Pivot: 98.89
1st Support: 97.98
1st Resistance: 100.09
Risk Warning:
Trading Forex and CFDs carries a high level of risk to your capital and you should only trade with money you can afford to lose. Trading Forex and CFDs may not be suitable for all investors, so please ensure that you fully understand the risks involved and seek independent advice if necessary.
Disclaimer:
The above opinions given constitute general market commentary, and do not constitute the opinion or advice of IC Markets or any form of personal or investment advice.
Any opinions, news, research, analyses, prices, other information, or links to third-party sites contained on this website are provided on an "as-is" basis, are intended only to be informative, is not an advice nor a recommendation, nor research, or a record of our trading prices, or an offer of, or solicitation for a transaction in any financial instrument and thus should not be treated as such. The information provided does not involve any specific investment objectives, financial situation and needs of any specific person who may receive it. Please be aware, that past performance is not a reliable indicator of future performance and/or results. Past Performance or Forward-looking scenarios based upon the reasonable beliefs of the third-party provider are not a guarantee of future performance. Actual results may differ materially from those anticipated in forward-looking or past performance statements. IC Markets makes no representation or warranty and assumes no liability as to the accuracy or completeness of the information provided, nor any loss arising from any investment based on a recommendation, forecast or any information supplied by any third-party.

Bearish reversal for the Aussie?AUD/USD is rising towards the resistance level which is a pullback resistance that lines up with the 38.2% Fibonacci retracement and could drop from this level to our take profit.
Entry: 0.6464
Why we like it:
There is a pullback resistance level that lines up with the 38.2% Fibonacci retracement.
Stop loss: 0.6499
Why we like it:
There is a pullback resistance level that is slightly below the 78.6% Fibonacci retracement.
Take profit: 0.6397
Why we like it:
There is a pullback support level.
Enjoying your TradingView experience? Review us!
Please be advised that the information presented on TradingView is provided to Vantage (‘Vantage Global Limited’, ‘we’) by a third-party provider (‘Everest Fortune Group’). Please be reminded that you are solely responsible for the trading decisions on your account. There is a very high degree of risk involved in trading. Any information and/or content is intended entirely for research, educational and informational purposes only and does not constitute investment or consultation advice or investment strategy. The information is not tailored to the investment needs of any specific person and therefore does not involve a consideration of any of the investment objectives, financial situation or needs of any viewer that may receive it. Kindly also note that past performance is not a reliable indicator of future results. Actual results may differ materially from those anticipated in forward-looking or past performance statements. We assume no liability as to the accuracy or completeness of any of the information and/or content provided herein and the Company cannot be held responsible for any omission, mistake nor for any loss or damage including without limitation to any loss of profit which may arise from reliance on any information supplied by Everest Fortune Group.

XAUUSD TECHNICAL OUTLOOK 29-05-2025📣Gold Under Pressure XAUUSD CMP $3316.81
✅XAUUSD movement 29-05-2025: $3289-$3245-$3321 =$120 Movement Witnessed.
🔴Gold remains under pressure after a sharp turn from morning crash, which has triggered fresh volatility across commodities in USA session.
⏳ Despite safe-haven appeal, XAUUSD faces bullish momentum after a correction, driven by renewed appetite for risk assets and shifting market flows.
📉 Technical Outlook (1H):
• Bearish below $3305
• Next downside targets: $3280 → $3265 → $3250
• A break below $3255 could accelerate the decline toward $3240-$3220
🔁 Bullish Shift Trigger:
• A confirmed 1H close above $3319 may invalidate the bearish bias and target $3340+
📊 Key Levels:
• Pivot: $3305
• Support: $3280 – $3265 – $3250
• Resistance: $3327 – $3339 – $3351

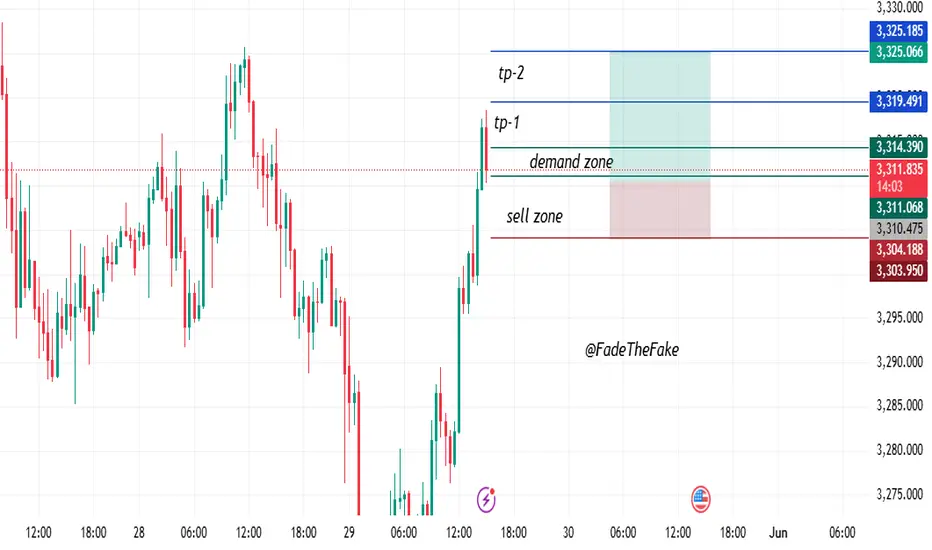
“Clean SMC Buy Setup | Retest & Rally from Demand Zone”This chart shows a clean Smart Money Concept (SMC) style buy-side setup, targeting a highly respected demand zone and high-odds liquidity grab above.
Following a steep bullish impulse, price formed a new market structure shift (BOS) and is now retracing into a crucial entry zone at 3,314.00 – 3,311.50. This area is marked by a hidden order block and imbalance, with high R:R opportunities for buyers.
The stop loss is judiciously set below the latest wick at 3,304.40, safeguarding against manipulation while having the best risk exposure.
The target one (TP1) is at 3,319.70, corresponding to intraday liquidity and recent supply reaction. The second target (TP2) goes up to 3,325.90, a major high where external liquidity would most likely be absorbed before any major change.
This is on the basis of:
A confirmed bullish BOS
Demand zone + OB alignment
Imbalance + inducement layer barely underneath the entry
No indication of bearish turn yet
We expect retest of demand and a move on to liquidity, given the zone is sustained and no bearish BOS is witnessed.
???? Trade Parameters:
Entry Zone: 3,314.00 – 3,311.50
SL: 3,304.40 (below OB)
TP1: 3,319.70
TP2: 3,325.90
Bias: Bullish (scalp-to-swing)
Gold has recently reclaimed liquidity from its previous two-day!Gold's Recent Market Behavior and Potential Outlook
Gold has recently reclaimed liquidity from its previous two-day lows, indicating a potential shift in market dynamics. Currently, the price is approaching a weekly bullish Fair Value Gap (FVG), suggesting a possible upward movement. Additionally, the 4-hour chart reveals that a minor bearish FVG has been broken, further supporting the notion of a bullish reversal.
Despite these bullish signals, gold is entering a larger bearish FVG zone. If the market provides confirmation of a sell signal from this level, a downward movement could be anticipated. Conversely, if the price breaks through this bearish FVG, it may continue its upward trajectory.
In summary, while short-term indicators favor a bullish outlook, the larger bearish FVG zone presents a critical juncture. Traders should monitor for confirmation signals to determine the next market direction.
DYOR! Not Financial Advice.

GBP/JPY Elliott Wave Count Warns of Impending Sell-OffThe GBP/JPY pair has just completed a 5-wave downtrend, which ended around early April. Since then, the price has been moving higher in what appears to be a typical A-B-C corrective pattern — a common move that occurs after a major downtrend in Elliott Wave Theory.
We are currently in the final wave (C) of this correction, and within that, it appears that Wave 5 of C is now unfolding. This final wave appears to be nearing its end, and the price is approaching a strong resistance area between 196.813 and 197.513.
T1: 193.735
T2: 192.133
SL: 198.252
❌ Invalidation Level:
If the price closes above 198.252, this Elliott Wave count is likely wrong. That could mean the market is preparing for a bigger rally instead.

TON/USDT on Fire: Bullish Momentum Builds Toward Major Targets!By examining the #TONCOIN chart on the 3-day timeframe, we can see that after correcting down to $3, the price has started pumping again and is showing strong bullish momentum. So far, it has gained over 15%, and I expect this uptrend to continue! The next targets are $3.64, $4.20, and $4.66. The expected return is around 20% in the short term, 40% to 55% in the medium term, and 110% in the long term. Support this analysis and stay tuned for more updates, my friends!
Please support me with your likes and comments to motivate me to share more analysis with you and share your opinion about the possible trend of this chart with me !
Best Regards , Arman Shaban

Market next move 🔻 Potential Disruptions to the Bullish Scenario:
1. False Breakout Risk at the Resistance Zone
The price is hovering near a horizontal resistance zone (red box).
Repeated wicks at this level suggest selling pressure.
If price breaks above slightly and then pulls back inside the range, it could be a bull trap, triggering a sharp drop (red arrow).
2. Weak Follow-Through on Volume
Recent bullish candles show no increase in volume.
This hints at lack of conviction among buyers, increasing the chance of a reversal rather than continuation.
3. Bearish Divergence Possibility
If we applied RSI or MACD here, there’s a high chance of bearish divergence forming (price making higher highs, while indicators show lower highs), signaling potential reversal pressure.
4. Upcoming U.S. News Events
U.S. economic announcements (indicated by icons) could strengthen the USD, causing GBP/USD to drop suddenly despite the bullish technical structure.
5. Bearish Candlestick Pattern Forming
If the current or next candle closes as a shooting star, evening star, or bearish engulfing, it would be a classic reversal pattern from resistance.
6. Liquidity Grab Above Highs
Market makers may push the price above resistance to trigger stop-losses and induce longs, then reverse—classic liquidity hunt scenario.

Market next move 🔻 Disruption Scenarios:
1. Resistance Zone at Target Level
The marked "Target" could coincide with a strong resistance level from a previous high.
Price may reject this level again, forming a double top or bearish reversal candlestick pattern (e.g., shooting star or bearish engulfing).
2. Volume Divergence
The recent uptrend shows a slight drop in buying volume.
If price increases while volume decreases, it signals a potential exhaustion of bullish momentum.
3. Upcoming News Events (Fundamentals)
The chart shows several upcoming economic events (news icons).
Any negative surprise from U.S. data or positive Eurozone data could reverse the trend sharply.
For example, better-than-expected U.S. employment data could strengthen the USD, pushing EUR/USD down.
4. Overbought Condition
If we add an RSI (Relative Strength Index) or Stochastic oscillator, the price might already be in the overbought zone, suggesting a correction is due.
5. Fake Breakout Trap
If the price hits the “Target” but then fails to close above it, it could be a bull trap, triggering short positions and leading to a sharp sell-off.

USD/JPY 1H Analysis – Channel Breakout and Buy SignalOverview:**
The USD/JPY chart shows a **bullish breakout from a descending channel**, supported by technical indicators like the Ichimoku Cloud and a strong demand zone. This setup suggests a potential bullish reversal and upward momentum.
*Key Technical Points:**
* **Descending Channel Breakout:**
Price action has broken out of a falling channel, indicating a shift in market sentiment from bearish to bullish.
* **Strong Support Zone:**
Around 143.28 – 143.73, the price found significant support, which aligns with a previous demand zone. This area held firm, helping trigger the breakout.
* **Ichimoku Cloud:**
Price is emerging above the Ichimoku Cloud, signaling a potential start of an uptrend. If the price maintains above the cloud, bullish momentum may strengthen.
* **Resistance Levels:**
* **First Resistance:** Near 146.00 – a critical area to watch for short-term profit-taking.
* **Second Resistance:** Around 148.00 – a more extended target if bullish continuation holds.
---
### **Trading Idea:**
**BUY USD/JPY** on successful retest of the breakout or sustained move above the Ichimoku Cloud.
* **Entry:** 144.30–144.40 zone
* **Target 1:** 146.00
* **Target 2:** 148.00
* **Stop Loss:** Below 143.20 (under the support zone)
---
Conclusion:**
The chart presents a classic **bullish channel breakout** supported by the Ichimoku indicator and price action at a strong support zone. As long as the price holds above the breakout level and Ichimoku Cloud, the upside targets at 146 and 148 remain valid.
Let me know if you want this formatted as a trade plan or journal entry.
To ensure you do not miss the upcoming analysis, be sure to follow me!
Please leave a remark and a like!

euraud buy signal. Don't forget about stop-loss.
Write in the comments all your questions and instruments analysis of which you want to see.
Friends, push the like button, write a comment, and share with your mates - that would be the best THANK YOU.
P.S. I personally will open entry if the price will show it according to my strategy.
Always make your analysis before a trade

GBP/USD – Correction in Progress - Where to buy?A few days ago, I pointed out that GBP/USD broke above key resistance from above 1.34, and even cleared the psychological barrier at 1.35.
That breakout opened the door for a potential move toward 1.4000, and I suggested that traders should look for buying opportunities on pullbacks.
Well — we’re in that pullback now.
So, where do we buy?
📍 The most obvious area is the old resistance around 1.3430. But here’s the catch:
GBP/USD is notorious for fakeouts and spikes.
If price tests that level, it could easily dip under 1.34, take out stops, and only then reverse to the upside.
🛡️ Bottom line: If you’re buying the dip, set your stop-loss wisely
Disclosure: I am part of Trade Nation's Influencer program and receive a monthly fee for using their TradingView charts in my analyses and educational articles.

Market next move 🔺 Disruption to Bearish Thesis
1. Strong Bullish Momentum Recently
Recent candles show a series of green bullish candles with increasing size.
Indicates strong buying interest—not a sign of exhaustion, which would support further downside.
2. Volume Spike on Green Candles
Volume surged during the recent bullish candles.
This typically signals accumulation, not distribution — contradicting the bearish outlook.
3. Failure to Break Key Support
Price previously bounced sharply from below 33.0000, showing buyers defended that zone.
This bounce suggests the support is strong, weakening the argument for a move toward the lower target.
4. Reversal Pattern Possible (Double Bottom)
The chart may show early signs of a double bottom or higher low, both bullish reversal signals.
These patterns would negate the bearish projection if confirmed with a higher high.
5. Divergence from US Dollar Weakness
If the US Dollar shows weakness, silver could rally due to its inverse correlation.
The marked target may not be achieved if macro forces support precious metals.

Market next move 🔻 Disruption to Bullish Thesis
1. Resistance Zone Near Target
The "Target" area might align with a previous resistance level (historically where price has reversed or consolidated).
If price hits that zone, it could stall or reject, rather than break through.
2. Bearish Volume Divergence
While the candles are green and pushing upward, volume is not increasing significantly.
Lack of strong buying volume can suggest a weak rally — potentially a bull trap.
3. Trend Context: Larger Downtrend
The chart shows a strong prior downtrend before the recent small upward push.
This move could be a dead-cat bounce or retracement within a broader bearish move.
4. Fundamental Risk: USD Strength
If the US Dollar Index (DXY) strengthens due to macroeconomic data or Fed commentary, gold (USD-denominated) typically drops.
The calendar icons suggest upcoming US economic data, which could disrupt gold’s movement.
5. Candle Structure Shows Exhaustion
The current bullish candles are smaller compared to previous strong red ones.
This may imply momentum exhaustion before reaching the target.

CADJPY - NEW BREAKOUT !Hello Traders !
The CADJPY price formed a descending channel.
Currently, The resistance line is broken !
So, I expect a bullish move🚀
_______________
TARGET: 105.390🎯

Bearish reversal?The Loonie (USD/CAD) is rising towards the pivot and could reverse to the 1st support.
Pivot: 1.3895
1st Support: 1.3792
1st Resistance: 1.3943
Risk Warning:
Trading Forex and CFDs carries a high level of risk to your capital and you should only trade with money you can afford to lose. Trading Forex and CFDs may not be suitable for all investors, so please ensure that you fully understand the risks involved and seek independent advice if necessary.
Disclaimer:
The above opinions given constitute general market commentary, and do not constitute the opinion or advice of IC Markets or any form of personal or investment advice.
Any opinions, news, research, analyses, prices, other information, or links to third-party sites contained on this website are provided on an "as-is" basis, are intended only to be informative, is not an advice nor a recommendation, nor research, or a record of our trading prices, or an offer of, or solicitation for a transaction in any financial instrument and thus should not be treated as such. The information provided does not involve any specific investment objectives, financial situation and needs of any specific person who may receive it. Please be aware, that past performance is not a reliable indicator of future performance and/or results. Past Performance or Forward-looking scenarios based upon the reasonable beliefs of the third-party provider are not a guarantee of future performance. Actual results may differ materially from those anticipated in forward-looking or past performance statements. IC Markets makes no representation or warranty and assumes no liability as to the accuracy or completeness of the information provided, nor any loss arising from any investment based on a recommendation, forecast or any information supplied by any third-party.
