EURUSD: Rise Ahead! 🇪🇺🇺🇸
EURUSD successfully violated a significant horizontal supply area yesterday.
The broken structure and a rising trend line compose a contracting demand zone now.
It will be the area from where I will expect a rise to higher level.
The next strong resistance is 1.151
❤️Please, support my work with like, thank you!❤️
I am part of Trade Nation's Influencer program and receive a monthly fee for using their TradingView charts in my analysis.
Forexsignals

Could the Loonie reverse from here?The price is rising towards the pivot, which has been identified as a pullback resistance and could reverse to the 127.2% Fibonacci support.
Pivot: 1.3767
1st Support: 1.3634
1st Resistance: 1.3856
Risk Warning:
Trading Forex and CFDs carries a high level of risk to your capital and you should only trade with money you can afford to lose. Trading Forex and CFDs may not be suitable for all investors, so please ensure that you fully understand the risks involved and seek independent advice if necessary.
Disclaimer:
The above opinions given constitute general market commentary, and do not constitute the opinion or advice of IC Markets or any form of personal or investment advice.
Any opinions, news, research, analyses, prices, other information, or links to third-party sites contained on this website are provided on an "as-is" basis, are intended only to be informative, is not an advice nor a recommendation, nor research, or a record of our trading prices, or an offer of, or solicitation for a transaction in any financial instrument and thus should not be treated as such. The information provided does not involve any specific investment objectives, financial situation and needs of any specific person who may receive it. Please be aware, that past performance is not a reliable indicator of future performance and/or results. Past Performance or Forward-looking scenarios based upon the reasonable beliefs of the third-party provider are not a guarantee of future performance. Actual results may differ materially from those anticipated in forward-looking or past performance statements. IC Markets makes no representation or warranty and assumes no liability as to the accuracy or completeness of the information provided, nor any loss arising from any investment based on a recommendation, forecast or any information supplied by any third-party.

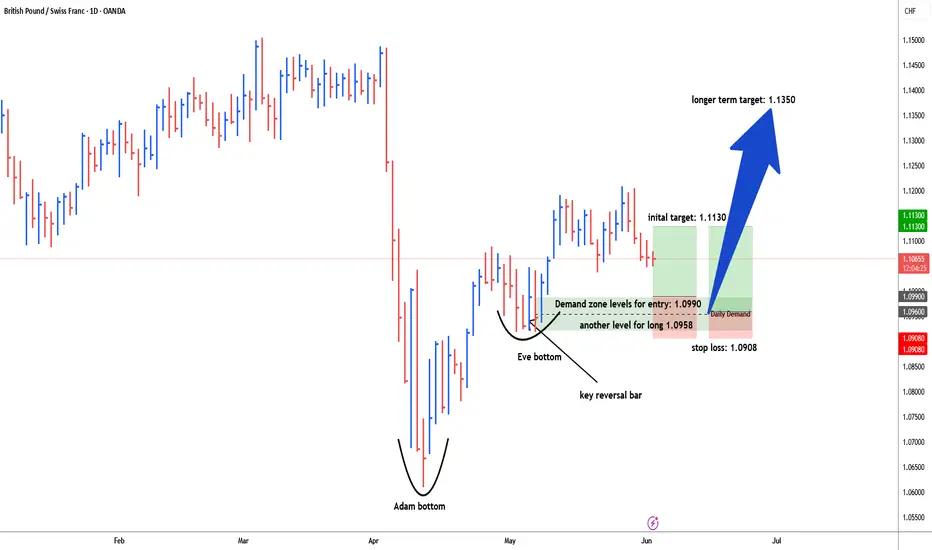
GBPCHF possible long for 1.1350gbpchf in daily timeframe chart forming higher high and higher low. in the bottm made adam bottom, demand zone levels for long are as 1.0990, 1.0960. stop loss: 1.0908. initial target: 1.1130. long term target 1.1350.
Potential bearish drop off pullback resistance?The Swissie (USD/CHF) is rising towards the pivot, which acts as a pullback resistance and could drop to the 1st support that aligns with the 78.6% Fibonacci projection.
Pivot: 0.8199
1st Support: 0.8113
1st Resistance: 0.8267
Risk Warning:
Trading Forex and CFDs carries a high level of risk to your capital and you should only trade with money you can afford to lose. Trading Forex and CFDs may not be suitable for all investors, so please ensure that you fully understand the risks involved and seek independent advice if necessary.
Disclaimer:
The above opinions given constitute general market commentary, and do not constitute the opinion or advice of IC Markets or any form of personal or investment advice.
Any opinions, news, research, analyses, prices, other information, or links to third-party sites contained on this website are provided on an "as-is" basis, are intended only to be informative, is not an advice nor a recommendation, nor research, or a record of our trading prices, or an offer of, or solicitation for a transaction in any financial instrument and thus should not be treated as such. The information provided does not involve any specific investment objectives, financial situation and needs of any specific person who may receive it. Please be aware, that past performance is not a reliable indicator of future performance and/or results. Past Performance or Forward-looking scenarios based upon the reasonable beliefs of the third-party provider are not a guarantee of future performance. Actual results may differ materially from those anticipated in forward-looking or past performance statements. IC Markets makes no representation or warranty and assumes no liability as to the accuracy or completeness of the information provided, nor any loss arising from any investment based on a recommendation, forecast or any information supplied by any third-party.

Bearish reversal off 50% Fibonacci resistance?USD/JPY is rising towards the pivot, which aligns with the 50% Fibonacci retracement and could reverse to the 1st support, a pullback level.
Pivot: 144.37
1st Support: 141.94
1st Resistance: 146.17
Risk Warning:
Trading Forex and CFDs carries a high level of risk to your capital and you should only trade with money you can afford to lose. Trading Forex and CFDs may not be suitable for all investors, so please ensure that you fully understand the risks involved and seek independent advice if necessary.
Disclaimer:
The above opinions given constitute general market commentary, and do not constitute the opinion or advice of IC Markets or any form of personal or investment advice.
Any opinions, news, research, analyses, prices, other information, or links to third-party sites contained on this website are provided on an "as-is" basis, are intended only to be informative, is not an advice nor a recommendation, nor research, or a record of our trading prices, or an offer of, or solicitation for a transaction in any financial instrument and thus should not be treated as such. The information provided does not involve any specific investment objectives, financial situation and needs of any specific person who may receive it. Please be aware, that past performance is not a reliable indicator of future performance and/or results. Past Performance or Forward-looking scenarios based upon the reasonable beliefs of the third-party provider are not a guarantee of future performance. Actual results may differ materially from those anticipated in forward-looking or past performance statements. IC Markets makes no representation or warranty and assumes no liability as to the accuracy or completeness of the information provided, nor any loss arising from any investment based on a recommendation, forecast or any information supplied by any third-party.

GBPJPYGBPJPY price has a chance to test the support zone 192.349-192.002. If the price cannot break through the 192.002 level, it is expected that in the short term, there is a chance that the price will rebound. Consider buying the red zone.
🔥Trading futures, forex, CFDs and stocks carries a risk of loss.
Please consider carefully whether such trading is suitable for you.
>>GooD Luck 😊
❤️ Like and subscribe to never miss a new idea!

Bullish bounce off pullback support?The Fiber (EUR/USD) is falling towards the pivot and could bounce to the 1st resistance.
Pivot: 1.1367
1st Support: 1.1278
1st Resistance: 1.1475
Risk Warning:
Trading Forex and CFDs carries a high level of risk to your capital and you should only trade with money you can afford to lose. Trading Forex and CFDs may not be suitable for all investors, so please ensure that you fully understand the risks involved and seek independent advice if necessary.
Disclaimer:
The above opinions given constitute general market commentary, and do not constitute the opinion or advice of IC Markets or any form of personal or investment advice.
Any opinions, news, research, analyses, prices, other information, or links to third-party sites contained on this website are provided on an "as-is" basis, are intended only to be informative, is not an advice nor a recommendation, nor research, or a record of our trading prices, or an offer of, or solicitation for a transaction in any financial instrument and thus should not be treated as such. The information provided does not involve any specific investment objectives, financial situation and needs of any specific person who may receive it. Please be aware, that past performance is not a reliable indicator of future performance and/or results. Past Performance or Forward-looking scenarios based upon the reasonable beliefs of the third-party provider are not a guarantee of future performance. Actual results may differ materially from those anticipated in forward-looking or past performance statements. IC Markets makes no representation or warranty and assumes no liability as to the accuracy or completeness of the information provided, nor any loss arising from any investment based on a recommendation, forecast or any information supplied by any third-party.

Bearish drop?US Dollar Index (DXY) is risng towards the pivot and could reverse to the 1st support.
Pivot: 99.10
1st Support: 98.01
1st Resistance: 99.94
Risk Warning:
Trading Forex and CFDs carries a high level of risk to your capital and you should only trade with money you can afford to lose. Trading Forex and CFDs may not be suitable for all investors, so please ensure that you fully understand the risks involved and seek independent advice if necessary.
Disclaimer:
The above opinions given constitute general market commentary, and do not constitute the opinion or advice of IC Markets or any form of personal or investment advice.
Any opinions, news, research, analyses, prices, other information, or links to third-party sites contained on this website are provided on an "as-is" basis, are intended only to be informative, is not an advice nor a recommendation, nor research, or a record of our trading prices, or an offer of, or solicitation for a transaction in any financial instrument and thus should not be treated as such. The information provided does not involve any specific investment objectives, financial situation and needs of any specific person who may receive it. Please be aware, that past performance is not a reliable indicator of future performance and/or results. Past Performance or Forward-looking scenarios based upon the reasonable beliefs of the third-party provider are not a guarantee of future performance. Actual results may differ materially from those anticipated in forward-looking or past performance statements. IC Markets makes no representation or warranty and assumes no liability as to the accuracy or completeness of the information provided, nor any loss arising from any investment based on a recommendation, forecast or any information supplied by any third-party.

EURGBPEURGBP price is near the support zone 0.83605-0.83262. If the price cannot break through the 0.83262 level, it is expected that in the short term there is a chance that the price will rebound. Consider buying the red zone.
🔥Trading futures, forex, CFDs and stocks carries a risk of loss.
Please consider carefully whether such trading is suitable for you.
>>GooD Luck 😊
❤️ Like and subscribe to never miss a new idea!

Market next move ⚠️ Disruption of the Bullish Analysis:
1. Weak Support Zone
The highlighted support area is not strongly tested (only a couple of candles touch it).
Low volume around support may indicate lack of buying interest at that level.
If price breaks below this support, the bullish setup becomes invalid.
2. Bearish Volume Spike
There's a noticeable high volume red candle during the recent drop.
This could imply strong selling pressure, not just profit-taking.
Rising volume on red candles often precedes further downside.
3. Lower High Formation
The price may create a lower high near the projected bounce zone.
If that happens, the market structure would shift to bearish.
A lower high and a break below support confirms a downtrend.
Bullish bounce off pullback support?USD/JPY has bounced off the support level which is a pullback support that lines up with the 61.8% Fibonacci projection and could rise from this level to our take profit.
Entry: 142.27
Why we like it:
There is a pullback support level that lines up with the 61.8% Fibonacci projection.
Stop loss: 141.62
Why we like it:
There is a pullback support level.
Take profit: 144.05
Why we like it:
There is a pullback resistance that lines up with the 38.25 fibonacci retracement.
Enjoying your TradingView experience? Review us!
Please be advised that the information presented on TradingView is provided to Vantage (‘Vantage Global Limited’, ‘we’) by a third-party provider (‘Everest Fortune Group’). Please be reminded that you are solely responsible for the trading decisions on your account. There is a very high degree of risk involved in trading. Any information and/or content is intended entirely for research, educational and informational purposes only and does not constitute investment or consultation advice or investment strategy. The information is not tailored to the investment needs of any specific person and therefore does not involve a consideration of any of the investment objectives, financial situation or needs of any viewer that may receive it. Kindly also note that past performance is not a reliable indicator of future results. Actual results may differ materially from those anticipated in forward-looking or past performance statements. We assume no liability as to the accuracy or completeness of any of the information and/or content provided herein and the Company cannot be held responsible for any omission, mistake nor for any loss or damage including without limitation to any loss of profit which may arise from reliance on any information supplied by Everest Fortune Group.

Bearish reversal off 50% Fibonacci resistance?USD/CHF is rising towards the resistance level which is an overlap resistance that lines up with the 50% Fibonacci retracement and could reverse from this level to our take profit.
Entry: 0.8251
Why we like it:
There is an overlap resistance level that lines up with the 50% Fibonacci retracement.
Stop loss: 0.8313
Why we like it:
There is a pullback resistance level that lines up with the 78.6% Fibonacci retracement.
Take profit: 0.8112
Why we like it:
There is a pullback support level that aligns with the 78.6% Fibonacci projection.
Enjoying your TradingView experience? Review us!
Please be advised that the information presented on TradingView is provided to Vantage (‘Vantage Global Limited’, ‘we’) by a third-party provider (‘Everest Fortune Group’). Please be reminded that you are solely responsible for the trading decisions on your account. There is a very high degree of risk involved in trading. Any information and/or content is intended entirely for research, educational and informational purposes only and does not constitute investment or consultation advice or investment strategy. The information is not tailored to the investment needs of any specific person and therefore does not involve a consideration of any of the investment objectives, financial situation or needs of any viewer that may receive it. Kindly also note that past performance is not a reliable indicator of future results. Actual results may differ materially from those anticipated in forward-looking or past performance statements. We assume no liability as to the accuracy or completeness of any of the information and/or content provided herein and the Company cannot be held responsible for any omission, mistake nor for any loss or damage including without limitation to any loss of profit which may arise from reliance on any information supplied by Everest Fortune Group.

EUR/USD Forecast: Impulse Wave Progressing TowardThe EUR/USD is currently exhibiting a well-defined impulsive structure following the completion of a corrective (ABC) phase. The market has successfully formed waves (1) and (2), and is now advancing within wave (3), which typically carries the most momentum in an Elliott Wave cycle.
The ongoing rally suggests wave (3) is targeting the 1.15350 level — a key Fibonacci projection area that aligns with previous structural resistance. Momentum remains strong, supported by bullish market structure and sustained buying pressure.
Should wave (3) conclude near this zone, a brief corrective pullback into wave (4) is anticipated, likely retracing toward the 1.14440–1.14730 support range. This would offer a potential entry opportunity before the market resumes its higher trajectory in wave (5), targeting the 1.16077 level.
T1: 1.14857
T2: 1.15090
SL: 1.13867

GBPJPY Potential UpsidesHey Traders, in the coming week we are monitoring GBPJPY for a buying opportunity around 193.300 zone, GBPJPY is trading in an uptrend and currently is in a correction phase in which it is approaching the trend at 193.300 support and resistance area.
Trade safe, Joe.

NZDUSD Potential UpsidesHey Traders, in today's trading we are monitoring NZDUSD for a buying opportunity around 0.59400 zone, NZDUSD is trading in an uptrend and currently is in a correction phase in which it is approaching the trend at 0.59400 support and resistance area.
Trade safe, Joe.

Potential bearish drop?GBP/USD has rejected off the reistance level which is a pullback resistance and could drop from this level to our take profit.
Entry: 1.3551
Why we like it:
There is a pullback resistance level.
Stop loss: 1.3590
Why we like it:
There is a pullback resistance level.
Take profit: 1.3446
Why we like it:
There is an overlap support level.
Enjoying your TradingView experience? Review us!
Please be advised that the information presented on TradingView is provided to Vantage (‘Vantage Global Limited’, ‘we’) by a third-party provider (‘Everest Fortune Group’). Please be reminded that you are solely responsible for the trading decisions on your account. There is a very high degree of risk involved in trading. Any information and/or content is intended entirely for research, educational and informational purposes only and does not constitute investment or consultation advice or investment strategy. The information is not tailored to the investment needs of any specific person and therefore does not involve a consideration of any of the investment objectives, financial situation or needs of any viewer that may receive it. Kindly also note that past performance is not a reliable indicator of future results. Actual results may differ materially from those anticipated in forward-looking or past performance statements. We assume no liability as to the accuracy or completeness of any of the information and/or content provided herein and the Company cannot be held responsible for any omission, mistake nor for any loss or damage including without limitation to any loss of profit which may arise from reliance on any information supplied by Everest Fortune Group.

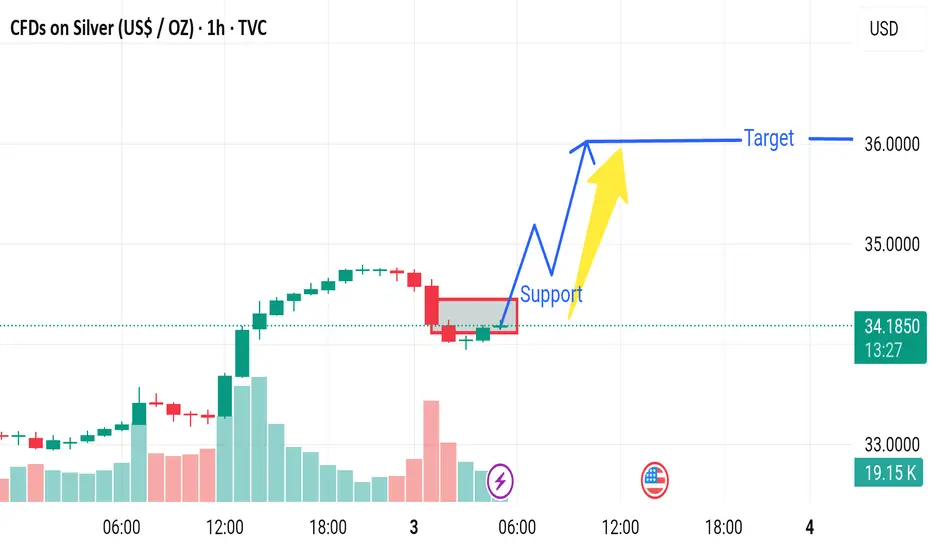
Market next target 🟢 Disruptive Bullish Scenario:
🔁 1. Healthy Bull Flag or Consolidation
The steep rally (+4.5%) may not lead to a breakdown.
The current pause near $34.50 could be a bull flag or tight range consolidation, common in continuation patterns.
🔼 2. Volume Supports the Move
Notice the strong rising volume on the breakout candles.
This shows genuine buyer interest, not a pump-and-dump move.
🧲 3. Breakout Holding Above Previous Highs
Price is holding above previous resistance, which now acts as support around $34.00–$34.20.
Holding this zone can lead to a retest and breakout to new highs.
📈 4. Strong Macro Bullish Catalyst
The U.S. event icon suggests important data is near.
If the data (like weaker dollar or inflation concerns) supports metals, Silver could surge further rather than drop.
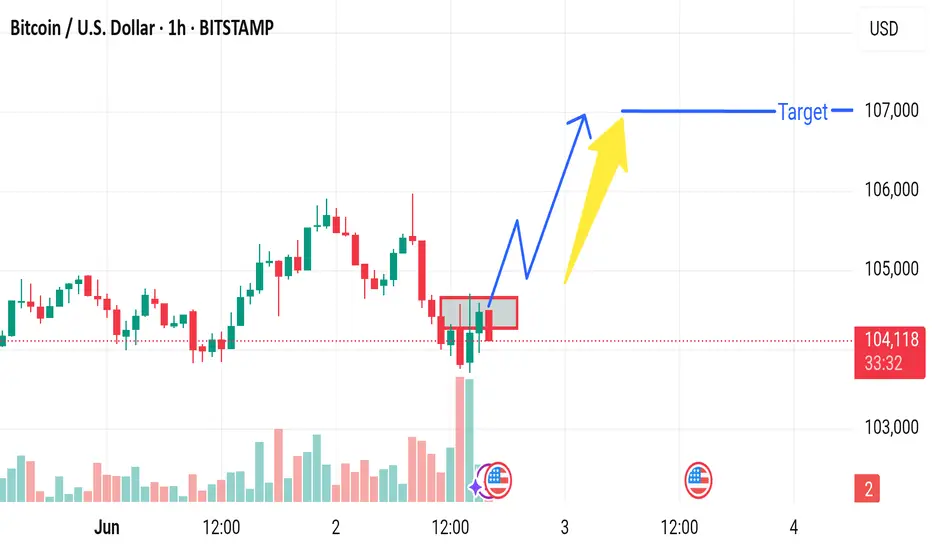
Market next target 🟢 1. Strong Support Zone Nearby
The region around $103,500–$104,000 has acted as a strong demand zone historically (look left).
BTC might bounce from this level instead of continuing the downtrend.
---
🔄 2. Consolidation, Not Breakdown
The price action appears more sideways/choppy than strongly bearish.
Without a clean breakdown candle below key support, this might be accumulation, not distribution.
---
📉 3. Bearish Momentum Weakness
Volume on the recent red candles is not significantly increasing.
This implies lack of strong conviction from sellers.

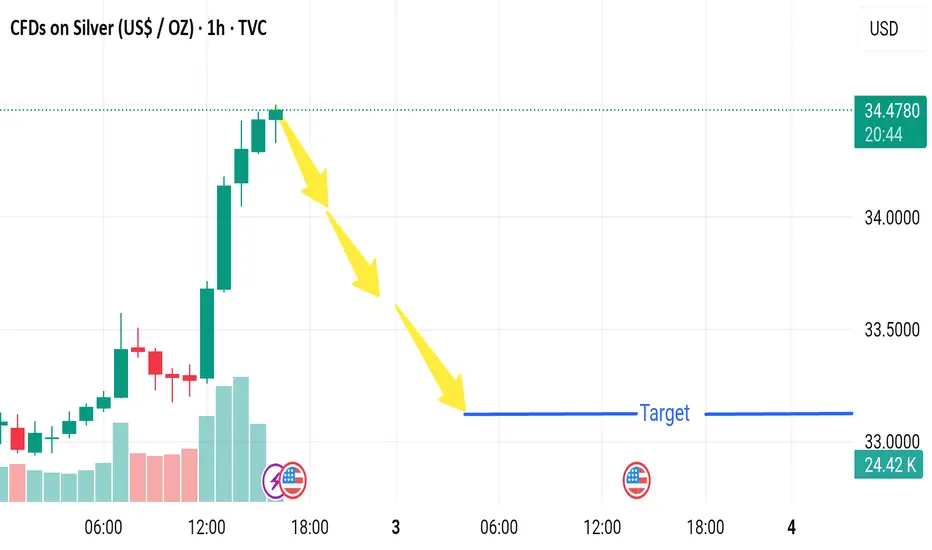
Market next move 1. Bearish Rejection Zone
The red box highlights a consolidation/resistance zone.
BTC is struggling to break and close above this area.
Multiple candle wicks into the zone suggest seller strength.
---
📉 2. Volume Weakness
The recent upward candles show lower volume compared to the selling candles before it.
This indicates that the buying pressure may be weak, lacking momentum for a breakout.
---
🕳️ 3. False Breakout Trap Risk
A fakeout above the resistance box is possible if big players trigger buy orders and then reverse the market, trapping retail traders.
---
🟠 4. Bearish Divergence (if confirmed by RSI or MACD)
Without indicators shown, if momentum indicators like RSI/MACD display divergence (price up but momentum down), it’s a bearish signal.
TONCOIN Hits First Target with 27% Gain – More Upside Ahead?By examining the #TONCOIN chart on the 3-day timeframe, we can see that after the last analysis, the price successfully hit the $3.64 target and has gained a total of 27%. Following this rise, the price entered a corrective phase and is currently trading around $3.15. The analysis remains valid, and I still expect further upside from this cryptocurrency. The expected return is around 20% in the short term, 40% to 55% in the medium term, and 110% in the long term.
Please support me with your likes and comments to motivate me to share more analysis with you and share your opinion about the possible trend of this chart with me !
Best Regards , Arman Shaban

DXY Short-Term Reversal Zone in SightUS Dollar Index (DXY) is approaching a strong support zone at 98.90–98.00, which has historically acted as a base for bullish reversals. The price is now testing the lower bound of this zone after a steady downtrend from the 101.94 high.
Key Technical Structure:
Support Zone: 98.90–98.00 (tested 3+ times)
Double Bottom Potential forming if bulls hold the zone
Upside Targets:
101.94: Key horizontal resistance
103.50: Swing high from early April
Scenarios to Watch:
🔹 Bullish Rebound:
Price bounces off 98.90–98.00 support
Confirmation: Break and close above 100.50 near-term resistance
Could fuel move back to 101.94, possibly 103.50
🔹 Bearish Breakdown:
Daily close below 98.00 would invalidate bullish setup
Opens downside to 97.00 and even 95.50
Macro Drivers to Watch:
FOMC speakers and interest rate guidance
US jobless claims or inflation surprise
Risk-off sentiment (benefits USD) vs. continued global risk appetite
Conclusion:
DXY is trading at a make-or-break support zone. Watch for clear bullish reaction or bearish breakdown before committing. The setup favors a bounce unless 98.00 fails.

EURUSD Channel Up targeting 1.15000.The EURUSD pair just broke above the Resistance 1 level (1.14250) confirming the extension of the current Bullish Leg of the short-term Channel Up.
With their 4H RSI patterns very similar, the previous Bullish Leg rose by +2.58% before a pull-back to the 4H MA50 (blue trend-line). That gives us a potential Target of 1.15000 on the short-term.
-------------------------------------------------------------------------------
** Please LIKE 👍, FOLLOW ✅, SHARE 🙌 and COMMENT ✍ if you enjoy this idea! Also share your ideas and charts in the comments section below! This is best way to keep it relevant, support us, keep the content here free and allow the idea to reach as many people as possible. **
-------------------------------------------------------------------------------
Disclosure: I am part of Trade Nation's Influencer program and receive a monthly fee for using their TradingView charts in my analysis.
💸💸💸💸💸💸
👇 👇 👇 👇 👇 👇

As expected the price surged upward.🔥 Gold Market Update 🔥
The gold market has shown a powerful and impressive move, exactly as we had predicted earlier! 📈
As expected, the price surged upward — a perfect reflection of our previous analysis. ✅
📉 Current Scenario:
Despite the recent spike, the market is still trading in a bearish zone.
We recommend waiting patiently for a clean break above $3360, along with a confirmed candle close above that level.
💡 If this happens, we can expect the market to turn strongly bullish and potentially target higher resistance levels.
However, if $3360 fails to break, then a retracement is likely, giving traders another opportunity to re-enter.
⏳ Stay alert, follow the levels, and trade smartly — big moves could be just around the corner!
DYOR! Not Financial Advice.
