XAU/USD Buy Setup Explanation (Using Fibonacci Levels)This chart presents a bullish trading setup on gold (XAU/USD) based on a Fibonacci retracement strategy. It suggests a buy opportunity after a pullback.
✅ Fibonacci Levels:
> 0.0% (Top): $3,331 – recent swing high (used as reference)
> 23.6%: $3,312 – minor resistance zone
> 38.2%: $3,297 – initial pullback area
> 50.0%: $3,290 – psychological mid-level
> 61.8% (Golden Ratio): $3,280 – key Fibonacci support
> 78.6%: $3,266 – deeper retracement support
> 100% (Bottom): $3,249 – recent swing low
🟪 Buy Zone (Between 50% and 61.8%):
The marked BUY ZONE is between $3,290 and $3,280, aligning with the Fibonacci golden pocket.
This is a high-probability reversal area, as it combines:
Strong Fibonacci confluence (50%–61.8%)
Prior price reaction zones (structure-based support)
: TP1: $3,320 – aligns with previous structure zone and 23.6% retracement.
: Final Target: $3,350 – a retest of the major resistance and previous high.
📌 Conclusion:
This is a classic Fibonacci retracement long setup:
Wait for a bullish reversal pattern (e.g., pin bar, engulfing) in the buy zone.
As long as the price holds above $3,266, the bullish structure remains valid.
Ideal for swing traders looking to catch a bounce off the golden ratio support.
Forexsignals

GBPUSD Holds Above 1.34 – Is 1.35 the Launch Pad?In last week’s GBPUSD outlook, I pointed to the 1.34 zone as a potential buy area and likely end of the correction.
The market reacted as expected, reversing from 1.34 and rallying to 1.35. Toward the end of the week, a brief correction followed — but price held above 1.34 and has now returned to 1.35, printing a higher low in the process.
📌 From both a technical and psychological standpoint, 1.35 remains a key level. A confirmed break above could lead to a retest of the recent high — or even push for a new high.
✅ My bias stays bullish as long as 1.34 support remains intact.
Disclosure: I am part of TradeNation's Influencer program and receive a monthly fee for using their TradingView charts in my analyses and educational articles.

Market next target 🔍 Original Analysis Summary:
Bearish Outlook: Price is expected to decline from the recent high.
Support Level: Identified near 1.34400.
Target Zone: Around 1.34200 based on breakdown expectations.
Reasoning: Possibly based on rejection near resistance and anticipation of bearish follow-through.
---
⚠️ Disruption (Bullish/Neutral Counter-Scenario):
1. Strong Bullish Candle at Resistance
The last candle is a bullish engulfing near recent highs, indicating buyer strength.
Rather than rejecting, price appears to break out of consolidation.
---
2. Volume Supporting Bullish Momentum
Increasing green volume bars show accumulating demand, not weakness.
Could imply a liquidity grab before a bullish continuation.
---
3. Failed Breakdown Attempts
Price has attempted to fall multiple times (wicks downward), but was bought up quickly.
That often signals trap setups where short sellers are being baited.
---
4. Macro Sentiment / USD Weakness Risk
With upcoming U.S. economic news (red circle), any sign of a weaker USD could invalidate the bearish scenario entirely.
GBP tends to benefit from any shift in U.S. interest rate expectations or economic softness.

EURUSD Forms Rising Wedge + Evening Star_ Bearish SetupAs I expected in the previous idea , the EURUSD ( FX:EURUSD ) started to rise after breaking the upper line of the descending channel and hit the Long Position target with Risk-To-Reward: 1.46 .
The EURUSD is trading near the Resistance zone($1.149-$1.142) .
From a Classic Technical perspective, EURUSD appears to be completing a Rising Wedge Reversal Pattern . Also, a good sign for a EURUSD reversal is the formation of an Evening Star Candlestick Pattern near the upper line of the rising wedge pattern.
Also, we can see the Regular Divergence(RD-) between Consecutive Peaks .
In terms of Elliott Wave theory , I think the EURUSD corrective waves are NOT over yet, and it seems that EURUSD has completed the main wave X inside the rising wedge pattern.
I expect EURUSD to decline to at least $1.126 AFTER breaking the lower line of the wedge pattern.
Note: If EURUSD touches $1.14903 , we can expect more pump.
Please respect each other's ideas and express them politely if you agree or disagree.
Euro/U.S. Dollar Analyze (EURUSD), 4-hour time frame.
Be sure to follow the updated ideas.
Do not forget to put a Stop loss for your positions (For every position you want to open).
Please follow your strategy and updates; this is just my Idea, and I will gladly see your ideas in this post.
Please do not forget the ✅' like '✅ button 🙏😊 & Share it with your friends; thanks, and Trade safe.

Market next move 🔍 Original Analysis Summary:
Bearish Setup: Price is expected to break down from the small consolidation area (highlighted in red box).
Projection: A drop toward the lower target zone (~1.13200–1.13300).
Trigger: Likely based on rejection from minor resistance and upcoming U.S. economic data (flag icons).
---
⚠️ Disruption (Bullish/Neutral Counter-View):
1. Support Holding Firm
The price has tested the red box area multiple times without a clear breakdown.
This could signal strong demand/support around 1.13600, invalidating the bearish momentum.
---
2. Volume Spike on Bullish Candles
Notable bullish volume spikes suggest buyers are stepping in at current levels, defending support.
---
3. Potential Bullish Reversal Pattern
The red box resembles a bullish flag or rectangle, often a continuation pattern — not necessarily a bearish signal.
If price breaks above 1.13700, it may trigger buy stop orders, fueling a rally.
---
4. Favorable Euro Fundamentals
The eurozone flag icon suggests EU news is also pending. If this is hawkish or better than expected, EUR/USD could rally sharply, invalidating the bearish outlook.

Market next target 🔍 Original Analysis Summary:
Bullish Continuation is expected.
Price is projected to rise with a series of higher highs (yellow arrows).
Target area is marked above 34.000 USD.
---
⚠️ Disruption (Bearish/Neutral Counter-View):
1. Flat Consolidation Zone = Distribution Risk
Price has been moving sideways in a tight range (approx. 32.90–33.15), indicating indecision.
This could be a distribution phase, where smart money sells into retail bullishness.
---
2. Weak Volume Profile
Volume is relatively low and not increasing with attempted bullish moves.
A strong breakout should be backed by volume, but current price action lacks conviction.
---
3. False Breakout Trap Risk
Price is testing the upper boundary of a range.
A small push higher could be a bull trap, especially if it reverses back inside the range — a common fake-out setup.

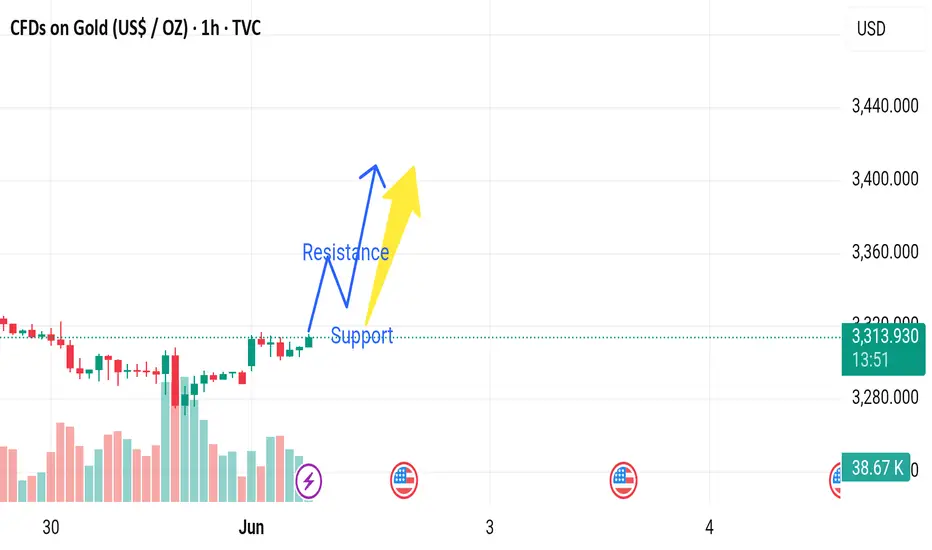
Market next move 🔍 Original Analysis Summary:
Bullish Bias: The analysis suggests a breakout above the current level, with price bouncing off "support" and targeting higher levels beyond the marked "resistance."
Expectation: Higher highs post-breakout.
---
⚠️ Disruption (Bearish/Neutral Counter-View):
1. Low Volume on Recent Push
Recent bullish candles have declining volume, signaling potential weak buying pressure.
This divergence could imply that buyers are losing interest or that the rally is unsustainable.
2. Flat Resistance Zone
The price is struggling to break above the 3,315–3,320 level, suggesting strong selling pressure.
Multiple rejections at the same level could form a double top, a bearish reversal pattern.
3. Lower Highs from May 30 Peak
While the price is rising, it's still below the highs made on May 30, indicating the uptrend might be weakening.
4. Bearish Divergence (Hypothetical)
If RSI or MACD were plotted, a bearish divergence (price rising, but momentum indicators falling) might be present — often a precursor to a reversal.
5. Fundamental Risk: U.S. Data (Flagged)
The U.S. flag icon signals upcoming economic news. If positive, it could strengthen the USD, pushing gold lower.
Volatility around this time might invalidate the bullish setup.
Bullish bounce?NZD/USD is has bounced off the support level which is a pullback support and could rise from this level to our take profit.
Entry: 0.5931
Why we like it:
There is a pullback support level.
Stop loss: 0.5898
Why we like it:
There is a pullback support level.
Take profit: 0.6017
Why we like it:
There is a pullback resistance level.
Enjoying your TradingView experience? Review us!
Please be advised that the information presented on TradingView is provided to Vantage (‘Vantage Global Limited’, ‘we’) by a third-party provider (‘Everest Fortune Group’). Please be reminded that you are solely responsible for the trading decisions on your account. There is a very high degree of risk involved in trading. Any information and/or content is intended entirely for research, educational and informational purposes only and does not constitute investment or consultation advice or investment strategy. The information is not tailored to the investment needs of any specific person and therefore does not involve a consideration of any of the investment objectives, financial situation or needs of any viewer that may receive it. Kindly also note that past performance is not a reliable indicator of future results. Actual results may differ materially from those anticipated in forward-looking or past performance statements. We assume no liability as to the accuracy or completeness of any of the information and/or content provided herein and the Company cannot be held responsible for any omission, mistake nor for any loss or damage including without limitation to any loss of profit which may arise from reliance on any information supplied by Everest Fortune Group.

Bullish bounce?USD/JPY is falling towards the support level which id a pullback support that lines up with the 71% Fibonacci retracement and could bounce from this level to our take profit.
Entry: 143.29
Why we lke it:
There is a pullback support level that aligns with the 71% Fibonacci retracement.
Stop loss:142.36
Why we like it:
There is a pullback support level that lines up with the 61.8% Fibonacci projection.
Take profit: 145.88
Why we like it:
There is a pullback resistance level.
Enjoying your TradingView experience? Review us!
Please be advised that the information presented on TradingView is provided to Vantage (‘Vantage Global Limited’, ‘we’) by a third-party provider (‘Everest Fortune Group’). Please be reminded that you are solely responsible for the trading decisions on your account. There is a very high degree of risk involved in trading. Any information and/or content is intended entirely for research, educational and informational purposes only and does not constitute investment or consultation advice or investment strategy. The information is not tailored to the investment needs of any specific person and therefore does not involve a consideration of any of the investment objectives, financial situation or needs of any viewer that may receive it. Kindly also note that past performance is not a reliable indicator of future results. Actual results may differ materially from those anticipated in forward-looking or past performance statements. We assume no liability as to the accuracy or completeness of any of the information and/or content provided herein and the Company cannot be held responsible for any omission, mistake nor for any loss or damage including without limitation to any loss of profit which may arise from reliance on any information supplied by Everest Fortune Group.

Potential bearish drop?GBP/USD has reacted off the resistance level which is a pullback resistance that lines up with the 50% Fibonacci retracement and could drop from this level to our take profit.
Entry: 1.3346
Why we like it:
There is a pullback resistance level that aligns with the 50% Fibonacci retracement.
Stop loss: 1.3591
Why we like it:
There is a pullback resistance level.
Take profit: 1.3346
Why we like it:
There is a pullback support level that lines up with the 50% Fibonacci retracement.
Enjoying your TradingView experience? Review us!
Please be advised that the information presented on TradingView is provided to Vantage (‘Vantage Global Limited’, ‘we’) by a third-party provider (‘Everest Fortune Group’). Please be reminded that you are solely responsible for the trading decisions on your account. There is a very high degree of risk involved in trading. Any information and/or content is intended entirely for research, educational and informational purposes only and does not constitute investment or consultation advice or investment strategy. The information is not tailored to the investment needs of any specific person and therefore does not involve a consideration of any of the investment objectives, financial situation or needs of any viewer that may receive it. Kindly also note that past performance is not a reliable indicator of future results. Actual results may differ materially from those anticipated in forward-looking or past performance statements. We assume no liability as to the accuracy or completeness of any of the information and/or content provided herein and the Company cannot be held responsible for any omission, mistake nor for any loss or damage including without limitation to any loss of profit which may arise from reliance on any information supplied by Everest Fortune Group.

Falling towards overlap support?The Loonie (USD/CAD) is falling towards the pivot, which has been identified as an overlap support and could bounce to the 1st resistance, which is a pullback resistance.
Pivot: 1.3602
1st Support: 1.3420
1st Resistance: 1.3843
Risk Warning:
Trading Forex and CFDs carries a high level of risk to your capital and you should only trade with money you can afford to lose. Trading Forex and CFDs may not be suitable for all investors, so please ensure that you fully understand the risks involved and seek independent advice if necessary.
Disclaimer:
The above opinions given constitute general market commentary, and do not constitute the opinion or advice of IC Markets or any form of personal or investment advice.
Any opinions, news, research, analyses, prices, other information, or links to third-party sites contained on this website are provided on an "as-is" basis, are intended only to be informative, is not an advice nor a recommendation, nor research, or a record of our trading prices, or an offer of, or solicitation for a transaction in any financial instrument and thus should not be treated as such. The information provided does not involve any specific investment objectives, financial situation and needs of any specific person who may receive it. Please be aware, that past performance is not a reliable indicator of future performance and/or results. Past Performance or Forward-looking scenarios based upon the reasonable beliefs of the third-party provider are not a guarantee of future performance. Actual results may differ materially from those anticipated in forward-looking or past performance statements. IC Markets makes no representation or warranty and assumes no liability as to the accuracy or completeness of the information provided, nor any loss arising from any investment based on a recommendation, forecast or any information supplied by any third-party.

Could the Swissie bounce from here?The price is reacting off the pivot and could bounce to the 1st resistance, which is a pullback resistance that lines up with the 61.8% Fibonacci projection.
Pivot: 0.8193
1st Support: 0.8047
1st Resistance: 0.8457
Risk Warning:
Trading Forex and CFDs carries a high level of risk to your capital and you should only trade with money you can afford to lose. Trading Forex and CFDs may not be suitable for all investors, so please ensure that you fully understand the risks involved and seek independent advice if necessary.
Disclaimer:
The above opinions given constitute general market commentary, and do not constitute the opinion or advice of IC Markets or any form of personal or investment advice.
Any opinions, news, research, analyses, prices, other information, or links to third-party sites contained on this website are provided on an "as-is" basis, are intended only to be informative, is not an advice nor a recommendation, nor research, or a record of our trading prices, or an offer of, or solicitation for a transaction in any financial instrument and thus should not be treated as such. The information provided does not involve any specific investment objectives, financial situation and needs of any specific person who may receive it. Please be aware, that past performance is not a reliable indicator of future performance and/or results. Past Performance or Forward-looking scenarios based upon the reasonable beliefs of the third-party provider are not a guarantee of future performance. Actual results may differ materially from those anticipated in forward-looking or past performance statements. IC Markets makes no representation or warranty and assumes no liability as to the accuracy or completeness of the information provided, nor any loss arising from any investment based on a recommendation, forecast or any information supplied by any third-party.

Bullish bounce off pullback support?USD/JPY is falling towards the pivot which acts as a pullback support and could bounce to the 1st resistance.
Pivot: 141.94
1st Support: 140.24
1st Resistance: 148.56
,Risk Warning:
Trading Forex and CFDs carries a high level of risk to your capital and you should only trade with money you can afford to lose. Trading Forex and CFDs may not be suitable for all investors, so please ensure that you fully understand the risks involved and seek independent advice if necessary.
Disclaimer:
The above opinions given constitute general market commentary, and do not constitute the opinion or advice of IC Markets or any form of personal or investment advice.
Any opinions, news, research, analyses, prices, other information, or links to third-party sites contained on this website are provided on an "as-is" basis, are intended only to be informative, is not an advice nor a recommendation, nor research, or a record of our trading prices, or an offer of, or solicitation for a transaction in any financial instrument and thus should not be treated as such. The information provided does not involve any specific investment objectives, financial situation and needs of any specific person who may receive it. Please be aware, that past performance is not a reliable indicator of future performance and/or results. Past Performance or Forward-looking scenarios based upon the reasonable beliefs of the third-party provider are not a guarantee of future performance. Actual results may differ materially from those anticipated in forward-looking or past performance statements. IC Markets makes no representation or warranty and assumes no liability as to the accuracy or completeness of the information provided, nor any loss arising from any investment based on a recommendation, forecast or any information supplied by any third-party.

Falling towards 61.8% Fibonacci support?The Cable (GBP/USD) is falling towards the pivot and could bounce to the 1st resistance, which is a pullback resistance.
Pivot: 1.3314
1st Support: 1.3159
1st Resistance: 1.3566
Risk Warning:
Trading Forex and CFDs carries a high level of risk to your capital and you should only trade with money you can afford to lose. Trading Forex and CFDs may not be suitable for all investors, so please ensure that you fully understand the risks involved and seek independent advice if necessary.
Disclaimer:
The above opinions given constitute general market commentary, and do not constitute the opinion or advice of IC Markets or any form of personal or investment advice.
Any opinions, news, research, analyses, prices, other information, or links to third-party sites contained on this website are provided on an "as-is" basis, are intended only to be informative, is not an advice nor a recommendation, nor research, or a record of our trading prices, or an offer of, or solicitation for a transaction in any financial instrument and thus should not be treated as such. The information provided does not involve any specific investment objectives, financial situation and needs of any specific person who may receive it. Please be aware, that past performance is not a reliable indicator of future performance and/or results. Past Performance or Forward-looking scenarios based upon the reasonable beliefs of the third-party provider are not a guarantee of future performance. Actual results may differ materially from those anticipated in forward-looking or past performance statements. IC Markets makes no representation or warranty and assumes no liability as to the accuracy or completeness of the information provided, nor any loss arising from any investment based on a recommendation, forecast or any information supplied by any third-party.

Bearish reversal off pullback resistance?The Fiber (EUR/USD) is rising towards the pivot, which is a pullback resistance, and could drop to the 1st support, which is a pullback support.
Pivot: 1.1521
1st Support: 1.1065
1st Resistance: 1.1665
Risk Warning:
Trading Forex and CFDs carries a high level of risk to your capital and you should only trade with money you can afford to lose. Trading Forex and CFDs may not be suitable for all investors, so please ensure that you fully understand the risks involved and seek independent advice if necessary.
Disclaimer:
The above opinions given constitute general market commentary, and do not constitute the opinion or advice of IC Markets or any form of personal or investment advice.
Any opinions, news, research, analyses, prices, other information, or links to third-party sites contained on this website are provided on an "as-is" basis, are intended only to be informative, is not an advice nor a recommendation, nor research, or a record of our trading prices, or an offer of, or solicitation for a transaction in any financial instrument and thus should not be treated as such. The information provided does not involve any specific investment objectives, financial situation and needs of any specific person who may receive it. Please be aware, that past performance is not a reliable indicator of future performance and/or results. Past Performance or Forward-looking scenarios based upon the reasonable beliefs of the third-party provider are not a guarantee of future performance. Actual results may differ materially from those anticipated in forward-looking or past performance statements. IC Markets makes no representation or warranty and assumes no liability as to the accuracy or completeness of the information provided, nor any loss arising from any investment based on a recommendation, forecast or any information supplied by any third-party.

Bearish drop?Ethereum (ETH/USD) has rejected off the pivot and could drop to the 1st support.
Pivot: 2,687.43
1st Support: 2,304.68
1st Resistance: 2,856.33
Risk Warning:
Trading Forex and CFDs carries a high level of risk to your capital and you should only trade with money you can afford to lose. Trading Forex and CFDs may not be suitable for all investors, so please ensure that you fully understand the risks involved and seek independent advice if necessary.
Disclaimer:
The above opinions given constitute general market commentary, and do not constitute the opinion or advice of IC Markets or any form of personal or investment advice.
Any opinions, news, research, analyses, prices, other information, or links to third-party sites contained on this website are provided on an "as-is" basis, are intended only to be informative, is not an advice nor a recommendation, nor research, or a record of our trading prices, or an offer of, or solicitation for a transaction in any financial instrument and thus should not be treated as such. The information provided does not involve any specific investment objectives, financial situation and needs of any specific person who may receive it. Please be aware, that past performance is not a reliable indicator of future performance and/or results. Past Performance or Forward-looking scenarios based upon the reasonable beliefs of the third-party provider are not a guarantee of future performance. Actual results may differ materially from those anticipated in forward-looking or past performance statements. IC Markets makes no representation or warranty and assumes no liability as to the accuracy or completeness of the information provided, nor any loss arising from any investment based on a recommendation, forecast or any information supplied by any third-party.

Week of 6/1/25: AU AnalysisA lot of consolidation from the prior week, all time frames are technically bullish and internal 1h structure is bullish. I am going to be cautious around the current level until there is a prime entry model to get in long.
Major news:
PMI - Monday
PMI/ADP NFP - Wed
Unemployment Claims - Thurs
NFP/Unemployment rate - Friday

Technical Analysis on XAU/USD (Gold vs USD) – Bullish Reversal📊 Chart Overview:
This chart of XAU/USD (Gold) on a lower timeframe shows a potential bullish reversal setup. The price action has formed a series of lower highs and lower lows, but now a bullish momentum is building up, suggesting a possible breakout to the upside.
🔍 Key Observations:
🟠 Swing Points Identified:
The orange circles mark significant swing highs and lows, clearly outlining a recent downtrend.
The latest swing low (bottom-right) shows a strong rejection with a bullish engulfing candle forming, indicating buyer interest.
📦 Demand Zone (Support Area):
The grey rectangle near the lower region marks a demand zone where buyers have stepped in before.
Price has reacted strongly from this zone again, validating it as a key support level.
📉 Resistance Turned Potential Breakout Zone:
The red line (~3,291.416) represents a resistance level that was previously support.
Price has broken above it and now appears to be retesting it, indicating a possible retest-confirmation for a bullish continuation.
🎯 Target & Risk Management:
✅ Entry: Confirmed breakout and retest around 3,291.
📈 Target: 3,364.819 (green zone above), based on previous resistance.
❌ Stop Loss: Below 3,267.772, the recent swing low.
The setup offers a favorable risk-to-reward ratio.
🧭 Projection Path:
The white arrowed path illustrates a likely pullback before continuation upward, suggesting a bullish structure if confirmed.
✅ Conclusion:
Gold is showing signs of a bullish reversal from a well-defined demand zone, with a potential rally toward the 3,365 area. A successful retest of the broken resistance as new support would strengthen the bullish bias.
📌 Watch closely for confirmation candles on the retest before entering.

Can look for buy opportunities?EUR/USD Analysis Based on Engulfing Zones:
The red zone that has been marked is based on a weekly engulfing sell. The market has already touched this zone and dropped from there.
Now, among the green zones marked, the first one is taken from a 4H (4-hour) engulfing pattern, which has slightly less potential compared to the weekly one. However, the market can still go for a buy from here.
For now, wait until the market taps into any of the buy zones—then we can look for buy opportunities.
Three zones have been marked.
DYOR (Do Your Own Research)! Not Financial Advice.

EURUSDHello Traders! 👋
What are your thoughts on EURUSD?
EURUSD is still trading below a key resistance zone, showing signs of weakness and lack of strong bullish momentum. At this stage, it seems unlikely that the pair will break above the resistance in the short term.
We expect a downward correction toward the specified support levels, before any potential resumption of the uptrend.
Despite short-term weakness, our long-term outlook remains bullish, and this pullback could offer a better entry opportunity in line with the broader trend.
Don’t forget to like and share your thoughts in the comments! ❤️

USTECUSTEC price is near the resistance zone 21776-22139. If the price cannot break through the 22139 level, it is expected that the price will drop. Consider selling the red zone.
🔥Trading futures, forex, CFDs and stocks carries a risk of loss.
Please consider carefully whether such trading is suitable for you.
>>GooD Luck 😊
❤️ Like and subscribe to never miss a new idea!

EURJPY Weekly Analysis – Major Structural Breakout & Target🧱 1. Consolidation Zone: The Dual Directional Area
From around August 2024 to May 2025, EURJPY traded inside a well-defined consolidation range, marked between approximately 155.00 to 165.00. This phase can be categorized as a Dual Directional Zone, meaning both buyers and sellers had tactical entries, but the market was in accumulation/distribution mode.
This phase often traps breakout traders and builds liquidity on both sides.
Price repeatedly swept highs and lows inside this zone but lacked any commitment, signaling that larger players were building positions.
The flat structure over months hinted that a major move was imminent.
⚠️ 2. Major CHoCH (Change of Character)
The first clue of shifting momentum was the CHoCH, which signaled a change in direction and flow of control.
The lower highs and lower lows began to shift into higher lows, showing buying strength beneath the surface.
This change didn’t immediately lead to breakout, but it marked the early intention of bullish dominance.
🚀 3. Major BOS (Break of Structure): Confirming the Bullish Bias
The clean break above the range high was the confirmation of a major bullish BOS.
This wasn’t just a minor pop — it was an aggressive breakout, validating that institutional liquidity had been accumulated and was now being deployed.
The price ran swiftly toward the Bullish Target Zone (~177.50–180.00) with very little pullback, suggesting urgency from buyers or short-covering from trapped sellers.
🎯 4. Bullish Target Reached – What's Next?
Price has hit the projected Bullish Target Area — a region of prior imbalance and psychological round numbers.
Traders who caught the breakout now face a critical decision point: Will price continue higher into price discovery mode, or is this the exhaustion phase?
If price holds above the BOS level (~165.00), there’s still room for continuation. But signs of rejection or slowing momentum here could lead to a correction.
🔻 5. Bearish Alternative: Trap and Reversal Scenario
The bearish path is not out of play — in fact, this move upward could potentially be a liquidity sweep.
If price fails to stay above the BOS and rapidly closes back into the consolidation range, it would suggest a bull trap.
This would confirm a deviation, which often leads to violent reversals.
The projected Bearish Target Zone (~145.00–147.50) aligns with prior unmitigated zones and imbalance that may attract price if sentiment flips.
🧭 6. Trading Strategy & Risk Planning
For Bulls: Watch for consolidation above 165.00. Breakout + Retest entries toward 180.00 or beyond offer high R/R.
For Bears : Look for exhaustion or fakeout patterns (like a Quasimodo or supply engulfing) near current highs. A breakdown and close below 165.00 signals short entries targeting 150s and potentially 147s.
💬 Final Thoughts:
This chart is a prime example of how patience during a range and reaction after breakout pays off. Smart traders don’t chase — they prepare.
A bullish continuation may still be in play.
However, if this move was only a liquidity purge, the reversal could be deep and fast.
Stay alert, mark your key levels, and trade what you see — not what you feel.

USDJPY 4H Analysis – Market Dynamics ChangingDear Traders,
Guys, the bearish trend in USDJPY has now shifted into a bullish uptrend. My target level for USDJPY is 146.330. Once it reaches my target, I will share updates under this post.
Friends, every single like from you is my biggest source of motivation when it comes to sharing my analysis.
A huge thank you to everyone who supports me with their likes!
