NZDUSD: Move Up Ahead 🇳🇿🇺🇸
Thursday's and Friday's sessions were bullish on NZDUSD.
After a test of a rising trend line, the price formed
a double bottom pattern on a 4H time frame and violated its neckline.
I think that the pair may rise next week and reach at least 0.6 level.
❤️Please, support my work with like, thank you!❤️
I am part of Trade Nation's Influencer program and receive a monthly fee for using their TradingView charts in my analysis.
Forexsignals

Market next move 🚫 Disruption Points
1. No Clear Breakout Confirmation
Issue: The chart does not show a clear breakout of any recent highs or resistance levels.
Disruption: Without a break of a key level (like 1.3480–1.3500), the bullish target is premature.
2. Bearish Price Structure
Observation: The price has been making lower highs and lower lows over the last few candles.
Disruption: This may indicate a downtrend, not a setup for a bullish target.
3. Low Momentum
Issue: Volume appears to be declining, and recent bullish candles are smaller and weaker.
Disruption: The move toward the target may lack strength and could reverse without momentum.

Market next target 🔍 Original Analysis Summary
Resistance Zone: Around 1.1360
Support Zone: Same level after breakout (suggesting a breakout and retest pattern)
Target: Around 1.1450 after breakout
---
🚫 Disruption Points
1. False Breakout Risk
What could happen: Price might break the resistance briefly and then fall back below it.
Why: Lack of volume or confirmation, or a market maker trap to gather liquidity above the resistance zone.
Disruption: Instead of forming new support, it could become a bull trap leading to a sharp reversal.
2. Fundamental Risk
What could happen: Unexpected U.S. or Eurozone economic data (like NFP, CPI, or ECB/Fed announcements) may shift sentiment suddenly.
Why: The image shows upcoming news events (flag icons), which could induce volatility.
Disruption: The news might push EUR/USD sharply down even if a breakout occurs.
3. Bearish Divergence (if applicable)
What could happen: If RSI or MACD were included, they might show divergence while price is rising.
Why: Divergence typically precedes reversals.
Disruption: This would undermine the bullish breakout thesis.

Market next move ⚠️ Disruption of the Bullish Silver Setup:
---
1. Misleading Support-Resistance Interpretation
The resistance zone highlighted is flat and overlapping with multiple wicks.
The support zone is not well-established; it's only tested once or twice with weak bounce reaction, which is not enough to consider it strong support.
---
2. Lack of Bullish Confirmation
The price is currently hovering around the support with no breakout candle or strong bullish engulfing pattern.
The recent candlesticks near resistance are small-bodied with long wicks, suggesting indecision or weakening buying power, not strength.
---
3. Volume Disagreement
There's no surge in bullish volume that would confirm buyers stepping in.
The large red volume bars toward the right indicate selling pressure dominating, which contradicts the bullish target.
Market next move 🔍 Disruption of the Bullish Setup on GOLD:
1. Range Market Ignored:
The price is moving sideways in a tight consolidation, indicating range-bound behavior rather than a breakout setup.
The chart projects a bullish move, but there's no confirmed breakout of the resistance zone yet.
2. Weak Resistance Zone:
The identified “resistance” zone is very narrow and lacks strong rejection wicks or significant bearish volume.
It's unclear if this is true resistance or just part of the ongoing chop.
3. Lack of Volume Confirmation:
Volume remains moderate and doesn’t show increasing buying pressure, which would be expected if bulls were preparing a breakout.
No signs of volume climax or absorption, which are typical before breakouts.
4. Premature Targeting:
The target area is placed far above the resistance zone without a measured move or pattern basis (e.g., no flag, no cup-and-handle, no inverse head and shoulders).
This could be misleading as it sets unrealistic expectations.

Market next move 🔍 Disruption of the Current Bearish Setup:
1. Mislabeling of Levels:
The chart labels a newly broken support as "Support" still, even though price has clearly broken below that zone.
In proper technical analysis, once support is broken, it often turns into resistance, so the labels should be reversed.
2. Premature Downside Projection:
The bearish arrow assumes continued downside immediately after the breakdown, but there’s no confirmation candle or retest yet.
This could easily be a false breakdown or a liquidity sweep below support before a bounce.
3. No Confirmation from Volume:
Volume spiked on the breakdown, but the follow-up candle doesn’t confirm seller continuation.
Absence of sustained volume makes the move questionable. It could be a trap for breakout traders.
4. Lack of Trend Context:
The chart doesn't consider the broader trend. If BTC was in a strong uptrend before this pullback, this could be a bullish retracement, not a true reversal.
Drawing a trendline or checking a higher timeframe would help validate the direction.

Market next move Disruption of the Current Analysis:
1. False Breakout Risk:
The price is consolidating under a clearly marked resistance, but there’s no confirmation of a breakout yet.
The bullish arrows (prediction path) assume a breakout without waiting for a confirmed close above resistance, which is premature.
2. Low Momentum Candles:
The recent candles are small-bodied with wicks on both sides — signs of indecision.
No strong bullish momentum candle exists to support the projection.
3. Volume Mismatch:
Volume spiked recently, but the candle was red — this could indicate supply absorption or selling into strength, not accumulation.
A bullish scenario would require increasing volume on green candles breaking resistance.
4. Bearish Trend Context Ignored:
The chart shows a clear preceding downtrend, and what follows could simply be a bearish flag or dead cat bounce.
Marking this as the beginning of a bullish reversal overlooks the overall bearish context.

Market next move 🔍 Disruption/Critique of the Current Target Analysis:
1. Lack of Technical Justification:
The chart marks a “Target” level without referencing a clear technical basis (e.g., resistance, Fibonacci level, or moving average).
Without a corresponding pattern or indicator signal (e.g., breakout, double bottom, divergence), the target seems arbitrary.
2. Volume Spike Misinterpretation:
While there’s a volume spike in the last candle, it's accompanied by a bearish candle, suggesting potential selling pressure, not buying strength.
A bullish continuation would ideally require a green candle with increasing volume, which is absent here.
3. Market Context Ignored:
No consideration of broader market context such as macroeconomic news, DXY strength, or interest rate expectations which heavily impact GBP/USD.
The U.S. flag icon indicates upcoming news – trading before such events can be risky and invalidate the technical target.
4. Resistance Zone Overlooked:
The “Target” lies near the 1.3500 psychological level, which often acts as resistance. This isn’t discussed or marked.
Recent price action near that level shows rejection, making it a questionable target without strong buying confirmation

EURGBP Megaphone bottom. Strong buy opportunity.The EURGBP pair is trading within a Bullish Megaphone since the start of the year. For the past 2 weeks it has been ranging within the 1D MA50 (blue trend-line) and 1D MA200 (orange trend-line).
This is technically the bottom formation of the pattern on its new Higher Low, as the 1D RSI has been printing the same sequence as February's which priced the previous Higher Low.
We are expecting at least a Resistance 1 test at 0.87400.
-------------------------------------------------------------------------------
** Please LIKE 👍, FOLLOW ✅, SHARE 🙌 and COMMENT ✍ if you enjoy this idea! Also share your ideas and charts in the comments section below! This is best way to keep it relevant, support us, keep the content here free and allow the idea to reach as many people as possible. **
-------------------------------------------------------------------------------
Disclosure: I am part of Trade Nation's Influencer program and receive a monthly fee for using their TradingView charts in my analysis.
💸💸💸💸💸💸
👇 👇 👇 👇 👇 👇

Pipping the Aussie-Swiss Bank: Day Trading Strategy UnleashedUltimate AUD/CHF Forex Heist Plan 🚨 Swing Trade Mastery for Epic Gains! 🚀
Greetings, Wealth Warriors & Market Mavericks! 👋💸
Get ready to execute a legendary heist on the AUD/CHF "Aussie vs Swissy" Forex market with our exclusive Thief Trading Style! 🎯 This meticulously crafted strategy blends technical precision and fundamental firepower to maximize your profits. Follow the plan outlined in the chart, focusing on a long entry to conquer the high-risk Yellow MA Zone—a battleground of overbought conditions, consolidation, and potential trend reversals where bearish bandits lurk. 🐻 Stay sharp, lock in profits, and trade safely! 💪🎉
Entry 📈: The heist begins! Watch for the MA pullback in the market maker’s trap zone (0.52200 OR above) to strike. Bullish riches await! Set buy stop orders above the Moving Average or place buy limit orders within the 15 or 30-minute timeframe’s recent swing low/high.
Pro tip: Set an alert to catch the breakout entry in action! 🔔
Stop Loss 🛑: Place your Thief SL at the recent swing low/high on the 4H timeframe for swing trades basis. Adjust SL based on your risk tolerance, lot size, and multiple orders.
Target 🎯: Aim for 0.54800 or make a swift exit before the target to secure your loot!
🧲 Scalpers, listen up! 👀 Stick to long-side scalps. Big players can jump in now; others, join the swing trade heist. Use a trailing SL to protect your stash. 💰
💵 AUD/CHF "Aussie vs Swissy" Forex Heist Plan (Swing Trade) is riding a bullish wave 🐂, fueled by critical market drivers. Dive into the fundamentals—Macro Economics, COT Reports, Quantitative Analysis, Intermarket Analysis, Sentiment Outlook, and Future Trends—before launching your heist. Check the linkKs for the full scoop! 🔗👉
📌 Markets move fast, so stay vigilant and adapt your analysis to the latest developments.
⚠️ Trading Alert: News & Position Management 📰🚨
News releases can shake up prices and volatility. Protect your positions by:
Avoiding new trades during news events
Using trailing stop-loss orders to lock in gains
💖 Boost our heist plan! 💥 Hit the Boost Button to supercharge our team’s strength and make stealing profits a breeze. With the Thief Trading Style, you’ll conquer the market daily with ease! 🏆🤝🎉
Stay tuned for the next epic heist plan, Money Makers! 🤑🐱👤🚀

USDCAD: Bearish After the News 🇺🇸🇨🇦
USDCAD looks bearish after a release of today's fundamental news.
A bearish breakout of a rising channel on a 4h time frame
and a strong selling reaction after its retest provide
a reliable bearish continuation.
I think that the price may drop to 1.3743 support.
❤️Please, support my work with like, thank you!❤️
I am part of Trade Nation's Influencer program and receive a monthly fee for using their TradingView charts in my analysis.

EURGBP forex swing trade playing out off weekly demand levelThe EURGBP forex swing trade playing out off weekly demand level as expected. I hope you are taking advantage of this investment opportunity. There is a lot of profit for margin for this Forex cross pair.

EURNZDHello Traders! 👋
What are your thoughts on EURNZD?
The EURNZD pair is currently trading below a key resistance zone, showing signs of hesitation near this level.
We expect the price to consolidate briefly within this area, and then decline toward the specified support level if the resistance holds.
As long as the pair remains below resistance, the bearish bias remains intact, and a move lower is likely.
Don’t forget to like and share your thoughts in the comments! ❤️

Bearish drop off overlap resistance?The Loonie (USD/CAD) is rising towards the pivot, which has been identified as an overlap resistance and could drop to the 50% Fibonacci support.
Pivot: 1.3861
1st Support: 1.3767
1st Resistance: 1.3912
Risk Warning:
Trading Forex and CFDs carries a high level of risk to your capital and you should only trade with money you can afford to lose. Trading Forex and CFDs may not be suitable for all investors, so please ensure that you fully understand the risks involved and seek independent advice if necessary.
Disclaimer:
The above opinions given constitute general market commentary, and do not constitute the opinion or advice of IC Markets or any form of personal or investment advice.
Any opinions, news, research, analyses, prices, other information, or links to third-party sites contained on this website are provided on an "as-is" basis, are intended only to be informative, is not an advice nor a recommendation, nor research, or a record of our trading prices, or an offer of, or solicitation for a transaction in any financial instrument and thus should not be treated as such. The information provided does not involve any specific investment objectives, financial situation and needs of any specific person who may receive it. Please be aware, that past performance is not a reliable indicator of future performance and/or results. Past Performance or Forward-looking scenarios based upon the reasonable beliefs of the third-party provider are not a guarantee of future performance. Actual results may differ materially from those anticipated in forward-looking or past performance statements. IC Markets makes no representation or warranty and assumes no liability as to the accuracy or completeness of the information provided, nor any loss arising from any investment based on a recommendation, forecast or any information supplied by any third-party.

Could the price bounce from here?USD/JPY is falling towards the pivot and could bounce to the 1st resistance, which acts as a pullback resistance.
Pivot: 143.25
1st Support: 141.80
1st Resistance: 145.97
Risk Warning:
Trading Forex and CFDs carries a high level of risk to your capital and you should only trade with money you can afford to lose. Trading Forex and CFDs may not be suitable for all investors, so please ensure that you fully understand the risks involved and seek independent advice if necessary.
Disclaimer:
The above opinions given constitute general market commentary, and do not constitute the opinion or advice of IC Markets or any form of personal or investment advice.
Any opinions, news, research, analyses, prices, other information, or links to third-party sites contained on this website are provided on an "as-is" basis, are intended only to be informative, is not an advice nor a recommendation, nor research, or a record of our trading prices, or an offer of, or solicitation for a transaction in any financial instrument and thus should not be treated as such. The information provided does not involve any specific investment objectives, financial situation and needs of any specific person who may receive it. Please be aware, that past performance is not a reliable indicator of future performance and/or results. Past Performance or Forward-looking scenarios based upon the reasonable beliefs of the third-party provider are not a guarantee of future performance. Actual results may differ materially from those anticipated in forward-looking or past performance statements. IC Markets makes no representation or warranty and assumes no liability as to the accuracy or completeness of the information provided, nor any loss arising from any investment based on a recommendation, forecast or any information supplied by any third-party.

Bearish reversal off pullback resistance?The Kiwi (NZD/USD) is rising towards the pivot, which has been identified as a pullback resistance and could reverse to the 1st support, which is also a pullback support.
Pivot: 0.6024
1st Support: 0.5846
1st Resistance: 0.6131
Risk Warning:
Trading Forex and CFDs carries a high level of risk to your capital and you should only trade with money you can afford to lose. Trading Forex and CFDs may not be suitable for all investors, so please ensure that you fully understand the risks involved and seek independent advice if necessary.
Disclaimer:
The above opinions given constitute general market commentary, and do not constitute the opinion or advice of IC Markets or any form of personal or investment advice.
Any opinions, news, research, analyses, prices, other information, or links to third-party sites contained on this website are provided on an "as-is" basis, are intended only to be informative, is not an advice nor a recommendation, nor research, or a record of our trading prices, or an offer of, or solicitation for a transaction in any financial instrument and thus should not be treated as such. The information provided does not involve any specific investment objectives, financial situation and needs of any specific person who may receive it. Please be aware, that past performance is not a reliable indicator of future performance and/or results. Past Performance or Forward-looking scenarios based upon the reasonable beliefs of the third-party provider are not a guarantee of future performance. Actual results may differ materially from those anticipated in forward-looking or past performance statements. IC Markets makes no representation or warranty and assumes no liability as to the accuracy or completeness of the information provided, nor any loss arising from any investment based on a recommendation, forecast or any information supplied by any third-party.

Bearish drop off pullback resistance?GBP/USD has rejected off the pivot and could drop to the 1st support, which aligns with the 127.2% Fibonacci extension.
Pivot: 0.6446
1st Support: 0.6358
1st Resistance: 0.6538
Risk Warning:
Trading Forex and CFDs carries a high level of risk to your capital and you should only trade with money you can afford to lose. Trading Forex and CFDs may not be suitable for all investors, so please ensure that you fully understand the risks involved and seek independent advice if necessary.
Disclaimer:
The above opinions given constitute general market commentary, and do not constitute the opinion or advice of IC Markets or any form of personal or investment advice.
Any opinions, news, research, analyses, prices, other information, or links to third-party sites contained on this website are provided on an "as-is" basis, are intended only to be informative, is not an advice nor a recommendation, nor research, or a record of our trading prices, or an offer of, or solicitation for a transaction in any financial instrument and thus should not be treated as such. The information provided does not involve any specific investment objectives, financial situation and needs of any specific person who may receive it. Please be aware, that past performance is not a reliable indicator of future performance and/or results. Past Performance or Forward-looking scenarios based upon the reasonable beliefs of the third-party provider are not a guarantee of future performance. Actual results may differ materially from those anticipated in forward-looking or past performance statements. IC Markets makes no representation or warranty and assumes no liability as to the accuracy or completeness of the information provided, nor any loss arising from any investment based on a recommendation, forecast or any information supplied by any third-party.

Falling towards 61.8% Fibonacci support?The Cable (GBP/USD) is falling towards the pivot, which serves as pullback support and could bounce to the 1st resistance, which acts as pullback resistance.
Pivot: 1.3315
1st Support: 1.3159
1st Resistance: 1.3586
Risk Warning:
Trading Forex and CFDs carries a high level of risk to your capital and you should only trade with money you can afford to lose. Trading Forex and CFDs may not be suitable for all investors, so please ensure that you fully understand the risks involved and seek independent advice if necessary.
Disclaimer:
The above opinions given constitute general market commentary, and do not constitute the opinion or advice of IC Markets or any form of personal or investment advice.
Any opinions, news, research, analyses, prices, other information, or links to third-party sites contained on this website are provided on an "as-is" basis, are intended only to be informative, is not an advice nor a recommendation, nor research, or a record of our trading prices, or an offer of, or solicitation for a transaction in any financial instrument and thus should not be treated as such. The information provided does not involve any specific investment objectives, financial situation and needs of any specific person who may receive it. Please be aware, that past performance is not a reliable indicator of future performance and/or results. Past Performance or Forward-looking scenarios based upon the reasonable beliefs of the third-party provider are not a guarantee of future performance. Actual results may differ materially from those anticipated in forward-looking or past performance statements. IC Markets makes no representation or warranty and assumes no liability as to the accuracy or completeness of the information provided, nor any loss arising from any investment based on a recommendation, forecast or any information supplied by any third-party.

Market next move ⚠️ 1. Weak Bullish Continuation Signal
The current price action shows a rejection wick on a red candle, signaling selling pressure near the recent highs.
Despite the upward move earlier, this could be a short-term exhaustion rather than strength for further upside.
---
📉 2. No Follow-Through After Bullish Spike
There was a strong bullish candle earlier, but:
No significant follow-up to break past that level convincingly.
Price appears to have stalled or even reversed after that spike — possibly forming a bull trap.
---
🔄 3. Overhead Resistance at Target Area
The "TARGET" label sits near recent highs, which have already been rejected once.
Without clear breakout volume, this zone might act as resistance, not a logical next stop.

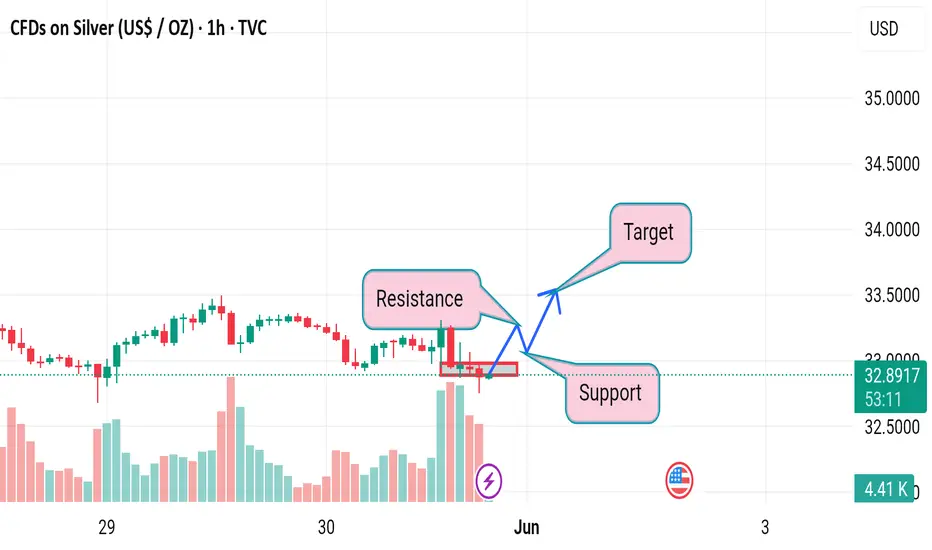
Market next target ⚠️ 1. Bearish Momentum Remains Intact
The last few candles are strongly bearish, with steep declines and high red candle volume.
Attempting to project an upside target amid this current bearish drive lacks alignment with actual market sentiment.
---
📉 2. Lack of Reversal Candlestick Patterns
There is no clear bullish reversal pattern visible at the point of target placement:
No hammer, bullish engulfing, or morning star pattern.
The price may just be pausing before continuing its downward trend.
---
🔊 3. Volume Discrepancy
The rising volume on red candles vs. low volume on recent green candles shows selling pressure outweighs buying interest.
A reliable bullish setup would typically come with higher buying volume after a selloff, which is not yet seen.
---
🧭 4. Misleading “Target” Location
The marked target is at a higher high, near 33.75–34.00 area, which:
Is not supported by immediate technical breakout
Seems to ignore the last failed attempt to break above that level
Appears overly optimistic given the current trend direction

Market next move
🔍 1. Weak Confirmation for Target Level
The marked "TARGET" area lacks strong technical confirmation such as:
Resistance zone retest.
Fibonacci level confluence.
Moving average alignment.
Without solid technical backing, this target may appear speculative.
---
📉 2. Bearish Momentum is Strong
The last few candles show strong red (bearish) momentum.
The price has broken short-term support levels (e.g., local lows from the 29th).
Volume is increasing on bearish candles, signaling strong selling pressure.
Setting a bullish target while in a bearish momentum phase might be premature.
---
🕒 3. Timeframe Limitations
This is a 1-hour chart, which is more prone to noise and false signals.
Higher timeframes (like 4H or Daily) should be checked to validate this upward target.

BEST XAUUSD M30 BUY & SELL SETUP FOR TODAY 📉📊 Gold (XAU/USD) Technical Outlook – Key Decision Zone Incoming! ⚠️📈
Gold prices are currently testing a crucial support zone around 3,251, following a strong bearish momentum. As shown on the M30 chart, the market is now at a make-or-break level, where two potential scenarios could unfold: either a bullish reversal toward the 3,280–3,300 area if price holds and confirms support ✅, or a bearish continuation if the level breaks, pushing price lower toward 3,220 or beyond ❌. Traders should watch for price action signals and wait for a clear breakout or strong bounce confirmation before entering any trades 🧠🔍. This is a high-volatility reaction zone — trade smart! 🎯📉📈

BEST GOLD M30 BUY SETUP FOR TODAY📉 Gold is currently showing signs of a potential pullback towards the key demand zone around 3,290–3,285 marked in purple. This area has previously acted as a strong support and could trigger a bullish reversal if price reacts positively here. 🟪 Once the price enters this zone and forms a bullish confirmation (like a rejection wick or bullish engulfing candle), we could see a strong upward move targeting 3,320+ 📈. Traders should stay alert for buying opportunities from this zone and avoid chasing the price before a clear confirmation! 🎯⚡
