GBPJPY is about to fly to 172.500 '' long term'' we have previously shared our analysis for pound yen where we expected a drop from 164.200.
we are closing our sell positions now with 400+ pips and placing buys from 159.670
SL & TP are shown on the chart. please use proper risk management and remember it's a long-term trade that could take up to 1-2 months.
Forexsignalservice

US30 New Entries + Exits (Best Reverse Strat)The 1on1 video is currently out, if you would like it in order to understand how to play my analysis FULLY, please let me know privately.
All likes/comments and feedback are very much appreciated!
How to play my chart:
Buy at support, sell at resistance. When you open this chart you'll see a green entry and a red entry. When the candlestick hits the green entry, you place a buy. If however that support buy doesn't go into profit and goes negative -35 or -60 pips (depending if it was a fast break/or if the break landed on a minute 15 zone), if it breaks you would then exit your buy and immediately enter the sell. You would then ride that sell down to green TP1, or you could then repeat and play the buy/break there.
The same exact thing goes for resistance sell/break plays!

NAS100 New Entries + Exits (Best Reverse Strat)The 1on1 video is currently out, if you would like it in order to understand how to play my analysis FULLY, please let me know privately.
All likes/comments and feedback are very much appreciated!
How to play my chart:
Buy at support, sell at resistance. When you open this chart you'll see a green entry and a red entry. When the candlestick hits the green entry, you place a buy. If however that support buy doesn't go into profit and goes negative -35 or -60 pips (depending if it was a fast break/or if the break landed on a minute 15 zone), if it breaks you would then exit your buy and immediately enter the sell. You would then ride that sell down to green TP1, or you could then repeat and play the buy/break there.
The same exact thing goes for resistance sell/break plays!

SPX500 Entries + Exits for FREE (Best Reverse Strat)The 1on1 video is currently out, if you would like it in order to understand how to play my analysis FULLY, please let me know privately.
All likes/comments and feedback are very much appreciated!
How to play my chart:
Buy at support, sell at resistance. When you open this chart you'll see a green entry and a red entry. When the candlestick hits the green entry, you place a buy. If however that support buy doesn't go into profit and goes negative -35 or -60 pips (depending if it was a fast break/or if the break landed on a minute 15 zone), if it breaks you would then exit your buy and immediately enter the sell. You would then ride that sell down to green TP1, or you could then repeat and play the buy/break there.
The same exact thing goes for resistance sell/break plays!


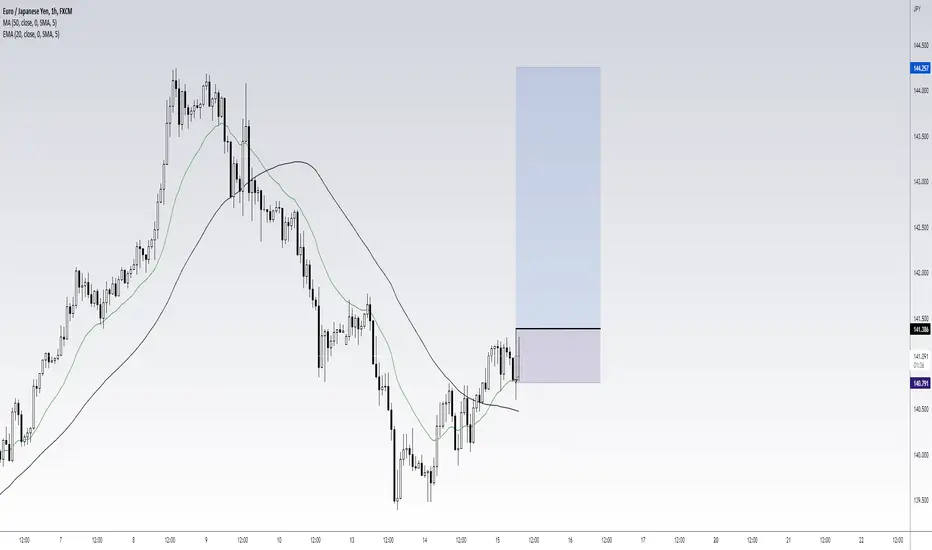
EUR/JPY BUY STOPS. Trend Continuation I am looking at EUY/JPY Buys at this area. I only provide trade entries.
usdcad | bearish movement to profit fromnice selling opportunity for usdcad, moving towards the downside nicely on most of the time frames, new low on 15-minute time frame. we are seeing a push > exhaustion scenario on 1-hour plus a bearish engulfing candlestick developing suggesting bearish power in the market.

✅USDMXN SHORT IDEA✅On 4H timeframe i am expecting USDMXN to be bearish
✅As per my setup and strategy I am expecting price to fall lower to Tracey 19.80200 before reaching their retracement is possible
✅For more accurate entry, look at 30M or 1H chart for better entry.
✅Plan risk management according to your requirements
Note :This is my personal opinion, do not take it as financial advise

Nzdcad Up🔥🔥Nzdcad is ready to up
**Divergence in RSI & MACD
**Weakness in the process
** reversal head & shoulders

AUD/CADBuy: AUD / CAD
Buy limit: 0.91290
SL @ 0.90870
TP @ 0.92050
Max Risk: 2%
(When calculating, do not forget about different spreads from Brokers)
Leave comments or likes to keep our content free and alive.
Have a good week to everyone
It is not an investment recommendation

GBPUSD trade update, it was shared yesterday.The analysis is based on support and resistance, the trade has a risk ratio of 1;4.5 with a Stop-loss of 16pips and a Take profit of 72pips.

EURUSD Analysis outcome and profitsEURUSD Analysis outcome and profits. Price moved as expected to the sell side liquidity but it blasted through it as explained earlier in the free forex live session done in the morning.

GBPUSD, 45 Short positionThe price downwards and fixes in the short zone. Potential price movement to the zone in the chart. That's my opinion to survey and follow.

Bitcoin Entries + Exits! The 1on1 video is currently out, if you would like it in order to understand how to play my analysis FULLY, please let me know privately.
All likes/comments and feedback are very much appreciated!
How to play my chart:
Buy at support, sell at resistance. When you open this chart you'll see a green entry and a red entry. When the candlestick hits the green entry, you place a buy. If however that support buy doesn't go into profit and goes negative -35 or -60 pips (depending if it was a fast break/or if the break landed on a minute 15 zone), if it breaks you would then exit your buy and immediately enter the sell. You would then ride that sell down to green TP1, or you could then repeat and play the buy/break there.
The same exact thing goes for resistance sell/break plays!

UKOil potential for bounce! 1st April 2022Prices are approaching a pivot. We see the potential for a bounce from our buy entry at 101.54 in line with an area of Fibonacci confluences towards our Take Profit at 111.57 in line with 100% Fibonacci Projection. RSI are at levels where bounces previously occurred, supporting our bullish bias.
Prices are on bearish momentum and abiding by a descending trendline resistance. We see the potential for a bounce from our buy entry at Any opinions, news, research, analyses, prices, other information, or links to third-party sites contained on this website are provided on an "as-is" basis, as general market commentary, and do not constitute investment advice. The market commentary has not been prepared in accordance with legal requirements designed to promote the independence of investment research, and it is therefore not subject to any prohibition on dealing ahead of dissemination. Although this commentary is not produced by an independent source, FXCM takes all sufficient steps to eliminate or prevent any conflicts of interest arising out of the production and dissemination of this communication. The employees of FXCM commit to acting in the clients' best interests and represent their views without misleading, deceiving, or otherwise impairing the clients' ability to make informed investment decisions. For more information about the FXCM's internal organizational and administrative arrangements for the prevention of conflicts, please refer to the Firms' Managing Conflicts Policy. Please ensure that you read and understand our Full Disclaimer and Liability provision concerning the foregoing Information, which can be accessed on the website.

AUD/NZD Upside? Surely....AUD/NZD is trending to the upside currently and has made a retracement back into a key pivot area, and the moving average ribbon (1H chart). We anticipate a bounce from these key support zones, targeting upside into 1.08550.

USD/JPY Signal - USD Redbook Index - 29 March 2022USD/JPY has formed a double top pattern today, having hit a 20 year resistance level. In addition, one of our algorithms has taken a sell trade, adding additional confluence to the short position. We are targeting downside to 121.300, and will be trailing stoploss at 50 pips above price.

EUR/CHF Signal - EUR Consumer Confidence - 29 Mar 2022EURCHF has rebounded out of the key resistance level at 1.030 prior to the EUR Consumer Confidence data today. Consumer confidence data is set to be released from both France and Germany today, and given the current tensions in the EU it is likely that consumer confidence will have plummeted. Negative consumer confidence will weigh on the Euro, particularly against the Swiss franc which is deemed a safe haven currency.
Technically the pair is holding below the resistance trendline, has broken the ascending trendline, has bounced from the 1.030 resistance, and is below the moving average ribbon (4H chart). We anticipate continued downside into the recent lows.

eurusd buyon the weekly chart we notice the price reaching a strong support level and bouncing off it again

GBPJPY - Weekly/ Daily/ 4h Sell IdeaBeen putin specially attention to this paior this week, since it has been giving clear and good trend continuations, price went on a strong bullish impulses but yesterday it created a 4h structure wich was a sign to possible go long again but daily failed to close above the previous daily/weekly WTL and closed below that structure so right now my main bias is bearish if daily manage to stay below the 156.00 area and to fully confirm it we must wasit for london to see where the breakout will be.

Forex Trading By Market Order Flow Analysis My Trading Strategy is based on Price Action and Order Flow. This strategy follows supply/demand, trend trading, and trend reversal setup. The aim is to trade with low risk and good reward trade setup

EUR/GBP About to flop again?EUR/GBP has been getting slammed, mainly due to increasing tensions in the Ukraine. We anticipate the downtrend to continue, and current prices over a fantastic short opportunity.
Currently retail sentiment is between 65-70% long.
Resistances include the 0.8300 signficiant figure, the short term trendline, and the 50% fibonacci level.

Looking here At AUD/CAD For a potential Short Would love to hear your opinion on this particular set up, Please do let me know your thought!
Disclaimer- any information shared is for Educational Purposes only and shouldn't be taken as investment ADVICE
For Educational and Demo purposes
