Forexsignalservice

EUR/GBP: Potential 580 pips - Short with 12.5 R/RDear Traders all around the world
If you like this analysis feel free to like and follow not to miss any of my setups.
EUR/GBP is approaching a bearish Orderblock on the 3D chart. Therefore I‘m anticipating a Short position with two different targets. On the one hand I‘m looking at a 6.0 R/R position while aiming for a bullish Orderblock along with POC.
On the other hand I‘m anticipating a 12.5 R/R Short in case EUR/GBP decides to fulfill and retest a bullish OB that lays alot lower.
Updates will be provided in the comment section.


sell break out of corrective flagprice action moved impulsively and broke lower trendline of the ascending channel, currently a correction pattern is forming clearly on lower degree timeframes, sell breakout again

AUDUSD NEUTRAL BIASPrice have reached the top of a strong weekly range at the 0.7130 area ,i woudl say this is a critical area for this pair since it has been already 3 touches where price hasnt been able to to break and clsoe above indicazting a strong psychological level for sellers,so right now im waiting patiently for the following confirmations to go long or go short and thsoe are :
1. Reversal pattern below the mentioned area to go short
2. Daily clsoe below 0.7120 to confirm a new downdrend
3. Close above 0.7140 to go long
Lets wait and see hwo the daily closes

GBPJPY Neutral BiasThis pair is on a critical area right now where a lot conditions could say that price will drop,we got a 3rd touch to the descending daily TL,MP fib with 38% and 50% that lines up with a 4h ichimoku,so right now i woudl wait till we get a clsoe in the lower timeframes below 145.70 to go short or above 146.50 to go long

AUDJPY Neutral BiasAnother JPY o na strogn bullish momentum and this pair right now is testing the top of the formed TL,so right now i would like to take a long position i want to see if tomorrow we can get a daily close above the previous high at 79.40


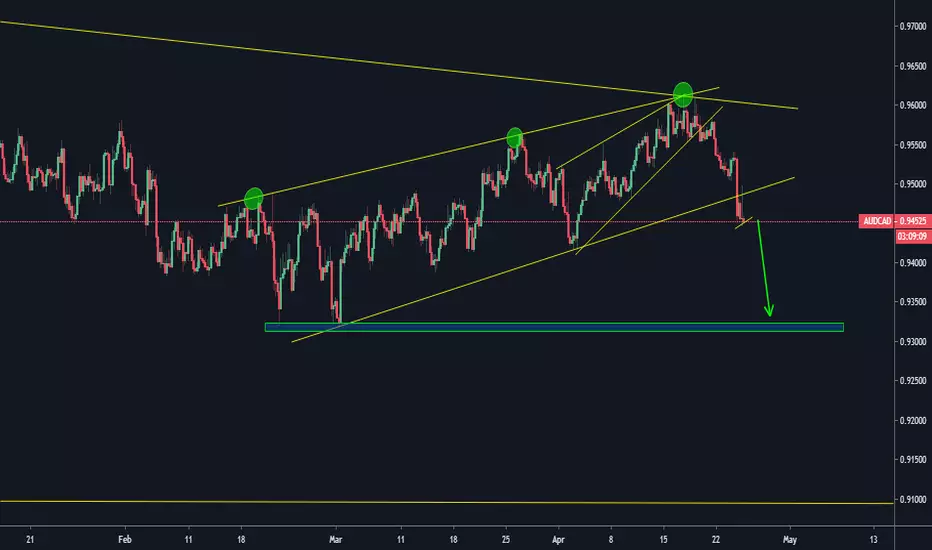
AUDCAD LongAUDCAD has assumed a bullish shape. Currently we anticipate consolidating into long positions just above the blue trend line shown with target in the 0.96388 region. However, any price move or price close on a daily basis below 0.9352 zone invalidates the bullish outlook
Happy Trading!
www.trading-equity.com
www.facebook.com

EURUSD Prepare for big longHey Traders,
We've approached the key support and resistance level and started to slow down on that level on daily chart.
Market also made a doji candle which shows the sign of reversal from this level
If we look at 4h, we'll get decent image of how momentum from sellers is dying and how buyers are coming in hot.
Waiting to see final retest from sellers and then buyers to come in hot.
Target is at 1.14485 level.

USDJPY POSSIBLE RETEST OF TRIANGLEUSDJPY finally trying to retrace at the previous structure level. If price manages to go at previous structure and we see a clear reversal signal we can definitely enter long continuing it's breakout after a clear retest. Good R/R ratios if we manage to enter that low. Keep this at your radar, and as always, enjoy!


USD CHF Analysis: Intraday Timeframe Bullish Chart PatternConclusion for today’s USD CHF Analysis: The USD CHF is expected to continue bullish momentum, and price should target ~1.01651.
USD CHF analysis for today is carried out on an intraday (6 hour) timeframe. Over 11 months of price action is covered starting from February 16, 2018 to current date. A rising wedge is identified and helps as part of the process of providing context for price action for the duration mentioned above.
A bullish flag is identified in the USD CHF with bullish price swing from January 10, 2019 to January 22, 2019 forming the pole and flag completed in 6 trading days (between January 22, 2019 and February 04,2019).
Projection of the termination of the flag’s implication is shown by the red arrow i.e. the USD CHF is expected to target the upper boundary of its current wedge at ~ 1.01651.
Price closing below 0.99093 invalidates the current USD CHF analysis.


USDJPY Trade Idea: The Strength of the 15min ReracementThe US Dollar (USD) weakened on Friday on reports a short-term funding bill will re-open the US government for several weeks (at least). Based on the 15min Chart USDJPY may have reached its support (as highlighted on the char), paving the way for corrective gains.
The potential target as well as the possible location of the protective stop are marked on the chart.


FOREX Trading Performance on trading view 16-21 DEC 2018Not a good trading week was difficult to judge
but still profitable due to good trades after FED
9 trade charts posted only 5 profitable 4 losers
oil was the best trade thought wouldn't break down
but it did caught just in time, Gbpnzd and usdcad
worst trades gbpnzd bounce of resistance but NZD had other
ideas it was in bear market i was bullish on AUD, NZD, CAD
coming into the week due to dollars weakness but i was
completely wrong stop saved me USDCAD no sign of trend change
i was trying to short serious carelessness and a big mistake on
my part, really I not know how i came out profitable

USDCHF WATCHING for a Sell...D1- Daily ChartDear Investors,
First things first: THERE ISN´T A TRADING SIGNAL YET!
Currently I´m watching USDCHF ...
I would love to see a nice breakout of the red dottet line and than a reversal...OR..a few dominant bearish candles
Please find further details on the chart.
I´ll keep you updated if I´m entering this one.
Hello Worthy
Decide. Commit. Succeed.
Wealth consists not in having great possessions, but in having few wants. --Epictetus
I wish you success!
Please support the setup with your likes, comments and by following on Tradingview thanks.

TRADE NO=6 LET'S DO ITCurrency Pair: AUDUSD
Sell Limit Entry Price:1.7100
Take Profit:1.7000
Stop Loss:1.71500
Capital Risk:500USD(amount may vary depending on your account size and risk tolerance)
Potential Reward: 1000USD
Risk/Reward: 1:2

SUGAR BUYPrice is forming a continuation pattern to the upside. Wait for the price to hit the bottom of the pattern and watch strong price action for buy.
Don’t take a trade if you don’t see clearly when big guys are in.

NZDUSD Bullish trend BeginsBullish reversals identified including the popular head and shoulder candle stick patterns.
